Grafana-zabbix: Grafana 7 connect to Zabbix 5 on Raspberry pi 4B : Could not connect to given url
Trying to connect Grafana to Zabbix on RapsberryPi 4B-4Gb (Arm7), Raspbian full, but get '_Could not connect to given url_' in Grafana Data Sources GUI
My RPI have zabbix server/agent/grafana installed.
Zabbix GUI : 192.168.1.16:81/zabbix (I've used port 81, because 80 used by OpenMediaVault
Grafana GUI : 192.168.1.16:3000
Zabbix server and agent working fine.
I've created an dedicated user for Zabbix API with password simple, without ' and " to avoid issue in curl.
I've tried in command line :
sudo curl -H "Content-Type: application/json-rpc" -X POST http://192.168.1.15:81/api_jsonrpc.php -d '{"jsonrpc":"2.0","method":"user.login","id":1,"auth":null,"params":{"user": "zbx_api","password": "_mypassword_"}}'
Returned :
{"jsonrpc":"2.0","result":"7cd4c83aa46f5753d270609b8dcd6610","id":1}

| Grafana | Zabbix | Grafana-Zabbix Plugin |
| -------- | -------- | --------------------- |
| v7.1.1 (3039f9c3bd) | 5.0.1 | 3.12.3 |
 stephanepapin
All 19 comments
You said you have Zabbix on 192.168.1.16, but entered 192.168.1.15. Doesn't it a reason?
 alexanderzobnin
on 21 May 2020
alexanderzobnin
on 21 May 2020
I am also having the same problem, I have been trying to configure for two days, but without success.
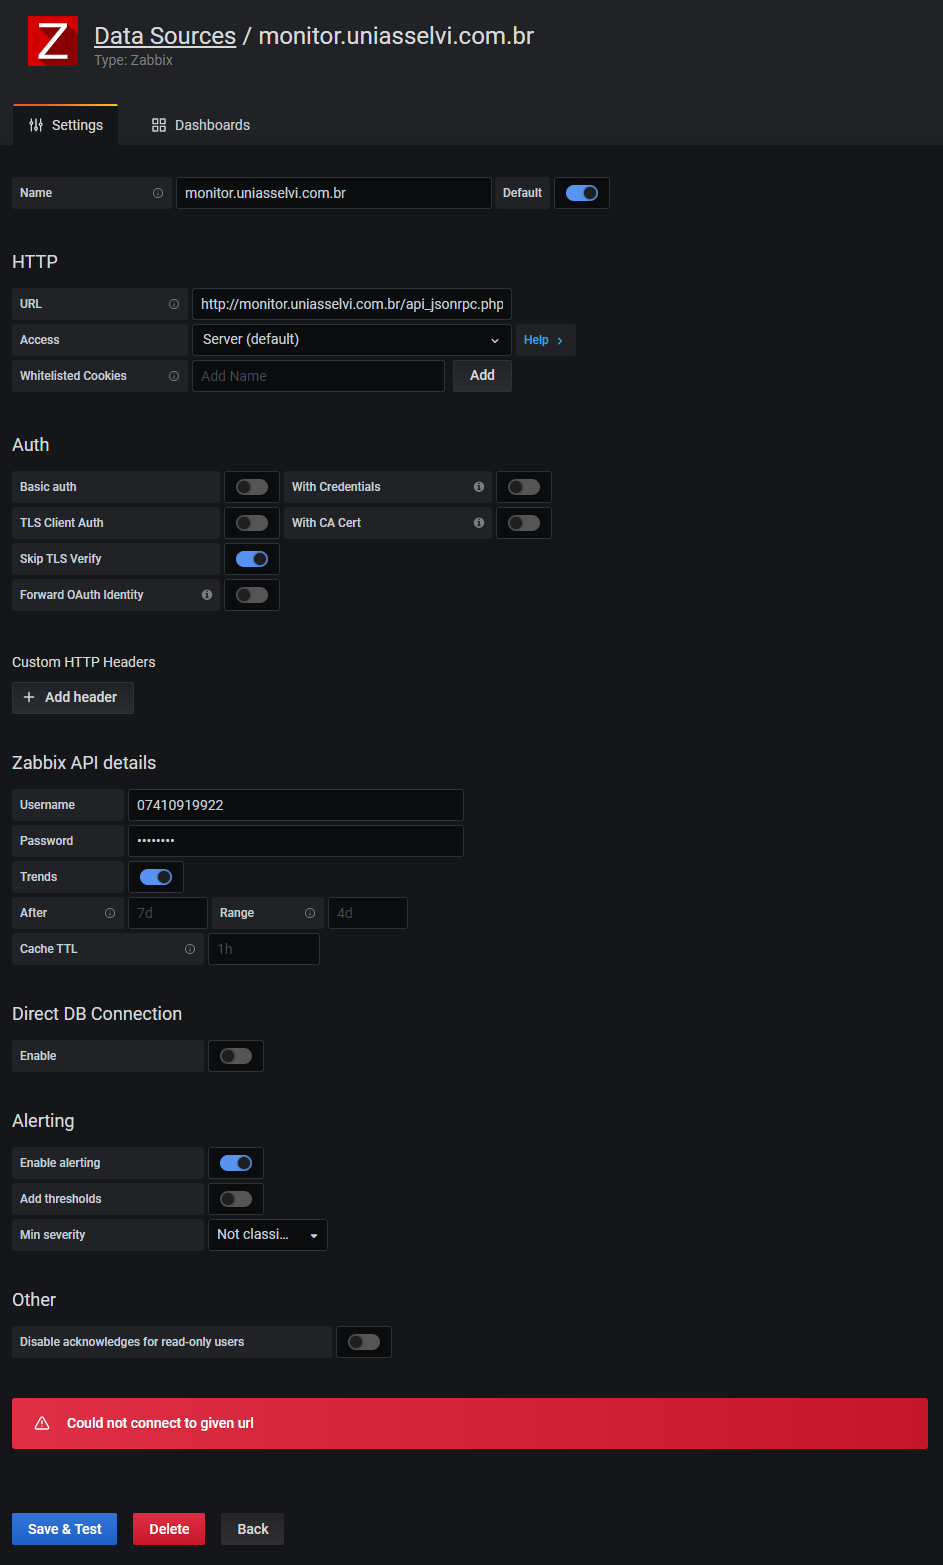
 ismaelmano7
on 21 May 2020
ismaelmano7
on 21 May 2020
Just to reinforce, the plugin worked normally, with zabbix in version 3.4 and Grafana in version 6 ... After updating zabbix to version 5.0 and grafana to version 7.0, it stopped working.
ismaelmano7
on 21 May 2020
You said you have Zabbix on
192.168.1.16, but entered192.168.1.15. Doesn't it a reason?
Hi Mistake from me : 192.168.1.15 in all case :)
stephanepapin
on 21 May 2020
God, I also encountered this problem, who can tell me what to do
 fushengbao
on 22 May 2020
fushengbao
on 22 May 2020
good afternoon!
I'm also having the same problem, it doesn't make the connection.
 cendudu
on 26 May 2020
cendudu
on 26 May 2020
God, I also encountered this problem, who can tell me what to do
No problem with zabbix4.0
fushengbao
on 28 May 2020
same here with 5.0
 Zabbixsogetrel
on 29 May 2020
Zabbixsogetrel
on 29 May 2020
In prerequisites is grafana 6.x so probably not yet supported ?
 chladic
on 29 May 2020
chladic
on 29 May 2020
I think it can sounds stupid but have you selected the correct zabbix version in combo box on data source config?
In the first image it is configured with version 4.X, if you have version 5.0 it must cause the issue
 silveraignacio
on 8 Jun 2020
silveraignacio
on 8 Jun 2020
I think it can sounds stupid but have you selected the correct zabbix version in combo box on data source config?
In the first image it is configured with version 4.X, if you have version 5.0 it must cause the issue
Just see this version item, but I've retried, no way to find in datasource config panel
stephanepapin
on 9 Jun 2020
Weird! It is present on version 3.10.2 but I hadn't got time to test the new one. I had this issue before. Plugin was not able to connect to zabbix due to combo box version.
silveraignacio
on 9 Jun 2020
I've just test direct connect to zabbix mysql DB working
stephanepapin
on 9 Jun 2020
After upgrading Zabbix to 5.0 and Grafana to 7.0 I have got the "Could not connect to given url" error.
For me the cause was that the official Zabbix web docker container has changed HTTP port from 80 to 8080: https://github.com/zabbix/zabbix-docker/issues/602
So changing the url from http://zabbix_web/api_jsonrpc.php to http://zabbix_web:8080/api_jsonrpc.php has fixed the issue for me.
The Plugin version is 3.12.0, I didn't notice any other issues.
 KostyaEsmukov
on 12 Jun 2020
KostyaEsmukov
on 12 Jun 2020
After upgrading Zabbix to 5.0 and Grafana to 7.0 I have got the "Could not connect to given url" error.
For me the cause was that the official Zabbix web docker container has changed HTTP port from 80 to 8080: zabbix/zabbix-docker#602
So changing the url from
http://zabbix_web/api_jsonrpc.phptohttp://zabbix_web:8080/api_jsonrpc.phphas fixed the issue for me.The Plugin version is 3.12.0, I didn't notice any other issues.
I'm using dedicated port for my front
stephanepapin
on 12 Jun 2020
I've just test direct connect to zabbix mysql DB working
connection to DB is ok but still issue with
stephanepapin
on 26 Jul 2020
Update version of all components to :
| Grafana | Zabbix | Grafana-Zabbix Plugin |
| -------- | -------- | --------------------- |
| v7.1.1 (3039f9c3bd) | 5.0.1 | 3.12.3 |
Still same issue
stephanepapin
on 26 Jul 2020
After upgrading Zabbix to 5.0 and Grafana to 7.0 I have got the "Could not connect to given url" error.
For me the cause was that the official Zabbix web docker container has changed HTTP port from 80 to 8080: zabbix/zabbix-docker#602
So changing the url from
http://zabbix_web/api_jsonrpc.phptohttp://zabbix_web:8080/api_jsonrpc.phphas fixed the issue for me.The Plugin version is 3.12.0, I didn't notice any other issues.
This worked for me, Seems that URL for Zabbix API has been changed in version 5, I replaced "zabbix/api_jsonrpc.php" with just "api_jsonrpc.php" and connected successfully.
 jividijuvent
on 27 Jul 2020
jividijuvent
on 27 Jul 2020
Working : Fine http://myzabbixserverip:myfrontport/api_jsonrpc.php 👍
Next step and issue, default dashboard Zabbix N#A
stephanepapin
on 27 Jul 2020
Related issues
 daianmartinho
·
6Comments
daianmartinho
·
6Comments
 ufoloko
·
7Comments
ufoloko
·
7Comments
 xiaoxue999
·
3Comments
xiaoxue999
·
3Comments
 Akabell95
·
8Comments
Akabell95
·
8Comments
 b1nary1
·
4Comments
b1nary1
·
4Comments
Most helpful comment
God, I also encountered this problem, who can tell me what to do