Grafana-zabbix: After upgrade grafana to 5.X and zabbix pluggin to 3.9, zabbix triggers panel is not working
I'm submitting a ...
- [X] Bug report
- [ ] Feature requestdd
- [ ] Question / Support request
Software Versions
| Grafana | Zabbix | Grafana-Zabbix Plugin |
| ------- | ------ | --------------------- |
| 5.1.2 | 3.2.6 | 3.9.1 |
What did you do?
I upgraded Grafana to 5.1.2 and Zabbix plugin to 3.9.1
What was the expected result?
All dashboards to work
What happened instead?
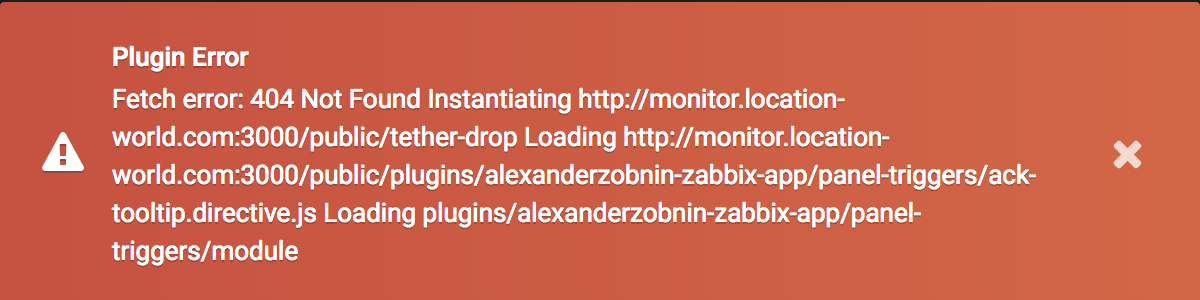
Zabbix Triggers Panel is not working, I receive error in next image. All other dashboards are working normally
 ufoloko
All 7 comments
Looks like a cache issue? Can you reset browser cache and try again?
 alexanderzobnin
on 1 Jun 2018
alexanderzobnin
on 1 Jun 2018
Issue cleared by clearing browser cache.
 krptg
on 13 Jun 2018
krptg
on 13 Jun 2018
Hi @alexanderzobnin ,
I just install the grafana 5 , instaled the zabbix plugin using the grafana-cli , configured successfully my zabbix datasource and then import a zabbix template where get this same error:
I tried clear the browser cache or opening it in private mode (firefox), the error still occuring.
Plugin Error
Fetch error: 404 Not Found Instantiating http://jdivm04:3000/public/react Loading http://jdivm04:3000/public/plugins/alexanderzobnin-zabbix-app/panel-triggers/module.js Loading plugins/alexanderzobnin-zabbix-app/panel-triggers/module
I enable at grafana.ini the parameters below but no useful data appear at the log files .
[log]
mode = console file
level = debug

-----

t=2019-03-15T14:28:54-0300 lvl=info msg="Request Completed" logger=context userId=1 orgId=1 uname=admin method=GET path=/public/react status=404 remote_addr=101.0.0.53 time_ms=3 size=7210 referer="http://jdivm04:3000/d/IjsnQZqmz/linux-zabbix-server?orgId=1"
t=2019-03-15T14:28:54-0300 lvl=info msg="Request Completed" logger=context userId=1 orgId=1 uname=admin method=GET path=/public/react-dom status=404 remote_addr=101.0.0.53 time_ms=4 size=7210 referer="http://jdivm04:3000/d/IjsnQZqmz/linux-zabbix-server?orgId=1"
Also, when I create a new dashboard when I tried to include the "Zabbix Problem" panel, give the same error.
How can I collect more information to try understand what is happen ?
Ps.: I'm new to grafana, no experience with it yet.
 ceinmart
on 15 Mar 2019
ceinmart
on 15 Mar 2019
@ceinmart Plugin should work with Grafana 5.4.3. Ensure you have latest 5.x version.
alexanderzobnin
on 18 Mar 2019
I installed v5.0 from the openSuse repository.
Removed it and installed the last version tarball , 6.0.2 , it's working now!
Thank you!
ceinmart
on 19 Mar 2019
 qianxiaodewo
on 4 Sep 2019
qianxiaodewo
on 4 Sep 2019
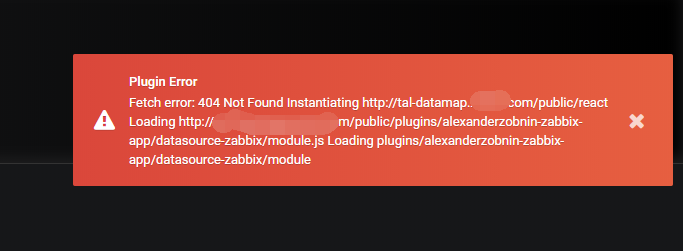
my use grafana-cli plugins install alexanderzobnin-zabbix-app
install fils

qianxiaodewo
on 4 Sep 2019
Related issues
 Akabell95
·
8Comments
Akabell95
·
8Comments
 moisesreis
·
6Comments
moisesreis
·
6Comments
 maxlehot1234
·
5Comments
maxlehot1234
·
5Comments
 eraffaelli
·
4Comments
eraffaelli
·
4Comments
 gustavoyanes
·
7Comments
gustavoyanes
·
7Comments