Grafana-zabbix: grafana 6.4.2 edit Problems panel faild.
grafana 6.4.2 edit Problems panel faild.


 xiaoxue999
All 72 comments
I am having the same issue. This is the result after clicking "edit"

 dannyhanes
on 11 Oct 2019
dannyhanes
on 11 Oct 2019
I'm using plugin v3.10.4 with Grafana v6.4.2 and I'm getting the same errors when trying to edit a "Zabbix Problems" panel/widget.
 eans-tsi
on 14 Oct 2019
eans-tsi
on 14 Oct 2019
+1
 duuz
on 14 Oct 2019
duuz
on 14 Oct 2019
@alexanderzobnin we need a new release with this. What's about a quick 3.10.5 release before going to 3.11?
 mjtrangoni
on 14 Oct 2019
mjtrangoni
on 14 Oct 2019
+1
 gsrcobr
on 14 Oct 2019
gsrcobr
on 14 Oct 2019
Hello same issue with plugin v3.10.4 with Grafana v6.4.2
did someone found a temporary fix, for now im using panels' creation links to edit my panel.
 pierrottls
on 15 Oct 2019
pierrottls
on 15 Oct 2019
+1
 heshammhafez
on 15 Oct 2019
heshammhafez
on 15 Oct 2019
Hi, same problem with same versions
 juannvalencia
on 15 Oct 2019
juannvalencia
on 15 Oct 2019
+1
 winderickxeli
on 17 Oct 2019
winderickxeli
on 17 Oct 2019
+1, when entering "Raw Document" under "Metric" in a new panel where "Table" is chosen as the Visualization... We are talking about 6 hits (small log-files)..
 ramasif
on 18 Oct 2019
ramasif
on 18 Oct 2019
+1
 katsil
on 18 Oct 2019
katsil
on 18 Oct 2019
+1
 sadamkim
on 18 Oct 2019
sadamkim
on 18 Oct 2019
+1 as well.
 pancake62
on 18 Oct 2019
pancake62
on 18 Oct 2019
+1
 manojsivan
on 21 Oct 2019
manojsivan
on 21 Oct 2019
+1
 darkydash
on 21 Oct 2019
darkydash
on 21 Oct 2019
+1
 amar3lo
on 21 Oct 2019
amar3lo
on 21 Oct 2019
+1
 joaoceragioli
on 21 Oct 2019
joaoceragioli
on 21 Oct 2019
Okay, so I don't know if this will fix it for everyone else, but as the error message states: "Grafana has likely been updated.."... Well updating Grafana to the newest version (6.4.3) actually fixed it for me.
As stated in the release notes here
"Table: Proper handling of json data with dataframes."
also stating
"What this PR does / why we need it:
When using Raw Document query with Elasticsearch there's a special response from datasource that is used which includes a type field with the value json. In the table panel there is a transformation for JSON data which up until this fix didn't work at all due to the new data structure we call data frames."
Hope this helps.
ramasif
on 22 Oct 2019
Hi, Updated grafana to latest and issue still persists. Same error when you try to create a new dashboards.
manojsivan
on 22 Oct 2019
Me too
heshammhafez
on 22 Oct 2019
+1 @alexanderzobnin Same thing happened to me:
| Grafana | Zabbix | Grafana-Zabbix Plugin |
| ------- | ------ | --------------------- |
| 6.4.3 | 4.2.6 | 3.10.4 |
Just weird since problems list works, but we can't edit the panel anymore.
An update of the grafana-zabbix plugin will probbaly fix this ;)
Thanks in advance
 maxlehot1234
on 22 Oct 2019
maxlehot1234
on 22 Oct 2019
+1
 WastlBastl
on 23 Oct 2019
WastlBastl
on 23 Oct 2019
+1
 Grzyboll
on 23 Oct 2019
Grzyboll
on 23 Oct 2019
+1
 borjasueiro
on 24 Oct 2019
borjasueiro
on 24 Oct 2019
Is anyone working on this issue ?, because almost 2 weeks have passed and there isn't any feedback!
heshammhafez
on 24 Oct 2019
That's a bug due to changes in Grafana. Looks like panel editor tries to execute panel queries even if
skipDataQuery set to true in plugin.json. I will open an issue in Grafana as well, but it looks like I should do something with problems panel query format. Using targets as a map instead of array causes a lot of problems.
 alexanderzobnin
on 28 Oct 2019
alexanderzobnin
on 28 Oct 2019
Just confirming exact same for me too;
Zabbix 4.2.6
Grafana 6.4.3
Zabbix-Plugin 3.10.4
 ta391993
on 4 Nov 2019
ta391993
on 4 Nov 2019
Any news on this?
maxlehot1234
on 5 Nov 2019
the same terrible thing :(
after update to last grafana version all dashboards with plugin not edditable
sad...
 randomayzer
on 12 Nov 2019
randomayzer
on 12 Nov 2019
Zabbix 4.2.7.
Grafana 6.4.4 ( no fix the issue )
Zabbix-Plugin 3.10.4
 oscar-munoz
on 12 Nov 2019
oscar-munoz
on 12 Nov 2019
It's not possible also remove "functions" applied to queries / sources from zabbix
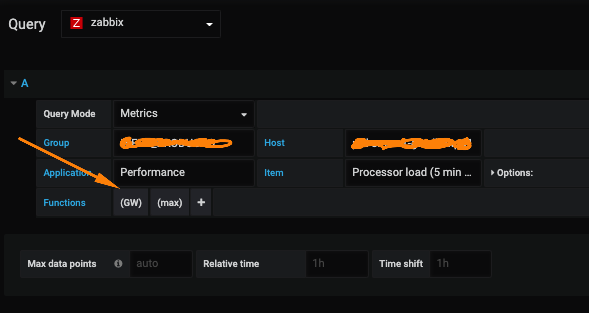
Clicking in any area of a function enables only editing label or parameters, but you are not able to remove applied function
alexanderzobnin-zabbix-app @ 3.10.4
grafana-6.4.4-1.x86_64
gsrcobr
on 13 Nov 2019
@alexanderzobnin You are probably busy but do you have an ETA for 3.11 version? Too many errors/bugs that prevent all of us to "work" properly.
Thanks again and maybe you can push the 3.11 version and another 3.11.X later to fix other bugs.
That could be great.
maxlehot1234
on 13 Nov 2019
I also have this issue.
Does anyone know it there is a workaround?
Or how to temporary solve this issue?
I use grafana version 6.4.4 and alexanderzobnin-zabbix-app version 3.10.4.
 StaelensJarne
on 19 Nov 2019
StaelensJarne
on 19 Nov 2019
i have the same issue.
grafana 6.4.3
zabbix-plugin 3.10. 4
 jwhclw
on 21 Nov 2019
jwhclw
on 21 Nov 2019
Is there a workaround for this problem?
Or has anyone found how to edit these panels?
Because I think this is a well known issue.
StaelensJarne
on 21 Nov 2019
Well we all have to wait the 3.11 release which will probbaly take weeks...
The actual dev was quite busy I think and doesn't want to release a 3.11 and a 3.11.X later.......
Thats just really bad and we need to deal with this. @alexanderzobnin doesn't reply to actual tickets or doesn't reply to us for more than 20 days now :(
We just need to still put our problem in this ticket so he can finally push a fixed version...
maxlehot1234
on 21 Nov 2019
When you want do edit your panel you can do this As a workaround:
You can create a new Trigger Panel, But you Need to know all settings you did there before.
So I still wait for the Update too...
WastlBastl
on 21 Nov 2019
When you want do edit your panel you can do this As a workaround:
You can create a new Trigger Panel, But you Need to know all settings you did there before.So I still wait for the Update too...
Doesn't seems to work for me. Still having issue :( I will wait for an update in 2020 (I hope)
maxlehot1234
on 21 Nov 2019
When you want do edit your panel you can do this As a workaround:
You can create a new Trigger Panel, But you Need to know all settings you did there before.So I still wait for the Update too...
You can edit your panel after creating it by passin through "More..." and "Panel JSON" it works for me, it's harder than the usual way but in the wait, it's still better than recreating your panel each time you want to change it
 leoplanchin
on 25 Nov 2019
leoplanchin
on 25 Nov 2019
I have found a more permanent solution.
Downgrading to Grafana version 6.0.0. This is the version before this issue.
StaelensJarne
on 25 Nov 2019
I have found a more permanent solution.
Downgrading to Grafana version 6.0.0. This is the version before this issue.
That is not a solution (much less a permanent one) but a temporary workaround.
 Blogshot
on 25 Nov 2019
Blogshot
on 25 Nov 2019
+1
 zelfix
on 26 Nov 2019
zelfix
on 26 Nov 2019
+1
 seyacat
on 27 Nov 2019
seyacat
on 27 Nov 2019
+1 @alexanderzobnin ? Still alive?
maxlehot1234
on 27 Nov 2019
Same problem for me too,
Zabbix Server 4.0 LTS and Grafana 6.4.4 but im with this problem since 6.4.2 or 6.4.3 (i dont remember, but i updated to see if would solve, but nothing). I need help to this,
 juniorsaldanha
on 28 Nov 2019
juniorsaldanha
on 28 Nov 2019
Same problem for me too,
Zabbix Server 4.0 LTS and Grafana 6.4.4 but im with this problem since 6.4.2 or 6.4.3 (i dont remember, but i updated to see if would solve, but nothing). I need help to this,
No fix will be released soon. WE all wait for more than a month without a reply from the dev...
Probably 2020?
maxlehot1234
on 28 Nov 2019
Zabbix 4.4, Zabbix plugin 3.10.4 and Grafana 6.5.0 I'm with similar problem:
TypeError: t.queries.map is not a function
 Chumachos
on 3 Dec 2019
Chumachos
on 3 Dec 2019
+1
Grafana | Zabbix | Grafana-Zabbix Plugin
-- | -- | --
6.4.4 | 4.4.0 | 3.10.4
 elsopapa
on 3 Dec 2019
elsopapa
on 3 Dec 2019
+1
TypeError: n.targets.map is not a function
 renatoborges78
on 3 Dec 2019
renatoborges78
on 3 Dec 2019
+1
 ywj198
on 5 Dec 2019
ywj198
on 5 Dec 2019
+1
Grafana Zabbix Grafana-Zabbix Plugin
6.5.1 4.4.0 3.10.4
Grafana Zabbix Grafana-Zabbix Plugin
6.5.1 4.0.13 3.10.4
 carlgan
on 6 Dec 2019
carlgan
on 6 Dec 2019
+1
 piterjakubowski
on 6 Dec 2019
piterjakubowski
on 6 Dec 2019
+1
 brunoemr
on 9 Dec 2019
brunoemr
on 9 Dec 2019
Same error with "t.queries.map":
An unexpected error happened
Details
TypeError: t.queries.map is not a function
in t
in div
@alexanderzobnin ?? Please, push an update
maxlehot1234
on 10 Dec 2019
+1
 leferocha
on 11 Dec 2019
leferocha
on 11 Dec 2019
Zabbix-Server 4.41
Zabbix plugin 3.10.3
Grafana 6.4.0
I have the same problem
 robpuretz
on 12 Dec 2019
robpuretz
on 12 Dec 2019
Zabbix-Server 4.4.1
Zabbix plugin 3.10.4
Grafana 6.4.4
Same issue persists.
Also, variables can not be used in the 6.4 Grafana for the Zabbix Problems panel.
 kajohe
on 16 Dec 2019
kajohe
on 16 Dec 2019
Also, variables can not be used in the 6.4 Grafana for the Zabbix Problems panel.
In Grafana version 6.0.0 I can use variables in the Zabbix Problem panel without any problems.
StaelensJarne
on 16 Dec 2019
+1
 naigamo
on 18 Dec 2019
naigamo
on 18 Dec 2019
Same problem for us too,
Grafana 6.5.1
Zabbix Plugin 3.10.4
TypeError: t.queries.map is not a function
 guliangsi
on 18 Dec 2019
guliangsi
on 18 Dec 2019
I downgraded to version 6.3.6.
the panel works again very well.
 mrhernandes
on 18 Dec 2019
mrhernandes
on 18 Dec 2019
Did use the same db ?
On Wed, Dec 18, 2019, 13:17 mrhernandes notifications@github.com wrote:
I downgraded to version 6.3.6.
the panel works again very well.—
You are receiving this because you commented.
Reply to this email directly, view it on GitHub
https://github.com/alexanderzobnin/grafana-zabbix/issues/817?email_source=notifications&email_token=ACK7TXNWX3K2VETSKY72WPDQZJEJRA5CNFSM4I7WH6S2YY3PNVWWK3TUL52HS4DFVREXG43VMVBW63LNMVXHJKTDN5WW2ZLOORPWSZGOEHGU25I#issuecomment-567102837,
or unsubscribe
https://github.com/notifications/unsubscribe-auth/ACK7TXO5WZ2ZBQTE35PF42TQZJEJRANCNFSM4I7WH6SQ
.
elsopapa
on 19 Dec 2019
+1
 gordonpt
on 19 Dec 2019
gordonpt
on 19 Dec 2019
@alexanderzobnin Seriously?? 2 months and no update?? Thats really bad :(
You see the amount of people having issue witgh the same thing? Release a 3.11 version and a 3.11.1 later?
Thanks
maxlehot1234
on 19 Dec 2019
Just installed Grafana this morning. Zabbix and Grafana (and plugin) are fresh and new - having the same issue. I can create the Dashboard but once created I can't go back and edit it.

 mglennon
on 19 Dec 2019
mglennon
on 19 Dec 2019
yes same db mysql
mrhernandes
on 19 Dec 2019
+1 , postgresdb
 havedill
on 19 Dec 2019
havedill
on 19 Dec 2019
I downgraded to version 6.3.6.
the panel works again very well.
How can I downgrade to this version?
Chumachos
on 23 Dec 2019
Fixed. I'm going to prepare patch release this week.
alexanderzobnin
on 25 Dec 2019
Solved,
Thank you very much for your incredible work and dedicated time.
juannvalencia
on 31 Dec 2019
@alexanderzobnin same issue still happening on v6.5.2. Can you please check?

 rickrb
on 25 Mar 2020
rickrb
on 25 Mar 2020
Related issues
 pikaniou
·
7Comments
pikaniou
·
7Comments
 KevinInphos
·
4Comments
KevinInphos
·
4Comments
 jameskirsop
·
8Comments
xiaoxue999
·
3Comments
jameskirsop
·
8Comments
xiaoxue999
·
3Comments
 mdiorio
·
5Comments
mdiorio
·
5Comments
Most helpful comment
That's a bug due to changes in Grafana. Looks like panel editor tries to execute panel queries even if
skipDataQueryset totruein plugin.json. I will open an issue in Grafana as well, but it looks like I should do something with problems panel query format. Usingtargetsas a map instead of array causes a lot of problems.