Grafana-zabbix: Ability to show a host name for one host in graph
I'm submitting a ...
- [ ] Bug report
- [x] Feature requestdd
- [ ] Question / Support request
_If you don't send bug report, remove sections below_
For bug report please include this information:
Software Versions
| Grafana | Zabbix | Grafana-Zabbix Plugin |
| ------- | ------ | --------------------- |
| x.x.x | x.x.x | x.x.x |
What did you do?
_Describe here_
What was the expected result?
_Describe here_
What happened instead?
_Describe here_
If it relates to metric data visualization would be great to get
- An image or text representation of your metric query
- The raw query and response for the network request (check this in chrome dev tools network tab, here you can see metric requests and other request, please include the request body and request response)
 Semiadmin
All 10 comments
Hi, Alexander.
There isn't the hostname in the graph if all charts belong to a single host. It's good in most cases, but I'd like to be able to alter this behavior.
For example, I'm using the variable $host, selected "All", and got the charts of only one host. Maybe, other hosts don't have such values or the "top" filter used and a single host won all prises.
In this case, the hostname is unclear.
Semiadmin
on 18 May 2018

Hello @alexanderzobnin How to show a host name only in graph. Sorry my english.
 thanhtuan
on 16 Oct 2018
thanhtuan
on 16 Oct 2018
@thanhtuan use replaceAlias() function.
 alexanderzobnin
on 28 Nov 2018
alexanderzobnin
on 28 Nov 2018
Hi Guys. Is there any update?
I have the same issue when creating a dashboard which contains multiple zabbix datasource.
If there is only one host in that zabbix, it won't show the hostname.
 Firxiao
on 2 May 2019
Firxiao
on 2 May 2019
Added in 6729de0e489c99358fe2dc6e55e0542c85f572aa
It's possible now with setAlias($__zbx_host_name: $__zbx_item)
alexanderzobnin
on 13 Apr 2020
The problem isn't solved. Because i've got the same problem with Version 5.4.3 of Grafana. I have a overview of different VMs and their Volume usage. Now for Volume M: There is only one entry. And this entry only shows the item name and not the name of the virtual machine. All the other ones whrere there are more than one machines with the same item shows it in the right way.
Any Idea?
 fabianfasserIX
on 18 Jun 2020
fabianfasserIX
on 18 Jun 2020
@fabianfasserIX Did you try to use setAlias($__zbx_host_name: $__zbx_item)?
alexanderzobnin
on 18 Jun 2020
Yes but it only works for one specific host. If I use the Filer "All" it takes every single host into it.
fabianfasserIX
on 18 Jun 2020
@alexanderzobnin
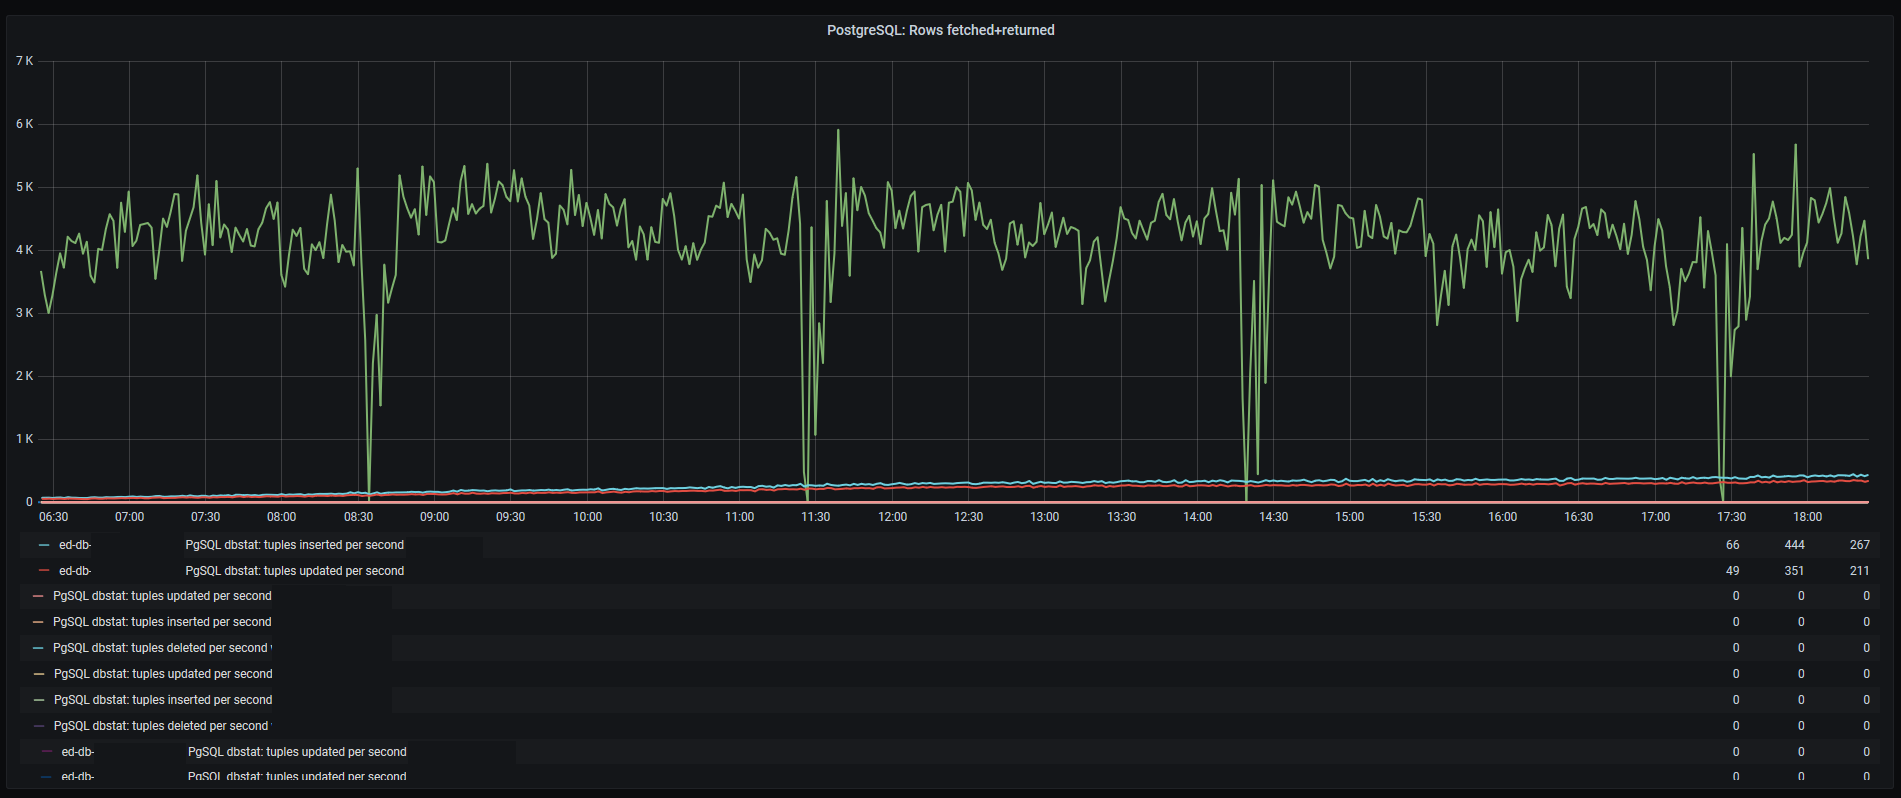
$__zbx_host_name may contain dozens of hosts, so it is not possible to make this kind of aliasing.
It is especially annoying for mixed datasource graph connected to several zabbix instances.
Suddenly it becomes a mix of named and unnamed hosts:
 vldbel
on 20 Jul 2020
vldbel
on 20 Jul 2020
Sorry, setAlias($__zbx_host_name: $__zbx_item) works. But it requires to edit all the graphs in all dashboards to add setAlias function - not pretty easy task.
Is there a chance to get that fixed on a plugin level?
vldbel
on 20 Jul 2020
Related issues
 b1nary1
·
4Comments
b1nary1
·
4Comments
 ufoloko
·
7Comments
ufoloko
·
7Comments
 tolstiyman
·
7Comments
tolstiyman
·
7Comments
 mdiorio
·
5Comments
mdiorio
·
5Comments
 moisesreis
·
6Comments
moisesreis
·
6Comments
Most helpful comment
Added in 6729de0e489c99358fe2dc6e55e0542c85f572aa
It's possible now with
setAlias($__zbx_host_name: $__zbx_item)