Ghidra: Learning Ghidra reversing hangs after a while on 8.5mb app
Describe the bug
Each time I'm trying to reverse via anlayze on MacOS 10.15 Java 14 I get hung in Ghidra says on bottom right decomplingin FUN and some name of function
To Reproduce
Steps to reproduce the behavior:
Always reproducible any any app really ?
Expected behavior
A clear and concise description of what you expected to happen.
Analysis is started in code browser and gets to Decompiling FUN_10000db57 and hangs (7% 165 of 2484)
Screenshots
If applicable, add screenshots to help explain your problem.
Attachments
let me know what to attach and I've been able to replicate it each time on the few apps I've tried. I did some of the tutorials from cracks of me with no issue.
Environment (please complete the following information):
- OS: macOS 10.15.5
- Java Version: 14.0.1 +7
- Ghidra Version: 9.1.2
Additional context
Happy to help understand the issue but
 todddube
All 13 comments
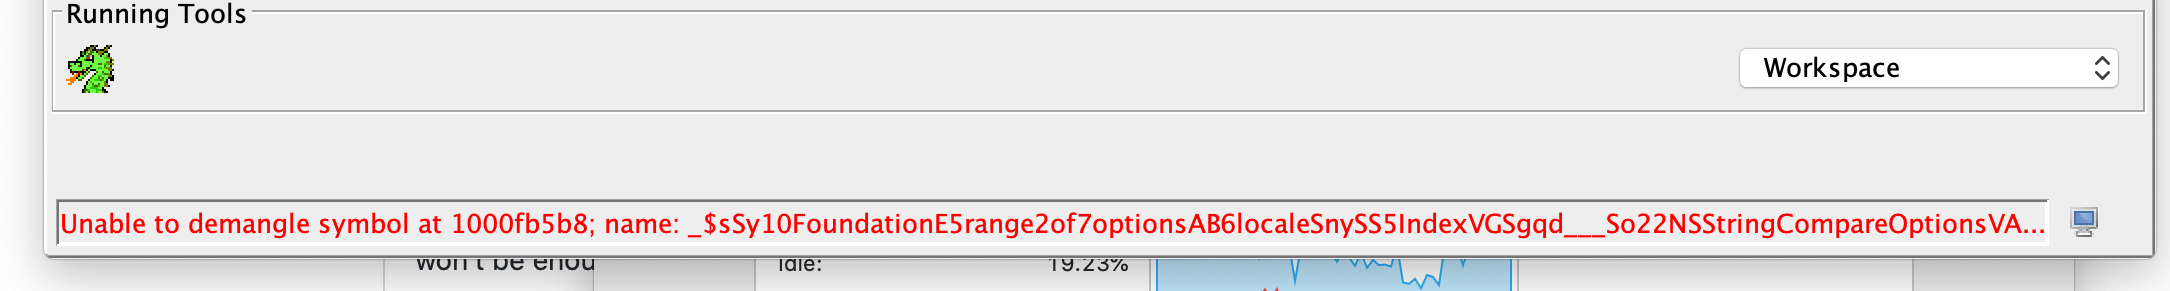
Finally got the project window to pop up - could this be the case ?
todddube
on 2 May 2020
Finally got the project window to pop up - could this be the case ?
Symbols which fail to be demangled is quite common. There is no fool proof way to know if a symbol is mangled especially for pre gccv3. What you see there is more of a warning to inform the user or devs when viewing the log.
Try disabling the "Call Convention ID", "Decompiler Parameter ID" and "Decompiler Switch Analysis" analyzers. Usually when I encounter something of this nature one of them is the culprit.
 astrelsky
on 3 May 2020
astrelsky
on 3 May 2020
Finally got the project window to pop up - could this be the case ?
Symbols which fail to be demangled is quite common. There is no fool proof way to know if a symbol is mangled especially for pre gccv3. What you see there is more of a warning to inform the user or devs when viewing the log.
Try disabling the "Call Convention ID", "Decompiler Parameter ID" and "Decompiler Switch Analysis" analyzers. Usually when I encounter something of this nature one of them is the culprit.
Thanks - this seemed to work and good to know.
todddube
on 3 May 2020
Also, try changing the Decompiler timeout option down from its high value. Edit->ToolOptions->Decompiler->DecompilerTimeout. For analysis I have mine at 30 seconds. Been thinking of adding two separate timeouts. One for interactive, and one for analysis. The large timeout bit me as well in the WindowsResourceAnalyzer. The analysis should in general be fast and something taking a long time can be dealt with later.
If analysis or the decompiler is always hanging on a particular function, you may want to look at the function to see if there are issues like non-returning functions there. You can also turn off certain analysis that is taking up too much time, and run them later as @astrelsky mentioned.
 emteere
on 11 May 2020
emteere
on 11 May 2020
Symbols which fail to be demangled is quite common.
What's the process for dealing with failed demangled symbols? I had a project that had an extensive list of failed symbols and I think it prevented certain pieces from decompiling correctly
 russkel
on 12 May 2020
russkel
on 12 May 2020
Thanks everyone - the above fixed my issue and I've made note of @emteere comment as well. @russkel that was my concern.. but I'm just learning reverse engineering as a hobby.
todddube
on 12 May 2020
Symbols which fail to be demangled is quite common.
What's the process for dealing with failed demangled symbols? I had a project that had an extensive list of failed symbols and I think it prevented certain pieces from decompiling correctly
My first suggestion would be to take the failed symbol and pass it through the compiler's demangler if available (c++filt for gcc). If the compiler's demangler doesn't demangle it then it isn't mangled and you don't need to worry about it. If it is mangled and was failed to be parsed then you should consider opening a bug report. Just search through the issues prior to reporting to ensure it hasn't already been reported. Also please note that the demangling system has gone through extensive changes since 9.1.2 and might have already been fixed.
astrelsky
on 12 May 2020
Thanks @astrelsky I'll try exactly that. The compiler was an old vxworks one so I'm not sure if the demangler is easily found.
Good to hear about 9.2 improvements, looking forward to it.
russkel
on 13 May 2020
Thanks @astrelsky I'll try exactly that. The compiler was an old vxworks one so I'm not sure if the demangler is easily found.
Good to hear about 9.2 improvements, looking forward to it.
This may be of interest to you then. https://github.com/NationalSecurityAgency/ghidra/blob/master/Ghidra/Features/GnuDemangler/ghidra_scripts/VxWorksSymTab_Finder.java
astrelsky
on 13 May 2020
@astrelsky that's fantastic. 9.2 can't come soon enough! Thanks for pointing that out.
russkel
on 13 May 2020
@astrelsky that's fantastic. 9.2 can't come soon enough! Thanks for pointing that out.
That is currently available. Has been since 9.0. You should be able to run it from the scripts manager.
astrelsky
on 13 May 2020
So it is, I read the history on the file as coming from March 2020, oops. I will give it a shot and see what happens.
russkel
on 13 May 2020
Adding ticket to add analysis specific decompiler timeout as well as parallelize certain decompiler based analysis.
emteere
on 28 May 2020
Related issues
 forkoz
·
3Comments
forkoz
·
3Comments
 ghost
·
3Comments
ghost
·
3Comments
 loudinthecloud
·
3Comments
loudinthecloud
·
3Comments
 Barakat
·
3Comments
Barakat
·
3Comments
 marcushall42
·
3Comments
marcushall42
·
3Comments
Most helpful comment
Thanks - this seemed to work and good to know.