比如下面的代码,鼠标移动到元素上,期望元素的状态发生变化,并展现keyshape,可以让用户拖拉,就像g6-editor实现的那样,这部分代码没有开源,所以不清楚怎么调用
G6.registerNode('NodeECS', {
    draw(item){
      const group = item.getGraphicGroup();
      group.addShape('text', {
        attrs: {
          x: 30,
          y: 0,
          fill: '#333',
          text: 'ECS'
        }
      });
      group.addShape('image', {
        attrs: {
          x: 0,
          y: 0,
          width: 80,
          height: 80,
          img: require('../assets/ecs.svg')
        }
      });
      return group;
    },
    anchor: [
      [0.5, 1],
      [0,5, 0]
    ],
  });

  graph.on('node:mouseenter', function(ev) {
    graph.update(ev.item, {
      style:{
        fill: 'red',
        stroke: 'blue'
      }
    });
  });
 shengbeiniao
>All comments
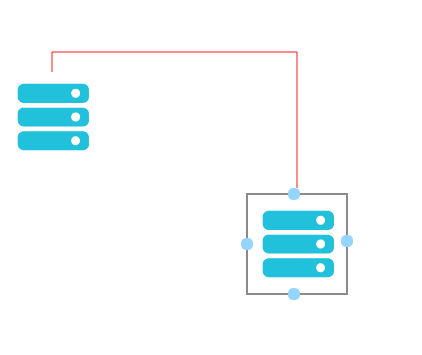
已解决,代码如下
function transform(point){
      return [point.x,point.y]
    }
    G6.registerEdge('customEdge',{
      draw(item){
        console.log(item);
        let source=item.source.getAnchorPoints();
        let target=item.target.getAnchorPoints();
        console.log(source,target);
        const group = item.getGraphicGroup();
        let p1=transform(source[0]);
        let p4=transform(target[0]);
        let p2=[p1[0],p1[1]-20];
        let p3=[p4[0],p2[1]];
        console.log(p1,p2,p3,p4);
        group.addShape('polyline', {
          attrs: {
            points: [p1,p2,p3,p4],
            stroke: 'red'
          }
        });
        return group;
      }
    })

    G6.registerNode('customNode', {
      anchor: {
        type: 'circle',
        points: [
          [0.5, 0],
          [1, 0.5],
          [0.5, 1],
          [0, 0.5]
        ]
      },
      draw(item) {
        let x = 0,
          y = 0,
          width = 100,
          height = 100,
          r = 6;
        const group = item.getGraphicGroup();
        group.addShape('image', {
          attrs: {
            x: x + 5,
            y: x + 5,
            width: width - 10,
            height: width - 10,
            img: './ecs.svg'
          }
        });
        //激活状态
        if (item.model.status === 'active') {
          group.addShape('rect', {
              attrs: {
                x: x,
                y: y,
                width: width,
                height: width,
                stroke: 'black'
              }
            }),
            //上
            group.addShape('circle', {
              attrs: {
                x: (width - r) / 2,
                y: y,
                r: r,
                fill: '#91d5ff'
              }
            });
          //右
          group.addShape('circle', {
            attrs: {
              x: width,
              y: (height - r) / 2,
              r: r,
              fill: '#91d5ff'
            }
          });
          //下
          group.addShape('circle', {
            attrs: {
              x: (width - r) / 2,
              y: height,
              r: r,
              fill: '#91d5ff'
            }
          });
          //左
          group.addShape('circle', {
            attrs: {
              x: x,
              y: (height - y) / 2,
              r: r,
              fill: '#91d5ff'
            }
          });
        }
        return group;
      }
    });

    const graph = new G6.Graph({
      container: 'app',
      fitView: 'cc',
      width: window.innerWidth,
      height: window.innerHeight
    });

    graph.on('node:click', function (target) {
      //点击node,改变model
      graph.update(target.item, {
        status: 'active'
      })
    });

    graph.add('node', {
      id: 'a',
      x: 100,
      y: 100,
      shape: 'customNode'
    });

    graph.add('node', {
      id: 'b',
      x: 300,
      y: 300,
      shape: 'customNode',
      stroke: 'blue'
    });

    graph.add('edge', {
      source: 'a',
      target: 'b',
      size: 3,
      shape:'customEdge'
    });

    //处理拖动
    let node = 0;
    let dx = 0;
    let dy = 0;

    graph.on('node:dragstart', function (ev) {
      let item = ev.item;
      let model = item.getModel();
      node = item;
      dx = model.x - ev.x;
      dy = model.y - ev.y;
    });

    graph.on('node:drag', function (ev) {
      node && graph.update(node, {
        x: ev.x + dx,
        y: ev.y + dy
      });
    });
shengbeiniao
on 22 Jun 2018
🎉4
👍2
Was this page helpful?
0 / 5 - 0 ratings
Related issues
 huyaocode
·
7Comments
huyaocode
·
7Comments
 GPL1
·
3Comments
GPL1
·
3Comments
 franckchen
·
4Comments
franckchen
·
4Comments
 BaconZhang
·
7Comments
BaconZhang
·
7Comments
 zcolin
·
7Comments
zcolin
·
7Comments
Most helpful comment
已解决,代码如下