Frontend: Replace Google Chart to other chart library to support offline use.
Google Chart used by this project will load script from google.com with no offline support. TOS from Google also does not allow offline usage of Chart.
There are some chart library that support offline usage, so I think it should be a good idea to replace the online version with one that supports offline use.
 fanthos
All 17 comments
I agree.
 balloob
on 24 Jul 2017
balloob
on 24 Jul 2017
After some research, I found there are some good charting library.
Plotly.js Powerful charting library based on d3.js.
Chart.js Simple library that supports sereval common used types.
EChart Another powerful chart.
c3.js Another library based on d3.js.
fanthos
on 26 Jul 2017
Here are some requirements for a charting library:
- We should be able to load it async, only load it from the server when we need it
- It should not be too big/CPU intensive. A lot of people use this on their mobile phones
- Should support Gantt charts for the timeline and line charts for sensors.
- Project should be actively maintained
- Should work on mobile phones/touch screens
- License should be Apache/BSD/MIT
balloob
on 26 Jul 2017
I found that d3.js with 3rd party extension can support Gantt charts. I think combine use Plotly.js(or c3.js) and another smaller library for gantt is an option.
fanthos
on 29 Jul 2017
If gathering requirements is open for comment I personally would like to see less randomness in the on / off binary sensor colour coding.
Currently if you open one sensors timeline red could be on and blue could be off, open another and it is the opposite.
 bagobones
on 12 Aug 2017
bagobones
on 12 Aug 2017
Agreed! And on that same note I would love it if the new chart could respect the device_class of binary sensors so they'd show open/closed, detected/clear, moving/stopped, etc...instead of just on/off.
 fanaticDavid
on 13 Aug 2017
fanaticDavid
on 13 Aug 2017
Having more flexible filters on the history page would also be appreciated such as:
- arbitrary start date/time and end date time vs the current fixed days
- filter by name / wild card
- filter by type/class ( quickly see the matching graphs for all motion or temperature sensors for example)
- filter by measurement. (for example view all temperature sensors reporting in a unit or power consumption)
The current history page is very frustrating to use.
bagobones
on 13 Aug 2017
I am trying to replace Google Charts with d3.js.
Trying to use hue color encoding for numerical sensor data, but the history data does not have sensor type information.
I think sensor data types should include binary, numeric, string.
fanthos
on 6 Sep 2017
Current progress:
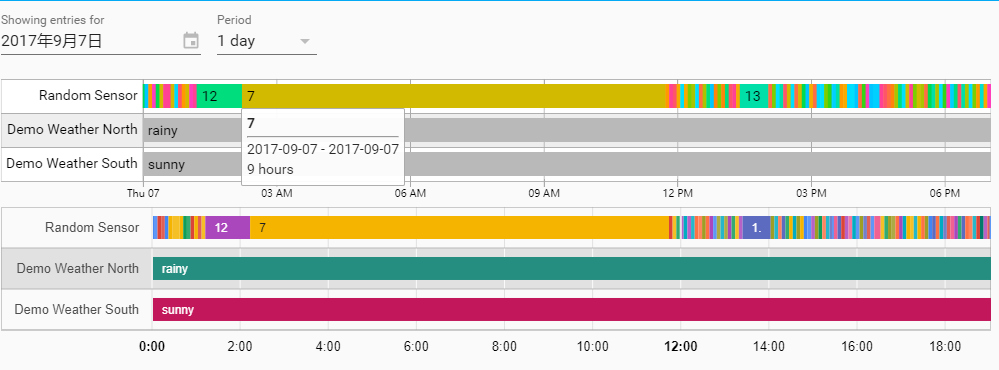
The upper chart is timeline by d3, the other one is Google Charts.
Some features are working in progress.
fanthos
on 7 Sep 2017
That's awesome @fanthos !
balloob
on 9 Sep 2017
Almost done.
I tried to build this on my device, the chart library increased frontend,html about 450kb, and 120kb gzipped.
fanthos
on 9 Sep 2017
It could be loaded on demand
 andrey-git
on 9 Sep 2017
andrey-git
on 9 Sep 2017
Thanks, adding the file to polymer.json works.
Where should I put the chart HTML file?
fanthos
on 9 Sep 2017
450 kB 😨
Is there a way we can cherry-pick the parts of D3 that we need
balloob
on 10 Sep 2017
Tried to use dimple to replace billboard.js, and it cost 200kb with D3.js. I found that dimple is unacceptable slow when loading the chart if the dataset is not small, and has lots of bugs.
D3.js and billboard.js bundled costs 380kb minified, but it performs much better than dimple.
Google Charts using by this project is about 300kb gzipped(900kb minified).
I didn't use node often, so I'm not sure how to pick useful parts from D3 and billboardjs.
fanthos
on 10 Sep 2017
I Opened a PR with current working code
429
fanthos
on 13 Sep 2017
I can help with making the chart code be loaded on demand, just like the Google Chart code. We wouldn't want this to have to be loaded before the initial screen can get shown, that makes our app slow.
balloob
on 14 Sep 2017
Related issues
 aaron9060
·
3Comments
aaron9060
·
3Comments
 TheZoker
·
3Comments
TheZoker
·
3Comments
 SeanPM5
·
3Comments
SeanPM5
·
3Comments
 Fusseldieb
·
4Comments
Fusseldieb
·
4Comments
 casperklein
·
4Comments
casperklein
·
4Comments
Most helpful comment
Current progress:

The upper chart is timeline by d3, the other one is Google Charts.
Some features are working in progress.