Fluentd-kubernetes-daemonset: [in_tail_container_logs] pattern not matched - tried everything, not sure what I am missing
Hi,
I am using https://github.com/fluent/fluentd-kubernetes-daemonset/tree/master/docker-image/v1.9/debian-cloudwatch as reference to install this image as a sidecar in a kubernetes pod.
Added these additional ENVs
ENV FLUENTD_SYSTEMD_CONF disable
ENV FLUENTD_PROMETHEUS_CONF disable
ENV FLUENT_ELASTICSEARCH_SED_DISABLE "true"
along with Log group name and region for AWS Cloudwatch
_fluent.conf_
@include "#{ENV['FLUENTD_SYSTEMD_CONF'] || 'systemd'}.conf"
@include "#{ENV['FLUENTD_PROMETHEUS_CONF'] || 'prometheus'}.conf"
@include kubernetes.conf
@include conf.d/*.conf

<match **>
  @type cloudwatch_logs
  @id out_cloudwatch_logs
  log_group_name "#{ENV['LOG_GROUP_NAME']}"
  auto_create_stream true
  use_tag_as_stream true
  retention_in_days "7"
  json_handler yajl # To avoid UndefinedConversionError
  log_rejected_request "true" # Log rejected request for missing parts
</match>
_kubernetes.conf_
<source>
  @type tail
  @id in_tail_container_logs
  path /root/.pm2/logs/*.log
  pos_file /root/.pm2/sys.log.pos
  tag kubernetes.*
  exclude_path "#{ENV['FLUENT_CONTAINER_TAIL_EXCLUDE_PATH'] || use_default}"
  read_from_head true
  <parse>
    @type json
    time_format %Y-%m-%dT%H:%M:%S.%NZ
  </parse>
</source>
Fluentd is tailing the logs but no matter what config i try -
2020-04-30 13:08:40 +0000 [warn]: #0 [in_tail_container_logs] pattern not matched: "\e[0mGET / \e[32m200 \e[0m45.213 ms - 170\e[0m"
2020-04-30 13:08:41 +0000 [warn]: #0 [in_tail_container_logs] pattern not matched: "{"
2020-04-30 13:08:41 +0000 [warn]: #0 [in_tail_container_logs] pattern not matched: "  \"level\": \"info\","
2020-04-30 13:08:41 +0000 [warn]: #0 [in_tail_container_logs] pattern not matched: "  \"message\": \"hello from slash\","
2020-04-30 13:08:41 +0000 [warn]: #0 [in_tail_container_logs] pattern not matched: "  \"timestamp\": \"2020-04-30T13:08:41.075Z\""
2020-04-30 13:08:41 +0000 [warn]: #0 [in_tail_container_logs] pattern not matched: "}"
2020-04-30 13:08:41 +0000 [warn]: #0 [in_tail_container_logs] pattern not matched: "logloglog"
2020-04-30 13:08:41 +0000 [warn]: #0 [in_tail_container_logs] pattern not matched: "\e[0mGET / \e[32m200 \e[0m10.925 ms - 170\e[0m"
What am I missing? If you look closely it has plain text, it has a JSON i have tried everything.
 kjroger94
All 18 comments
Facing a similar issue.
Anyone has any leads?
 iamparamvs
on 25 Jun 2020
iamparamvs
on 25 Jun 2020
facing same issue but with hosted k8s
 vfolk30
on 4 Aug 2020
vfolk30
on 4 Aug 2020
Looks like your container doesn't write logs in proper JSON format. Each JSON object should be written in one line unless you configure multiline parser plugin.
 jkawamoto
on 5 Aug 2020
jkawamoto
on 5 Aug 2020
same here with a k3s cluster
2020-09-23 07:48:03 +0000 [warn]: #0 [in_tail_container_logs] pattern not matched: "2020-09-23T09:47:45.307936186+02:00 stdout F 2020-09-23 07:47:45 +0000 [warn]: #0 [in_tail_container_logs] pattern not matched: \"2020-09-23T09:47:34.334985467+02:00 stdout F \\\\\\\\\\\\\\\\\\\\\\\\\\\\\\\\\\\\\\\\\\\\\\\\\\\\\\\\\\\\\\\\\\\\\\\\\\\\\\\\\\\\\\\\\\\\\\\\\\\\\\\\\\\\\\\\\\\\\\\\\\\\\\\\\\\\\\\\\\\\\\\\\\\\\\\\\\\\\\\\\\\\\\\\\\\\\\\\\\\\\\\\\\\\\\\\\\\\\\\\\\\\\\\\\\\\\\\\\\\\\\\\\\\\\\\\\\\\\\\\\\\\\\\\\\\\\\\\\\\\\\\\\\\\\\\\\\\\\\\\\\\\\\\\\\\\\\\\\\\\\\\\\\\\\\\\\\\\\\\\\\\\\\\\\\\\\\\\\\\\\\\\\\\\\\\\\\\\\\\\\\\\\\\\\\\\\\\\\\\\\\\\\\\\\\\\\\\\\\\\\\\\\\\\\\\\\\\\\\\\\\\\\\\\\\\\\\\\\\\\\\\\\\\\\\\\\\\\\\\\\\\\\\\\\\\\\\\\\\\\\\\\\\\\\\\\\\\\\\\\\\\\\\\\\\\\\\\\\\\"\""
 dyipon
on 23 Sep 2020
dyipon
on 23 Sep 2020
"exclude_path ["/var/log/containers/fluent*"]"
in kubernetes.conf solved it
dyipon
on 23 Sep 2020
While I did have an issue with fluentd logs perpetually causing the pods themselves to die (from ingesting their own logs) it still doesn't work.
My outputs are single line JSON objects but fluentd still fails to parse them as json.
Source definition
<source>
@type tail
@id in_tail_container_logs
path /var/log/containers/*.log
pos_file /var/log/fluentd-containers.log.pos
tag kubernetes.*
exclude_path "#{ENV['FLUENT_CONTAINER_TAIL_EXCLUDE_PATH'] || use_default}"
read_from_head true
<parse>
@type json
time_format %Y-%m-%dT%H:%M:%S.%NZ
</parse>
</source>
The logs as-is directly from the container

This is how fluentd picks them up.

Is the date prefix injected by something?
Found my way here trying to get fluentd working with elasticsearch and so far not a single log from anything other than the kubelet is able to make it to the elasticsearch cluster.
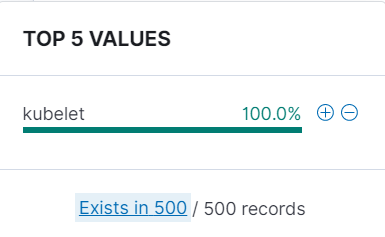
(I suspect from the lack of answer to OP since April is a good sign this also will be ignored)
Edit: It seems to be an issue between the logs being emitted from the container and what is being written to the log file. Something is prefixing all logs with the <timestamp> <stdout/stderr> <?> <message>
 Sieabah
on 17 Dec 2020
Sieabah
on 17 Dec 2020
So the problem comes down to the some kubernetes logging format that is documented poorly in code here
So all of the problems besides OP's multiline issue is down to kubernetes writing logs into the CRI log format and fluentd being incapable of parsing it without using regex. Actually just tested this regex /^(?<time>.+) (?<stream>stdout|stderr)( (?<logtag>.))? (?<message>.*)$/.
I stumbled upon this GCP fluentd configuration for stackdriver which gave this regexp /^(?<time>.+) (?<stream>stdout|stderr) [^ ]* (?<log>.*)$/ if the previous doesn't end up working.
So I have logs being picked up, but they are not parsed the json payload is stored in message from the first regex.
Sieabah
on 17 Dec 2020
@Sieabah This is the CRI parser we ship with Fluent Bit:
# CRI Parser
[PARSER]
# http://rubular.com/r/tjUt3Awgg4
Name cri
Format regex
Regex ^(?<time>[^ ]+) (?<stream>stdout|stderr) (?<logtag>[^ ]*) (?<message>.*)$
Time_Key time
Time_Format %Y-%m-%dT%H:%M:%S.%L%z
I believe the same one as the GCP fluentd configuration for stackdriver. I can potentially update the Fluentd docs as a heads up though from your last message are you still not able to parse them in the intended JSON format?
https://docs.fluentbit.io/manual/installation/kubernetes#container-runtime-interface-cri-parser
 agup006
on 17 Dec 2020
agup006
on 17 Dec 2020
I've struggled a lot to get it to work and I have no idea if it's even the proper way. @agup006
I stumbled upon this semi-working config on a separate issue here.
I'll paste a copy of the working conf here, but for reference this is my post in the other issue about it
<source>
@type tail
@id in_tail_container_logs
path /var/log/containers/*.log
pos_file /var/log/fluentd-containers.log.pos
tag kubernetes.*
exclude_path ["/var/log/containers/fluent*"]
read_from_head true
<parse>
@type regexp
expression /^(?<time>.+) (?<stream>stdout|stderr)( (?<logtag>.))? (?<log>.*)$/
</parse>
</source>
<filter kubernetes.**>
@type kubernetes_metadata
@id filter_kube_metadata
</filter>
<filter kubernetes.var.log.containers.**>
@type parser
<parse>
@type json
json_parser json
</parse>
replace_invalid_sequence true
emit_invalid_record_to_error false
key_name log
reserve_data true
</filter>
We are now working on parser_cri for containerd/cri-o runtime: https://github.com/fluent/fluent-plugin-parser-cri/blob/main/lib/fluent/plugin/parser_cri.rb
We will release this parser soon and k8s-deamonset will support this parser.
 repeatedly
on 18 Dec 2020
repeatedly
on 18 Dec 2020
Hi @dyipon, regarding your comment on https://github.com/fluent/fluentd-kubernetes-daemonset/issues/434#issuecomment-697307365, how do you exactly install/save this configuration on k3s?
I am currently using this instruction https://www.digitalocean.com/community/tutorials/how-to-set-up-an-elasticsearch-fluentd-and-kibana-efk-logging-stack-on-kubernetes but for some reason i have the same behavior as yours. I am also on K3s..
...
\\\\\\\\\\\\\\\\\\\\\\\\\\\\\\\\\\\\\\\\\\\\\\\\\\\\\\\\\\\\\\\\\\\\\\\\\\\\\\\\\\\\\\\\\\\\\\\\\\\\\\\\\\\\\\\\\\\\\\\\\\\\\\\\\\\\\\\\\\\\\\\\\\\\\\\\\\\\\\\\\\\\\\\\\\\\\\\\\\\\\\\\\\\\\\\\\\\\\\\\\\\\\\\\\\\\\\\\\\\\\\\\\\\\\\\\\\\\\\\\\\\\\\\\\\\\\\\\\\\\\\\\\\\\\\\\\\\\\\\\\\\\\\\\\\\\\\\\\\\\\\\\\\\\\\\\\\\\\\\\\\\\\\\\\\\\\\\\\\\\\\\\\\\\\\\\\\\\\\\\\\\\\\\\\\\\\\\\\\\\\\\\\\\\\\\\\\\\\\\\\\\\\\\\\\\\\\\\\\\\\\\\\\\\\\\\\\\\\\\\\\\\\\\\\\\\\\\\\\\\\\\\\\\\\\\\\\\\\\\\\\\\\\\\\\\\\\\\\\\\\\\\\\\\\\\\\\\\\\\\\\\\"
2020-12-31 01:44:44 +0000 [warn]: #0 [in_tail_container_logs] pattern not matched: "2020-12-31T01:44:29.005973968Z stdout F \\\""
2020-12-31 01:44:44 +0000 [warn]: #0 [in_tail_container_logs] pattern not matched: "2020-12-31T01:44:29.007853069Z stdout P 2020-12-31 01:44:29 +0000 [warn]: #0 [in_tail_container_logs] pattern not matched: \"2020-12-31T01:44:20.324108311Z stdout F \\\\\\\\\\\\\\\\\\\\\\\\\\\\\\\\\\\\\\\\\\\\\\\\\\\\\\\\\\\\\\\\\\\\\\\\\\\\\\\\\\\\\\\\\\\\\\\\\\\\\\\\\\\\\\\\\\\\\\\\\\\\\\\\\\\\\\\\\\\\\\\\\\\\\\\\\\\\\\\\\\\\\\\\\\\\\\\\\\\\\\\\\\\\\\\\\^C\\\\\\\\\\\\\\\\\\\\\\\\\\\\\\\\
...
I searched for kubernetes.conf and i see the following files but I'm not sure which one is relevant here.
/var/lib/rancher/k3s/agent/containerd/io.containerd.snapshotter.v1.overlayfs/snapshots/777/fs/fluentd/etc/kubernetes.conf
/var/lib/rancher/k3s/agent/containerd/io.containerd.snapshotter.v1.overlayfs/snapshots/660/fs/fluentd/etc/kubernetes.conf
/var/lib/rancher/k3s/agent/containerd/io.containerd.snapshotter.v1.overlayfs/snapshots/709/fs/fluentd/etc/kubernetes.conf
/run/k3s/containerd/io.containerd.runtime.v2.task/k8s.io/e54a72bed5ca0cc4fbcab1556d01ba31957e27208f1b8d46cee0693d08e0d636/rootfs/fluentd/etc/kubernetes.conf
Update
Okay, after further fumbling around the internets. I seemed to have figured out how to go over this. Still based on the context that I'm following this Guide.
I edited the fluentd.yaml according to this.
# fluentd.yaml
...
containers:
- name: fluentd
  image: fluent/fluentd-kubernetes-daemonset:v1.11.5-debian-elasticsearch7-1.1
  env:
    - name:  FLUENT_ELASTICSEARCH_HOST
      value: "10.0.2.15"
    - name:  FLUENT_ELASTICSEARCH_PORT
      value: "9200"
    - name: FLUENT_ELASTICSEARCH_SCHEME
      value: "http"
    - name: FLUENTD_SYSTEMD_CONF
      value: disable
    - name: FLUENT_CONTAINER_TAIL_EXCLUDE_PATH
      value: /var/log/containers/fluent*
    - name: FLUENT_CONTAINER_TAIL_PARSER_TYPE
      value: /^(?<time>.+) (?<stream>stdout|stderr)( (?<logtag>.))? (?<log>.*)$/
  resources:
    limits:
      memory: 1024Mi
    requests:
      cpu: 100m
      memory: 200Mi
...
FLUENT_CONTAINER_TAIL_EXCLUDE_PATHprevents the circular log.FLUENT_CONTAINER_TAIL_PARSER_TYPEensures it can read the logs.
 bangonkali
on 31 Dec 2020
bangonkali
on 31 Dec 2020
This issue has been automatically marked as stale because it has been open 90 days with no activity. Remove stale label or comment or this issue will be closed in 30 days
![github-actions[bot] picture](https://avatars.githubusercontent.com/in/15368?v=4&s=40) github-actions[bot]
on 31 Mar 2021
github-actions[bot]
on 31 Mar 2021
Hi @dyipon, regarding your comment on #434 (comment), how do you exactly install/save this configuration on k3s?
I am currently using this instruction https://www.digitalocean.com/community/tutorials/how-to-set-up-an-elasticsearch-fluentd-and-kibana-efk-logging-stack-on-kubernetes but for some reason i have the same behavior as yours. I am also on K3s..
...
\\\\\\\\\\\\\\\\\\\\\\\\\\\\\\\\\\\\\\\\\\\\\\\\\\\\\\\\\\\\\\\\\\\\\\\\\\\\\\\\\\\\\\\\\\\\\\\\\\\\\\\\\\\\\\\\\\\\\\\\\\\\\\\\\\\\\\\\\\\\\\\\\\\\\\\\\\\\\\\\\\\\\\\\\\\\\\\\\\\\\\\\\\\\\\\\\\\\\\\\\\\\\\\\\\\\\\\\\\\\\\\\\\\\\\\\\\\\\\\\\\\\\\\\\\\\\\\\\\\\\\\\\\\\\\\\\\\\\\\\\\\\\\\\\\\\\\\\\\\\\\\\\\\\\\\\\\\\\\\\\\\\\\\\\\\\\\\\\\\\\\\\\\\\\\\\\\\\\\\\\\\\\\\\\\\\\\\\\\\\\\\\\\\\\\\\\\\\\\\\\\\\\\\\\\\\\\\\\\\\\\\\\\\\\\\\\\\\\\\\\\\\\\\\\\\\\\\\\\\\\\\\\\\\\\\\\\\\\\\\\\\\\\\\\\\\\\\\\\\\\\\\\\\\\\\\\\\\\\\\\\\\"
2020-12-31 01:44:44 +0000 [warn]: #0 [in_tail_container_logs] pattern not matched: "2020-12-31T01:44:29.005973968Z stdout F \\\""
2020-12-31 01:44:44 +0000 [warn]: #0 [in_tail_container_logs] pattern not matched: "2020-12-31T01:44:29.007853069Z stdout P 2020-12-31 01:44:29 +0000 [warn]: #0 [in_tail_container_logs] pattern not matched: \"2020-12-31T01:44:20.324108311Z stdout F \\\\\\\\\\\\\\\\\\\\\\\\\\\\\\\\\\\\\\\\\\\\\\\\\\\\\\\\\\\\\\\\\\\\\\\\\\\\\\\\\\\\\\\\\\\\\\\\\\\\\\\\\\\\\\\\\\\\\\\\\\\\\\\\\\\\\\\\\\\\\\\\\\\\\\\\\\\\\\\\\\\\\\\\\\\\\\\\\\\\\\\\\\\\\\\\\^C\\\\\\\\\\\\\\\\\\\\\\\\\\\\\\\\
...
I searched for
kubernetes.confand i see the following files but I'm not sure which one is relevant here./var/lib/rancher/k3s/agent/containerd/io.containerd.snapshotter.v1.overlayfs/snapshots/777/fs/fluentd/etc/kubernetes.conf /var/lib/rancher/k3s/agent/containerd/io.containerd.snapshotter.v1.overlayfs/snapshots/660/fs/fluentd/etc/kubernetes.conf /var/lib/rancher/k3s/agent/containerd/io.containerd.snapshotter.v1.overlayfs/snapshots/709/fs/fluentd/etc/kubernetes.conf /run/k3s/containerd/io.containerd.runtime.v2.task/k8s.io/e54a72bed5ca0cc4fbcab1556d01ba31957e27208f1b8d46cee0693d08e0d636/rootfs/fluentd/etc/kubernetes.confUpdate
Okay, after further fumbling around the internets. I seemed to have figured out how to go over this. Still based on the context that I'm following this Guide.
I edited the
fluentd.yamlaccording to this.# fluentd.yaml ... containers: - name: fluentd image: fluent/fluentd-kubernetes-daemonset:v1.11.5-debian-elasticsearch7-1.1 env: - name: FLUENT_ELASTICSEARCH_HOST value: "10.0.2.15" - name: FLUENT_ELASTICSEARCH_PORT value: "9200" - name: FLUENT_ELASTICSEARCH_SCHEME value: "http" - name: FLUENTD_SYSTEMD_CONF value: disable - name: FLUENT_CONTAINER_TAIL_EXCLUDE_PATH value: /var/log/containers/fluent* - name: FLUENT_CONTAINER_TAIL_PARSER_TYPE value: /^(?<time>.+) (?<stream>stdout|stderr)( (?<logtag>.))? (?<log>.*)$/ resources: limits: memory: 1024Mi requests: cpu: 100m memory: 200Mi ...
FLUENT_CONTAINER_TAIL_EXCLUDE_PATHprevents the circular log.FLUENT_CONTAINER_TAIL_PARSER_TYPEensures it can read the logs.
Followed the same guide and used the same config as in your comment. Still can't get logs into Elasticsearch. Acutally there are logs in Elasticsearch, all of them are Prometheus out of bound error log as the following:
kubernetes.container_name:prometheus stream:stderr logtag:F log:level=warn ts=2021-04-20T18:08:45.206Z caller=scrape.go:1378 component="scrape manager" scrape_pool=monitoring/kubelet/2 target=https://172.19.0.3:10250/metrics/probes msg="Error on ingesting samples that are too old or are too far into the future" num_dropped=4 docker.container_id:a92878f44a11e94f3081aa100c6defc3bf69711daffa9804597b8893844cd556 kubernetes.namespace_name:monitoring kubernetes.pod_name:prometheus-k8s-1 kubernetes.container_image:quay.io/prometheus/prometheus:v2.24.0 kubernetes.container_image_id:quay.io/prometheus/prometheus@sha256:943c7c57115a449353e0158dcba4eaab2e56de07b7d552b5145cb6c0d1cbab19
 RainFlying
on 20 Apr 2021
RainFlying
on 20 Apr 2021
@RainFlying maybe it's timezone issue. If I remember well, i just had to sync the timezones between fluentd and ES.
dyipon
on 21 Apr 2021
We are now working on parser_cri for containerd/cri-o runtime: https://github.com/fluent/fluent-plugin-parser-cri/blob/main/lib/fluent/plugin/parser_cri.rb
We will release this parser soon and k8s-deamonset will support this parser.
Did this parser get included in any of the releases since then?
I am running "imageID": "docker.io/fluent/fluentd-kubernetes-daemonset@sha256:7fe512f670eda2df363c44b6c8b4a505ca35f238032a6ddf75c98b33e56b8088" which was published 1 day ago but still encountering this issue. We seem to have a corresponding increase in cluster CPU usage as well.
 sysadmiral
on 29 Apr 2021
sysadmiral
on 29 Apr 2021
We are now working on parser_cri for containerd/cri-o runtime: https://github.com/fluent/fluent-plugin-parser-cri/blob/main/lib/fluent/plugin/parser_cri.rb
We will release this parser soon and k8s-deamonset will support this parser.Did this parser get included in any of the releases since then?
I am running
"imageID": "docker.io/fluent/fluentd-kubernetes-daemonset@sha256:7fe512f670eda2df363c44b6c8b4a505ca35f238032a6ddf75c98b33e56b8088"which was published 1 day ago but still encountering this issue. We seem to have a corresponding increase in cluster CPU usage as well.
I can confirm the parser is in recent versions of the image but you have to override the tail_container_parse.conf with the following (using a configmap and volumemount):
<parse>
  @type cri
</parse>
Solution is found here: https://github.com/fluent/fluentd-kubernetes-daemonset/issues/434#issuecomment-831801690
Closing.
 cosmo0920
on 12 May 2021
cosmo0920
on 12 May 2021
We are now working on parser_cri for containerd/cri-o runtime: https://github.com/fluent/fluent-plugin-parser-cri/blob/main/lib/fluent/plugin/parser_cri.rb
We will release this parser soon and k8s-deamonset will support this parser.Did this parser get included in any of the releases since then?
I am running"imageID": "docker.io/fluent/fluentd-kubernetes-daemonset@sha256:7fe512f670eda2df363c44b6c8b4a505ca35f238032a6ddf75c98b33e56b8088"which was published 1 day ago but still encountering this issue. We seem to have a corresponding increase in cluster CPU usage as well.I can confirm the parser is in recent versions of the image but you have to override the
tail_container_parse.confwith the following (using a configmap and volumemount):<parse> @type cri </parse>
In v1.12 this works -
(the earlier setting https://github.com/fluent/fluentd-kubernetes-daemonset/issues/434#issuecomment-752813739 is not longer present from v1.12 )
In case someone wants the files for EFK for testing - https://medium.com/techlogs/a-working-efk-configuration-for-gcp-kubernetes-aa727bc173da
 alexcpn
on 25 Jun 2021
alexcpn
on 25 Jun 2021
Related issues
 fadingdust
·
9Comments
fadingdust
·
9Comments
 pckhoi
·
4Comments
pckhoi
·
4Comments
 billinghamj
·
4Comments
billinghamj
·
4Comments
 artempronevskiy
·
10Comments
artempronevskiy
·
10Comments
 sdanieru
·
4Comments
sdanieru
·
4Comments
Most helpful comment
Hi @dyipon, regarding your comment on https://github.com/fluent/fluentd-kubernetes-daemonset/issues/434#issuecomment-697307365, how do you exactly install/save this configuration on k3s?
I am currently using this instruction https://www.digitalocean.com/community/tutorials/how-to-set-up-an-elasticsearch-fluentd-and-kibana-efk-logging-stack-on-kubernetes but for some reason i have the same behavior as yours. I am also on K3s..
I searched for
kubernetes.confand i see the following files but I'm not sure which one is relevant here.Update
Okay, after further fumbling around the internets. I seemed to have figured out how to go over this. Still based on the context that I'm following this Guide.
I edited the
fluentd.yamlaccording to this.FLUENT_CONTAINER_TAIL_EXCLUDE_PATHprevents the circular log.FLUENT_CONTAINER_TAIL_PARSER_TYPEensures it can read the logs.