Fl_chart: Inconsistency Interval consuming all memory
I was struggling to figure out why rendering a chart was making my emulator (and notebook) so slow.
Just figured out the problem, when you set an inconsistent interval in a Line chart, it probably gets in an infinite loop or something like that and freeze everything.
Example:
My dataset was composed by an x-axis with timestamps in milliseconds (with one year duration interval). To this line I was trying to set an interval of 4 or 5 (interval: 4), after sometime I figured out that it doesn't make any sense with the type of data that I was manipulating, but until there I lost too much time trying to debug it.
 caioflores
All 6 comments
Hi,
thanks for letting us know,
as you know we have to find an interval to loop through for showing side titles and grid lines,
If you don't provide any interval we calculate a good number as an interval (I mean just left interval properties null),
but If you provide a number, you are responsible to choose a good number to prevent wasting resources.
If you have any better idea, I appreciate it, and please let me know.
Thanks!
 imaNNeoFighT
on 27 Jun 2020
imaNNeoFighT
on 27 Jun 2020
Maybe we can return a warning message to the user when he is doing something crazy like I was doing? Just an idea.
caioflores
on 27 Jun 2020
Good idea!
maybe we should throw an exception because lot's of people facing this issue.
BTW thank you, we will consider it in the new version.
Cheers!
imaNNeoFighT
on 27 Jun 2020
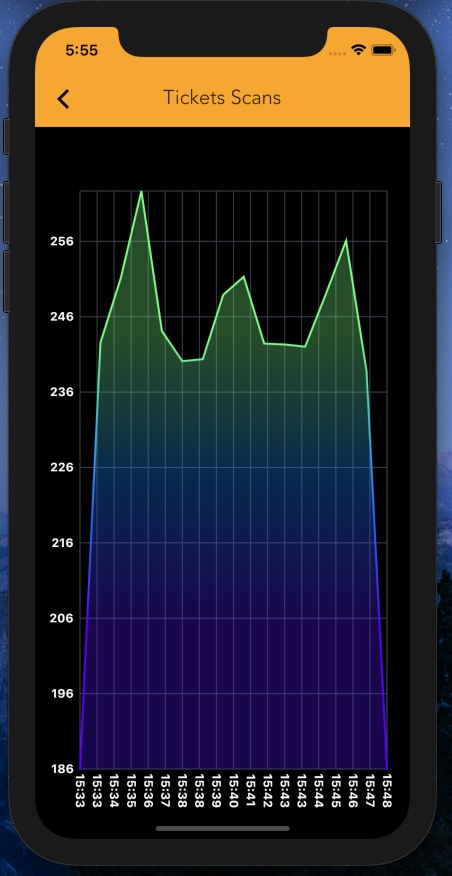
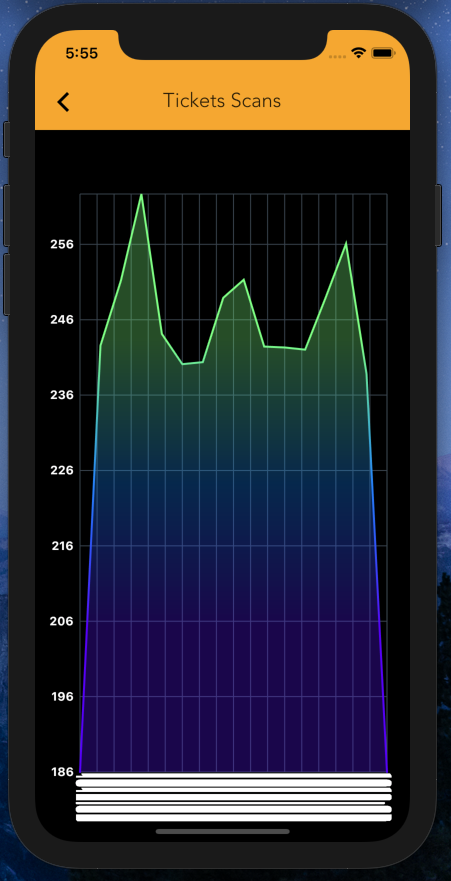
I seem to be running into a very similar issue.
Any kind of interval I set for bottomTitles will result in memory going crazy. Then when things finally render they look kind of crazy.
The y axis interval appears to work as expected however.
So what is a "good" value then? How can I calculate that?
class _testLineChartState extends State<testLineChart> {
  final List<Color> _gradientColors = [
    const Color(0xFF6FFF7C),
    const Color(0xFF0087FF),
    const Color(0xFF5620FF),
  ];

  @override
  Widget build(BuildContext context) {
    return SizedBox(
      width: double.maxFinite,
      height: double.maxFinite,
      child: Container(
        child: Padding(
          padding: const EdgeInsets.only(
              right: 18.0, left: 12.0, top: 24, bottom: 12),
          child: LineChart(
            mainData(),
          ),
        ),
      ),
    );
  }

  LineChartData mainData() {
    return LineChartData(
        gridData: FlGridData(
          horizontalInterval: 10.0,
          show: true,
          drawVerticalLine: true,
        ),
        titlesData: FlTitlesData(
          show: true,
          bottomTitles: SideTitles(
            showTitles: true,
            rotateAngle: 90,
            getTextStyles: (value) => const TextStyle(
                color: Colors.white, fontWeight: FontWeight.bold, fontSize: 12),
            getTitles: (value) {
              final DateTime date =
                  DateTime.fromMillisecondsSinceEpoch(value.toInt());
              return DateFormat.Hm().format(date);
            },
          ),
          leftTitles: SideTitles(
              showTitles: true,
              getTextStyles: (value) => const TextStyle(
                    color: Colors.white,
                    fontWeight: FontWeight.bold,
                    fontSize: 12,
                  ),
              getTitles: (value) => value.round().toString(),
              interval: 10),
        ),
        borderData: FlBorderData(
            show: true,
            border: Border.all(color: const Color(0xff37434d), width: 1)),
        lineBarsData: _lineBarData());
  }

  List<LineChartBarData> _lineBarData() {
    LineChartBarData barData;
    List<LineChartBarData> dataList = List<LineChartBarData>();
    widget.graphData.forEach((item) {
      barData = new LineChartBarData(
        spots: item,
        colors: _gradientColors,
        colorStops: const [0.25, 0.5, 0.75],
        gradientFrom: const Offset(0.5, 0),
        gradientTo: const Offset(0.5, 1),
        barWidth: 2,
        isStrokeCapRound: true,
        dotData: FlDotData(show: false),
        belowBarData: BarAreaData(
          show: true,
          colors:
              _gradientColors.map((color) => color.withOpacity(0.3)).toList(),
          gradientColorStops: const [0.25, 0.5, 0.75],
          gradientFrom: const Offset(0.5, 0),
          gradientTo: const Offset(0.5, 1),
        ),
      );
      dataList.add(barData);
    });
    return dataList;
  }
}
 xxwassyxx
on 8 Feb 2021
xxwassyxx
on 8 Feb 2021
So with regards to mine, I actually managed to figure out my issue. Looks like I needed to provide my own math to calculate min/max of x and y, then create intervals and now things are looking much better.
xxwassyxx
on 8 Feb 2021
Check it out in the source code [here](double getEfficientInterval(double axisViewSize, double diffInYAxis,).
imaNNeoFighT
on 20 Mar 2021
Related issues
 mukhammad-akilov
·
4Comments
mukhammad-akilov
·
4Comments
 davidmarinangeli
·
6Comments
davidmarinangeli
·
6Comments
 kw2019ltd
·
6Comments
kw2019ltd
·
6Comments
 xSILENCEx
·
4Comments
xSILENCEx
·
4Comments
 S1nPur1ty
·
4Comments
S1nPur1ty
·
4Comments
Most helpful comment
Good idea!
maybe we should throw an exception because lot's of people facing this issue.
BTW thank you, we will consider it in the new version.
Cheers!