Etcd: Etcd performance is not good enough.
Hi,
We are running a large cluster with 3 masters and 5000 nodes, and 3 instances etcd cluster running on dedicated servers. Currently, there are more than 55000 pods running in the cluster.
We find that the performance of etcd is not very well, I will describe below.
- The P99 etcd_backend_commit_latency is above 100ms, which is hard to achieve 25ms described in this doc faq.
- While doing operations, such as changing the leader of controller-manager or rolling several deployments at the same time, there will be lost of
read-only range request took too longandrequest <header:xxx> ... took too longwarnings, and the etcd_backend_commit_latency will increase extremely.
To make sure it's not disk, I moved the data-dir to ramdisk, but no improvement.
etcd is running on:
CPU: 32 core
Memory: 128GB
DISK: ssd
version:
k8s: v1.13.4
etcd: both 3.2.24 & 3.3.11
Does someone have an idea why there are no good enough performance, or how to debug this further?
 ghost
ghost
All 10 comments
@sevensees can we see/metrics[1] for each member? 5000 nodes is a very large cluster. How large is your DB? Do you actively defragment? You will notice that in our hardware guidelines [2] XL cluster is defined as 3000 nodes. At 5000 nodes this is the maximum supported by Kubernetes [3]. Do your disks matchup with what is recommended with regards to Max concurrent IOPS? Also as recommended in the docs you should consider a second etcd cluster to store events. Events alone in this size of the cluster can be a huge amount of writes from all the nodes. Because these same keys are written over and over compaction will not be enough as the whitespace will need to be reclaimed by defragmentation. If you do this it will give your disks a bit more breathing room.
--etcd-servers-overrides="/events#http://newcluster-member.mydomain.local:2380 [5]
[1] https://github.com/etcd-io/etcd/blob/master/Documentation/op-guide/monitoring.md#metrics-endpoint
[2] https://github.com/etcd-io/etcd/blob/master/Documentation/op-guide/hardware.md#example-hardware-configurations
[3] https://kubernetes.io/docs/setup/cluster-large/
[4] https://kubernetes.io/docs/setup/cluster-large/
[5] https://github.com/kubernetes/kubernetes/blob/ec64aef25f2fc8c7f3093d16566e6d2e40b61e4e/staging/src/k8s.io/apiserver/pkg/server/options/etcd.go#L116
 hexfusion
on 10 May 2019
hexfusion
on 10 May 2019
etcd: both 3.2.24 & 3.3.11
What do you mean here? You have a mixed cluster?
etcdctl --endpoints $endpoints endpoint status -w table
hexfusion
on 10 May 2019
@hexfusion Thank you for your reply.:)
etcd: both 3.2.24 & 3.3.11, What do you mean here? You have a mixed cluster?
Which means I tried on both these two version, no mixed version cluster.
How large is your DB? Do you actively defragment?
My DB size is 3.7 GB and I does not do actively defragment, and compaction depends on apiserver.
I did some modifications against my cluster before posting this issue.
- Apply secondary etcd cluster to store events.
- Move etcd cluster (3 instances) to a realy fast SSD (3TB), the fio output wille be attached below.
- Set
--node-status-update-frequencyto20srather than default value.
But the overall performance did't looks good.
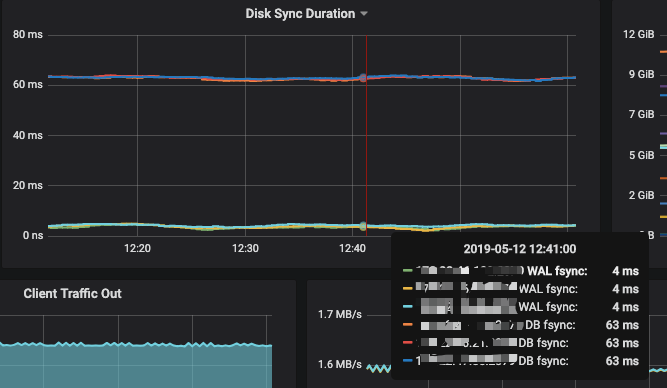
- DB sync P99 latency decreases to 60ms+, but wal sync latency increases to 3ms+ from 1ms. 60ms is not as good as the value mentioned in faq.
- There is lots of
took too longwarnings while doing rolling updates against 10 deployments (5 deployments with 1000 replicas and 5 deployments with 75 replicas, Max unavailable 25%), and thekube-api-qps=100andkube-api-burst=100on controller-manager.
ref:
P99:
FIO:
seq-read: (g=0): rw=read, bs=(R) 4096B-4096B, (W) 4096B-4096B, (T) 4096B-4096B, ioengine=libaio, iodepth=32
rand-read: (g=1): rw=randread, bs=(R) 4096B-4096B, (W) 4096B-4096B, (T) 4096B-4096B, ioengine=libaio, iodepth=32
seq-write: (g=2): rw=write, bs=(R) 4096B-4096B, (W) 4096B-4096B, (T) 4096B-4096B, ioengine=libaio, iodepth=32
rand-write: (g=3): rw=randwrite, bs=(R) 4096B-4096B, (W) 4096B-4096B, (T) 4096B-4096B, ioengine=libaio, iodepth=32
fio-3.1
Starting 4 processes
Jobs: 1 (f=1): [_(3),w(1)][100.0%][r=0KiB/s,w=471MiB/s][r=0,w=121k IOPS][eta 00m:00s]
seq-read: (groupid=0, jobs=1): err= 0: pid=52567: Sun May 12 16:15:16 2019
   read: IOPS=126k, BW=492MiB/s (516MB/s)(10.0GiB/20807msec)
    slat (nsec): min=2424, max=79775, avg=3395.14, stdev=1874.71
    clat (usec): min=11, max=6116, avg=247.68, stdev=213.09
     lat (usec): min=14, max=6122, avg=251.69, stdev=213.10
    clat percentiles (usec):
     |  1.00th=[  117],  5.00th=[  149], 10.00th=[  163], 20.00th=[  180],
     | 30.00th=[  194], 40.00th=[  206], 50.00th=[  221], 60.00th=[  239],
     | 70.00th=[  258], 80.00th=[  277], 90.00th=[  322], 95.00th=[  375],
     | 99.00th=[  578], 99.50th=[ 1434], 99.90th=[ 3818], 99.95th=[ 4424],
     | 99.99th=[ 4948]
   bw (  KiB/s): min=360538, max=519899, per=78.82%, avg=397216.34, stdev=23271.61, samples=41
   iops        : min=90134, max=129974, avg=99303.78, stdev=5817.93, samples=41
  lat (usec)   : 20=0.01%, 50=0.01%, 100=0.18%, 250=65.97%, 500=32.41%
  lat (usec)   : 750=0.70%, 1000=0.12%
  lat (msec)   : 2=0.26%, 4=0.27%, 10=0.08%
  cpu          : usr=24.91%, sys=71.55%, ctx=20208, majf=0, minf=41
  IO depths    : 1=0.1%, 2=0.1%, 4=0.1%, 8=0.1%, 16=0.1%, 32=100.0%, >=64=0.0%
     submit    : 0=0.0%, 4=100.0%, 8=0.0%, 16=0.0%, 32=0.0%, 64=0.0%, >=64=0.0%
     complete  : 0=0.0%, 4=100.0%, 8=0.0%, 16=0.0%, 32=0.1%, 64=0.0%, >=64=0.0%
     issued rwt: total=2621440,0,0, short=0,0,0, dropped=0,0,0
     latency   : target=0, window=0, percentile=100.00%, depth=32
rand-read: (groupid=1, jobs=1): err= 0: pid=52708: Sun May 12 16:15:16 2019
   read: IOPS=125k, BW=490MiB/s (514MB/s)(10.0GiB/20890msec)
    slat (nsec): min=2462, max=71800, avg=3325.33, stdev=1820.14
    clat (usec): min=34, max=7259, avg=248.58, stdev=201.49
     lat (usec): min=37, max=7266, avg=252.54, stdev=201.48
    clat percentiles (usec):
     |  1.00th=[  108],  5.00th=[  163], 10.00th=[  188], 20.00th=[  206],
     | 30.00th=[  217], 40.00th=[  225], 50.00th=[  231], 60.00th=[  241],
     | 70.00th=[  253], 80.00th=[  265], 90.00th=[  281], 95.00th=[  310],
     | 99.00th=[  523], 99.50th=[ 1434], 99.90th=[ 3654], 99.95th=[ 4359],
     | 99.99th=[ 5014]
   bw (  KiB/s): min=436137, max=504712, per=95.85%, avg=481108.17, stdev=13736.86, samples=41
   iops        : min=109034, max=126178, avg=120276.63, stdev=3434.14, samples=41
  lat (usec)   : 50=0.01%, 100=0.80%, 250=67.57%, 500=30.57%, 750=0.31%
  lat (usec)   : 1000=0.11%
  lat (msec)   : 2=0.30%, 4=0.27%, 10=0.07%
  cpu          : usr=26.95%, sys=70.72%, ctx=8008, majf=0, minf=39
  IO depths    : 1=0.1%, 2=0.1%, 4=0.1%, 8=0.1%, 16=0.1%, 32=100.0%, >=64=0.0%
     submit    : 0=0.0%, 4=100.0%, 8=0.0%, 16=0.0%, 32=0.0%, 64=0.0%, >=64=0.0%
     complete  : 0=0.0%, 4=100.0%, 8=0.0%, 16=0.0%, 32=0.1%, 64=0.0%, >=64=0.0%
     issued rwt: total=2621440,0,0, short=0,0,0, dropped=0,0,0
     latency   : target=0, window=0, percentile=100.00%, depth=32
seq-write: (groupid=2, jobs=1): err= 0: pid=52916: Sun May 12 16:15:16 2019
  write: IOPS=124k, BW=485MiB/s (509MB/s)(10.0GiB/21098msec)
    slat (usec): min=2, max=178, avg= 4.10, stdev= 1.75
    clat (usec): min=11, max=4894, avg=251.05, stdev=96.12
     lat (usec): min=14, max=4897, avg=255.83, stdev=96.13
    clat percentiles (usec):
     |  1.00th=[  231],  5.00th=[  233], 10.00th=[  235], 20.00th=[  235],
     | 30.00th=[  237], 40.00th=[  241], 50.00th=[  245], 60.00th=[  247],
     | 70.00th=[  251], 80.00th=[  255], 90.00th=[  265], 95.00th=[  277],
     | 99.00th=[  334], 99.50th=[  359], 99.90th=[ 1418], 99.95th=[ 2573],
     | 99.99th=[ 4490]
   bw (  KiB/s): min=362461, max=488140, per=76.91%, avg=382268.46, stdev=17779.53, samples=41
   iops        : min=90615, max=122035, avg=95566.83, stdev=4444.90, samples=41
  lat (usec)   : 20=0.01%, 50=0.01%, 100=0.01%, 250=67.95%, 500=31.80%
  lat (usec)   : 750=0.08%, 1000=0.01%
  lat (msec)   : 2=0.07%, 4=0.04%, 10=0.03%
  cpu          : usr=22.54%, sys=71.99%, ctx=82973, majf=0, minf=7
  IO depths    : 1=0.1%, 2=0.1%, 4=0.1%, 8=0.1%, 16=0.1%, 32=100.0%, >=64=0.0%
     submit    : 0=0.0%, 4=100.0%, 8=0.0%, 16=0.0%, 32=0.0%, 64=0.0%, >=64=0.0%
     complete  : 0=0.0%, 4=100.0%, 8=0.0%, 16=0.0%, 32=0.1%, 64=0.0%, >=64=0.0%
     issued rwt: total=0,2621440,0, short=0,0,0, dropped=0,0,0
     latency   : target=0, window=0, percentile=100.00%, depth=32
rand-write: (groupid=3, jobs=1): err= 0: pid=52973: Sun May 12 16:15:16 2019
  write: IOPS=120k, BW=470MiB/s (492MB/s)(10.0GiB/21807msec)
    slat (usec): min=2, max=358, avg= 4.21, stdev= 1.78
    clat (usec): min=10, max=5293, avg=259.44, stdev=107.18
     lat (usec): min=14, max=5298, avg=264.28, stdev=107.22
    clat percentiles (usec):
     |  1.00th=[  237],  5.00th=[  241], 10.00th=[  241], 20.00th=[  243],
     | 30.00th=[  245], 40.00th=[  249], 50.00th=[  253], 60.00th=[  255],
     | 70.00th=[  260], 80.00th=[  265], 90.00th=[  273], 95.00th=[  285],
     | 99.00th=[  351], 99.50th=[  375], 99.90th=[ 1467], 99.95th=[ 3654],
     | 99.99th=[ 4817]
   bw (  KiB/s): min=453432, max=495176, per=100.00%, avg=480967.63, stdev=8764.29, samples=43
   iops        : min=113358, max=123794, avg=120241.86, stdev=2191.00, samples=43
  lat (usec)   : 20=0.01%, 50=0.02%, 100=0.03%, 250=43.67%, 500=56.08%
  lat (usec)   : 750=0.03%, 1000=0.02%
  lat (msec)   : 2=0.07%, 4=0.02%, 10=0.04%
  cpu          : usr=24.38%, sys=70.15%, ctx=83689, majf=0, minf=9
  IO depths    : 1=0.1%, 2=0.1%, 4=0.1%, 8=0.1%, 16=0.1%, 32=100.0%, >=64=0.0%
     submit    : 0=0.0%, 4=100.0%, 8=0.0%, 16=0.0%, 32=0.0%, 64=0.0%, >=64=0.0%
     complete  : 0=0.0%, 4=100.0%, 8=0.0%, 16=0.0%, 32=0.1%, 64=0.0%, >=64=0.0%
     issued rwt: total=0,2621440,0, short=0,0,0, dropped=0,0,0
     latency   : target=0, window=0, percentile=100.00%, depth=32

Run status group 0 (all jobs):
   READ: bw=492MiB/s (516MB/s), 492MiB/s-492MiB/s (516MB/s-516MB/s), io=10.0GiB (10.7GB), run=20807-20807msec

Run status group 1 (all jobs):
   READ: bw=490MiB/s (514MB/s), 490MiB/s-490MiB/s (514MB/s-514MB/s), io=10.0GiB (10.7GB), run=20890-20890msec

Run status group 2 (all jobs):
  WRITE: bw=485MiB/s (509MB/s), 485MiB/s-485MiB/s (509MB/s-509MB/s), io=10.0GiB (10.7GB), run=21098-21098msec

Run status group 3 (all jobs):
  WRITE: bw=470MiB/s (492MB/s), 470MiB/s-470MiB/s (492MB/s-492MB/s), io=10.0GiB (10.7GB), run=21807-21807msec

Disk stats (read/write):
  nvme2n1: ios=5242880/5274314, merge=0/9, ticks=62982/14785, in_queue=812360, util=90.93%
@sevensees could you please also provide mount options?
 nvtkaszpir
on 20 May 2019
nvtkaszpir
on 20 May 2019
Could you open an issue in kubernetes/kubernestes and tag sig-scalability.
 jingyih
on 20 May 2019
jingyih
on 20 May 2019
@nvtkaszpir Thanks a lot:), and is this what you want?
/dev/xxxxxx /xxxx xfs rw,noatime,attr2,inode64,noquota 0 0
I have to obscure the device name and mount point for the secure concerns.
ghost
on 21 May 2019
@jingyih Sure, I will.
ghost
on 21 May 2019
@sevensees any tunings in /sys/block/* ?
nvtkaszpir
on 21 May 2019
@sevensees any tunings in /sys/block/* ?
@nvtkaszpir Not yet. Could you please give some suggestions?
ghost
on 22 May 2019
FYI:
https://www.cncf.io/blog/2019/05/09/performance-optimization-of-etcd-in-web-scale-data-scenario/
 warmchang
on 22 Jun 2019
warmchang
on 22 Jun 2019
Related issues
 hnlq715
·
3Comments
hnlq715
·
3Comments
 zhousoft
·
3Comments
zhousoft
·
3Comments
 suresh-chaudhari
·
3Comments
suresh-chaudhari
·
3Comments
 r007m4n
·
3Comments
r007m4n
·
3Comments
 WanLinghao
·
4Comments
WanLinghao
·
4Comments
Most helpful comment
FYI:
https://www.cncf.io/blog/2019/05/09/performance-optimization-of-etcd-in-web-scale-data-scenario/