etcd_memory_leak.heap.pprof.zip
etcd Version: 3.3.10
Git SHA: 27fc7e2
Go Version: go1.10.4
Go OS/Arch: linux/amd64
top command:
PID USER PR NI VIRT RES SHR S %CPU %MEM TIME+ COMMAND
11613 root 20 0 82.6g 79g 2.5g S 1042 63.4 813:34.28 etcd
endpoints status:
bad_endpoint, 61c7bf58354fae8c, 3.3.10, 2.7 GB, false, 32322, 433403373
good_endpoint, 97eee7aa8c3d026, 3.3.10, 2.7 GB, true, 32322, 433403373
good_endpoint, 7696d1683db35eb5, 3.3.9, 2.7 GB, false, 32322, 433403373
 zeast
zeast
All 11 comments
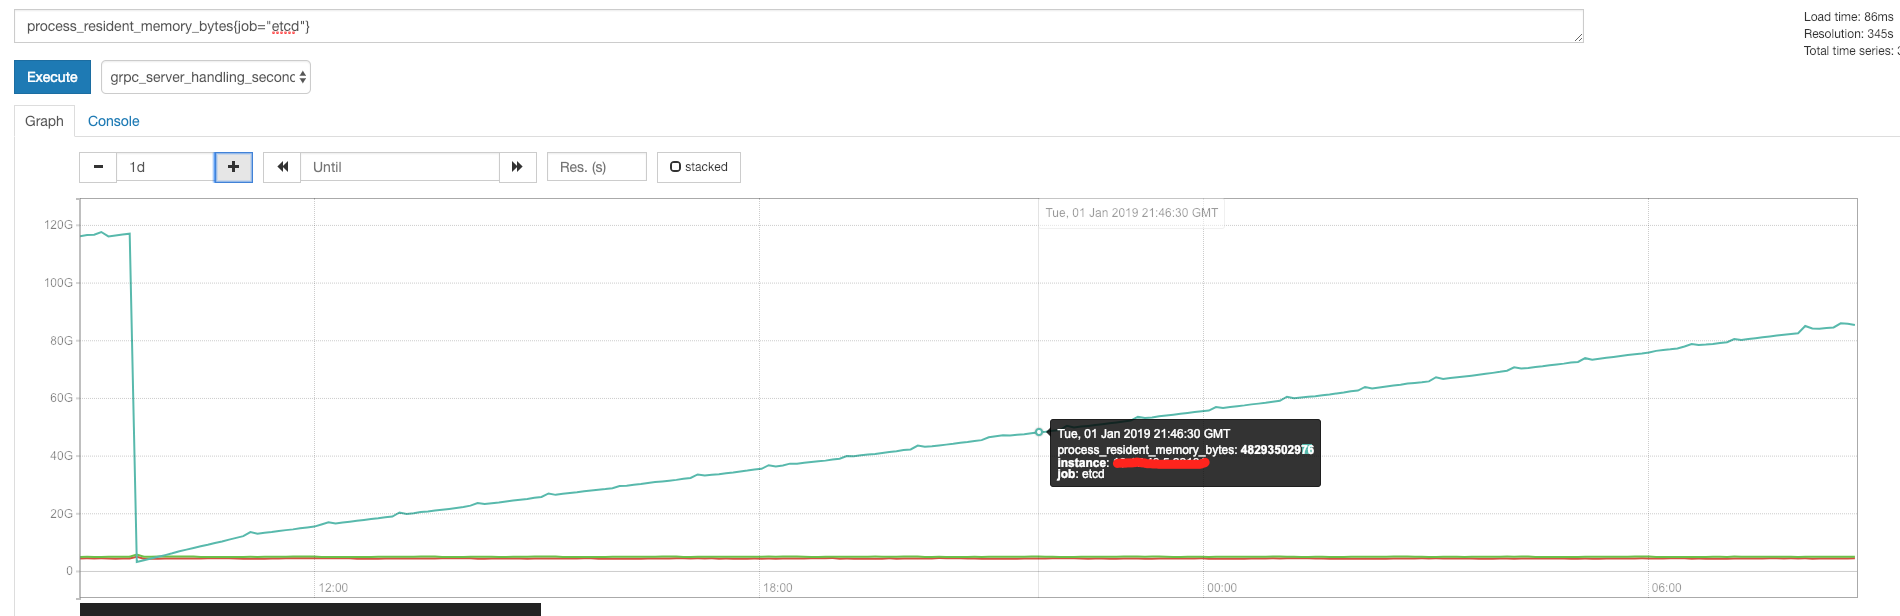
@zeast is this a leak or is the increase in RAM consumption based on the the size of the DB? What causes this drop in RAM at the start of the graph, compaction? Since you have Prometheus running what does etcd_debugging_mvcc_db_total_size_in_bytes look like during this time series?
 hexfusion
on 8 Jan 2019
hexfusion
on 8 Jan 2019
Hi @zeast any update?
hexfusion
on 9 Jan 2019
yeah, I found a way to reproduce. Yesterday and the day before, I adjusted the request to circumvent this problem, so I didn't notice here, sorry.
If you use http request /v3beta/kv/range and want more than 1014 * 1024 * 4 data , you will get error message {"error":"grpc: received message larger than max (6927780 vs. 4194304)","code":8} then memory will increase. I try version 3.3.10 and master branch.
@hexfusion
zeast
on 11 Jan 2019
bug found: https://github.com/grpc/grpc-go/issues/2444
zeast
on 17 Jan 2019
@zeast great work we will track the issue, thank you!
hexfusion
on 17 Jan 2019
updated title so its easier to see the core problem.
hexfusion
on 17 Jan 2019
@hexfusion @gyuho @xiang90
This bug was fixed at Fixes established streams leak in the loopy writer yesterday.
 cfc4n
on 13 Feb 2019
cfc4n
on 13 Feb 2019
/cc @jpbetz
 jingyih
on 25 Feb 2019
jingyih
on 25 Feb 2019
/cc @hexfusion
cfc4n
on 2 Jul 2019
This issue has been automatically marked as stale because it has not had recent activity. It will be closed after 21 days if no further activity occurs. Thank you for your contributions.
![stale[bot] picture](https://avatars3.githubusercontent.com/in/1724?v=4&s=40) stale[bot]
on 7 Apr 2020
stale[bot]
on 7 Apr 2020
We bumped the gRPC version. So the fix should already be included.
 xiang90
on 7 Apr 2020
xiang90
on 7 Apr 2020
Related issues
 atinsood
·
4Comments
atinsood
·
4Comments
 itnikita
·
3Comments
itnikita
·
3Comments
 ramanala
·
4Comments
ramanala
·
4Comments
 govine
·
3Comments
govine
·
3Comments
 invidian
·
3Comments
invidian
·
3Comments
Most helpful comment
@hexfusion @gyuho @xiang90
This bug was fixed at Fixes established streams leak in the loopy writer yesterday.