Electricitymap-contrib: UK wind and generation output currently diverging massively from other monitor websites
Right now (13.58 26th January) https://www.mygridgb.co.uk/ shows wind at 12.5 GW and generation at 38GW . ElectricityMap showing wind at 2.36 GW and generation at 28.5GW. https://www.gridwatch.templar.co.uk/ showing wind at 10GW and Generation at 35.31GW
I understand that each website has a slightly different way of monitoring but something is very wrong here.
 nickflynn
All 15 comments
Indeed that is problematic. We get the data from BMReports. Do you know any alternative or better data source?
 corradio
on 26 Jan 2019
corradio
on 26 Jan 2019
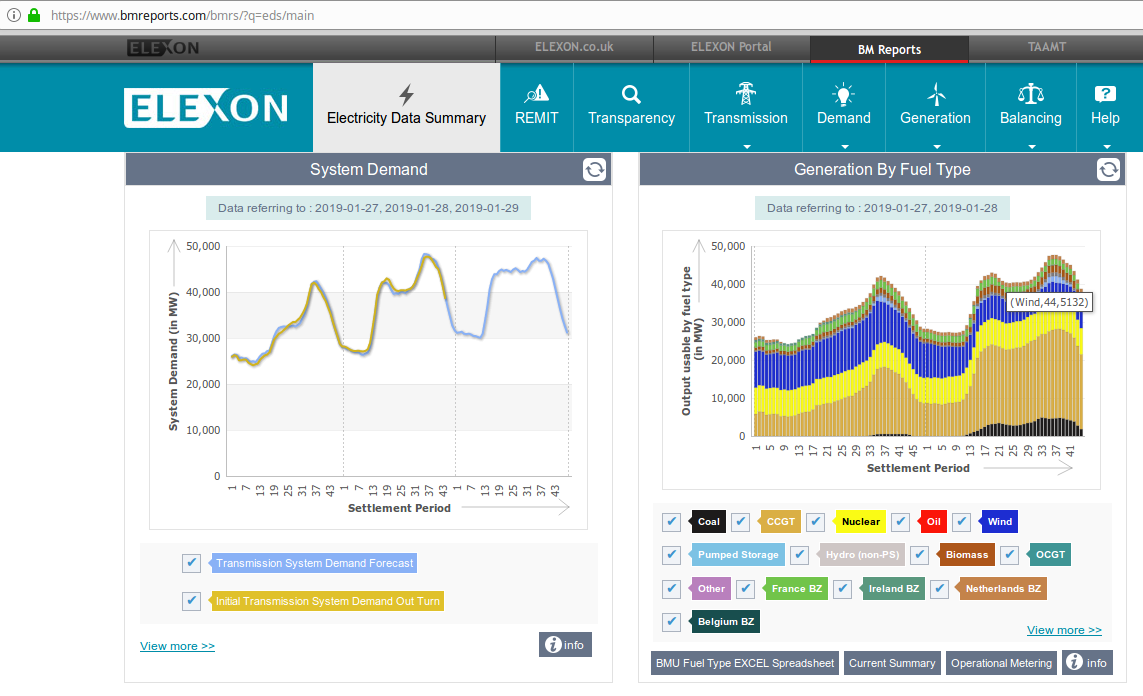
No. I know the mygrid website also uses BMreports and sheffield university for solar. I notice that the wind is always a little higher on mygird than than BMreports, I think that is because mygrid factors in microwind somehow. BMreports / Exelon is showing just under 10 GW of wind now. https://www.bmreports.com/bmrs/?q=eds/main
The guy on who runs mygrid, Andrew Crossland has an email address on his about page, he might have an interesting take http://www.mygridgb.co.uk/about/
nickflynn
on 26 Jan 2019
@lorrieq any clue?
corradio
on 26 Jan 2019
How does it compare to the data in ENTSO-E?
 jarek
on 26 Jan 2019
jarek
on 26 Jan 2019
This is our dataset for GB wind for 2018 (in MW)
mean 4772.920635
std 2853.686857
min 334.271000
25% 2366.611251
50% 4373.077542
75% 6881.473470
max 18331.732847
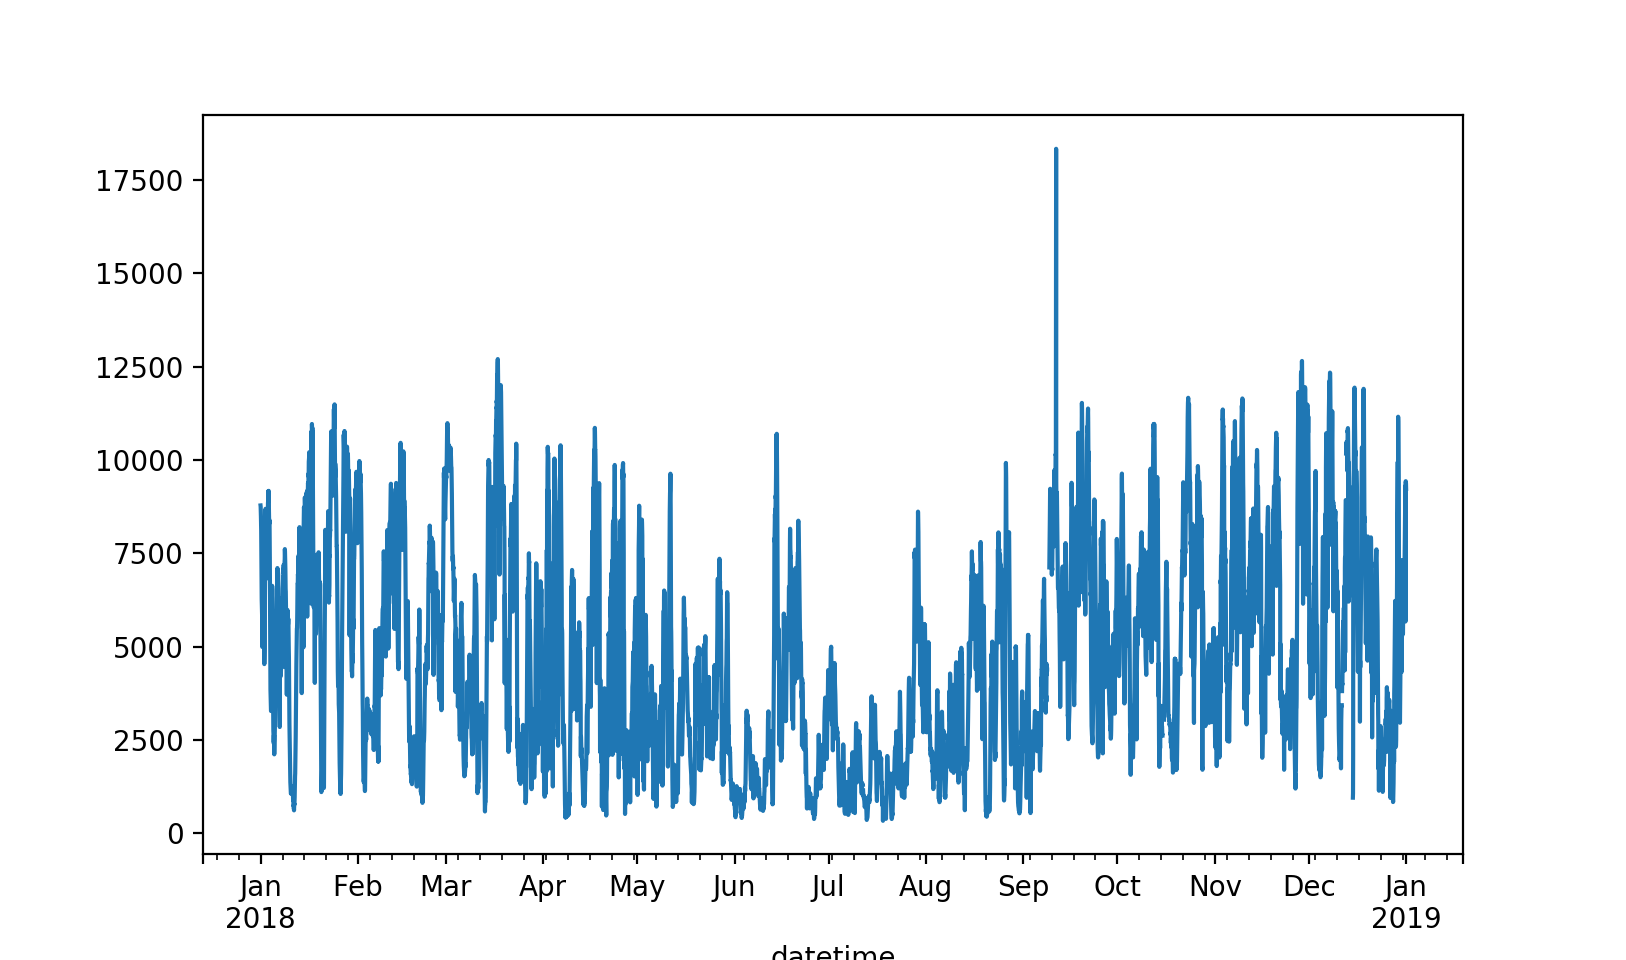
How "wrong" does it look to your opinion? Does this deserve change of parser and also rescraping historical data?
 brunolajoie
on 28 Jan 2019
brunolajoie
on 28 Jan 2019
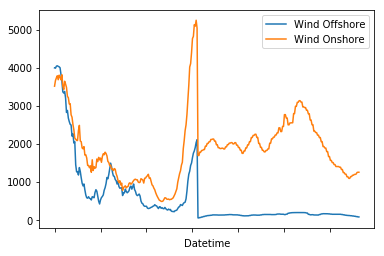
Whatever it is our parser is getting, it's not the same as displayed on bmreports page. EM screenshot in UTC-5, note that bmreports chart shows almost 48 hours.
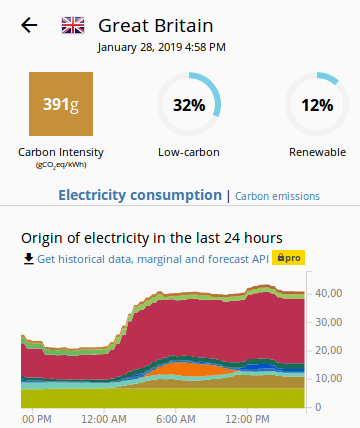
Right now bmreports shows around 5 GW of wind and EM only 1.3 GW.
jarek
on 28 Jan 2019
Hey guys, apologies for not being quicker on this.
We are reading production data per fuel type from this report.
It looks like an issue on their end as something weird happened to the wind in this report around 05:30 on the 25th and it has stayed strange since.
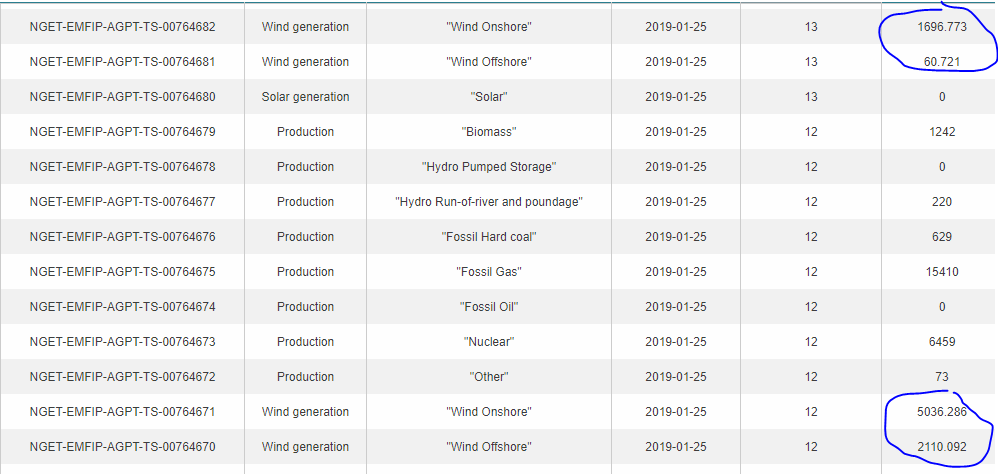
You have found valid values on the frontend and after a quick look I can see values that make more sense in another report which I presume is also available on the backend. However, I will send them an email now asking for an explanation and then we can decide on a course of action.
 lorrieq
on 29 Jan 2019
lorrieq
on 29 Jan 2019
_The data display in BM Reports is as received from National Grid_ was the response from BMRS. I have forwarded my email on to the National Grid contact they provided me.
lorrieq
on 29 Jan 2019
Yet to receive a response from National Grid. Perhaps we should look into finding the other report on the BMRS backend. The values don't always line up with our current source, especially for gas I'm noticing..
If this change is desired, I will implement. I guess we want to read the new report only for wind as it doesn't even have values for solar? We could include a switch of some sort and keep the code to parse each report in case anything like this happens again.
lorrieq
on 4 Feb 2019
Yes, switching to the report at https://www.bmreports.com/bmrs/?q=generation/fueltype looks like the right solution to me.
The values here seem to line up with what other sites report, including what the charts on bmreports itself show. This is also a higher-resolution data source, being reported every 5 minutes instead of each settlement period (30 minutes).
 bmckinlay
on 6 Feb 2019
bmckinlay
on 6 Feb 2019
Yes, we should go ahead and change report to the /fueltype one if you think
- data is better
- it uses our same elexon token
- we can fetch back in time too (to correct january faulty data to start with)
It seems true, but I haven't had time to give a deeper look at it! Your call!
brunolajoie
on 7 Feb 2019
Why is the data still noisy, even though "Add option to read GB wind from other report #1779" has been merged?
 aarbur
on 19 Feb 2019
aarbur
on 19 Feb 2019
It hasn't been released to production yet.
It will be done soon.
On Tue 19 Feb 2019 at 10:41, aarbur notifications@github.com wrote:
Why is the data still noisy, even though "Add option to read GB wind from
other report #1779
https://github.com/tmrowco/electricitymap-contrib/pull/1779" has been
merged?—
You are receiving this because you commented.Reply to this email directly, view it on GitHub
https://github.com/tmrowco/electricitymap-contrib/issues/1754#issuecomment-465059690,
or mute the thread
https://github.com/notifications/unsubscribe-auth/ABlEKD6qqnIRe374tBxP9fZmmkex0JiVks5vO8bMgaJpZM4aULui
.>
www.tmrow.com
+45 53 70 44 03
[image: Image result for linkedin] http://linkedin.com/in/oliviercorradi
linkedin.com/in/oliviercorradi https://www.linkedin.com/in/oliviercorradi
[image: Image result for twitter] @corradio https://twitter.com/corradio
corradio
on 19 Feb 2019
Looks good now. Maybe confirm the data has been backfilled in the backend before closing the issue.
lorrieq
on 19 Feb 2019
Historical refetch worked perfectly. Thanks!
brunolajoie
on 20 Feb 2019
Related issues
 wojciej
·
3Comments
corradio
·
4Comments
wojciej
·
3Comments
corradio
·
4Comments
 jiwidi
·
4Comments
jiwidi
·
4Comments
 Alain-Ivadolabs-Ext
·
4Comments
corradio
·
4Comments
Alain-Ivadolabs-Ext
·
4Comments
corradio
·
4Comments
Most helpful comment
Hey guys, apologies for not being quicker on this.
We are reading production data per fuel type from this report.
It looks like an issue on their end as something weird happened to the wind in this report around 05:30 on the 25th and it has stayed strange since.


You have found valid values on the frontend and after a quick look I can see values that make more sense in another report which I presume is also available on the backend. However, I will send them an email now asking for an explanation and then we can decide on a course of action.