Electricitymap-contrib: Idea - new approach to display detailed information about percentage production / consumption or carbon emission.
Hello,
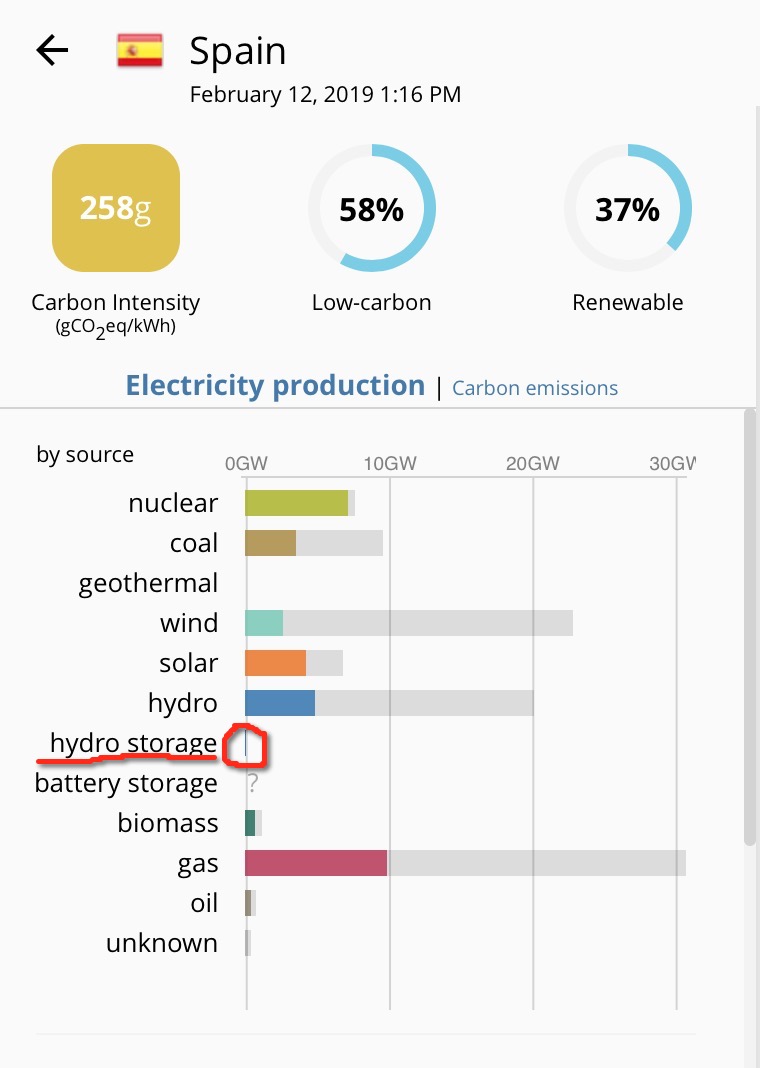
I have noticed that for countries with very small production per type it is very hard to get detailed information by trying to hover the vertical graph.
For example
Spain has only 11,32MW of "hydro storage capacity", now when we look at the map its impossible to get detailed info of how much is it utilised by hovering over the graph.
Similar difficulties to hover over:
- Austria and "oil": 178
- Romania and "biomas": 95
- Poland and "solar": 197 (currently on a map with fix on the way)
My point here is that while it is difficult to hover over the graph with mouse on computer it is almost impossible to click on it with your finger in mobile app.
I would like to put under consideration a way to add hovering over a name of the source - not only the graph.
This way with very small source it would be easier to hover over its name that is significantly bigger than a graph in come cases.
While this is an idea - I am unable to implement it.
Thanks for your consideration
 wojciej
All 3 comments
What about making the text ("hydro storage") also hoverable/clickable/tappable, as well as the bar chart? Or better still, the entire row: text string, bar and unused-bar-space.
 aarbur
on 12 Feb 2019
aarbur
on 12 Feb 2019
Hey, the text thing is exactly what I meant by "hovering over a name of the source", but adding option for action on entire row seems to be even better - if possible.
wojciej
on 12 Feb 2019
Look at #1846
 jld3103
on 5 May 2019
jld3103
on 5 May 2019
Related issues
 Alain-Ivadolabs-Ext
·
4Comments
Alain-Ivadolabs-Ext
·
4Comments
 pascalheraud
·
4Comments
pascalheraud
·
4Comments
 consideRatio
·
4Comments
consideRatio
·
4Comments
 corradio
·
4Comments
corradio
·
4Comments
 systemcatch
·
4Comments
systemcatch
·
4Comments
Most helpful comment
Hey, the text thing is exactly what I meant by "hovering over a name of the source", but adding option for action on entire row seems to be even better - if possible.