Electricitymap-contrib: Add Maharashtra (India) IN-MH
Not sure if any of you OCR-experts already had a go at it in the past, but here is another challenge still waiting for you ;)
I tried to elaborate a bit more on what needs to be included and where to find this info in the images.
Feel free to comment below and reach out on Slack should you have any questions related to this. 😸
This one may have gone lost a bit in the large #304 "Add India" (and #817 OCR) thread and could cover yet another large state on the west coast of India. So I decided to open a seperate issue on this and see what we can do here for Maharashtra.
On the website of Maharashtra State Load Despatch Center there is a tab named "SCADA Data".
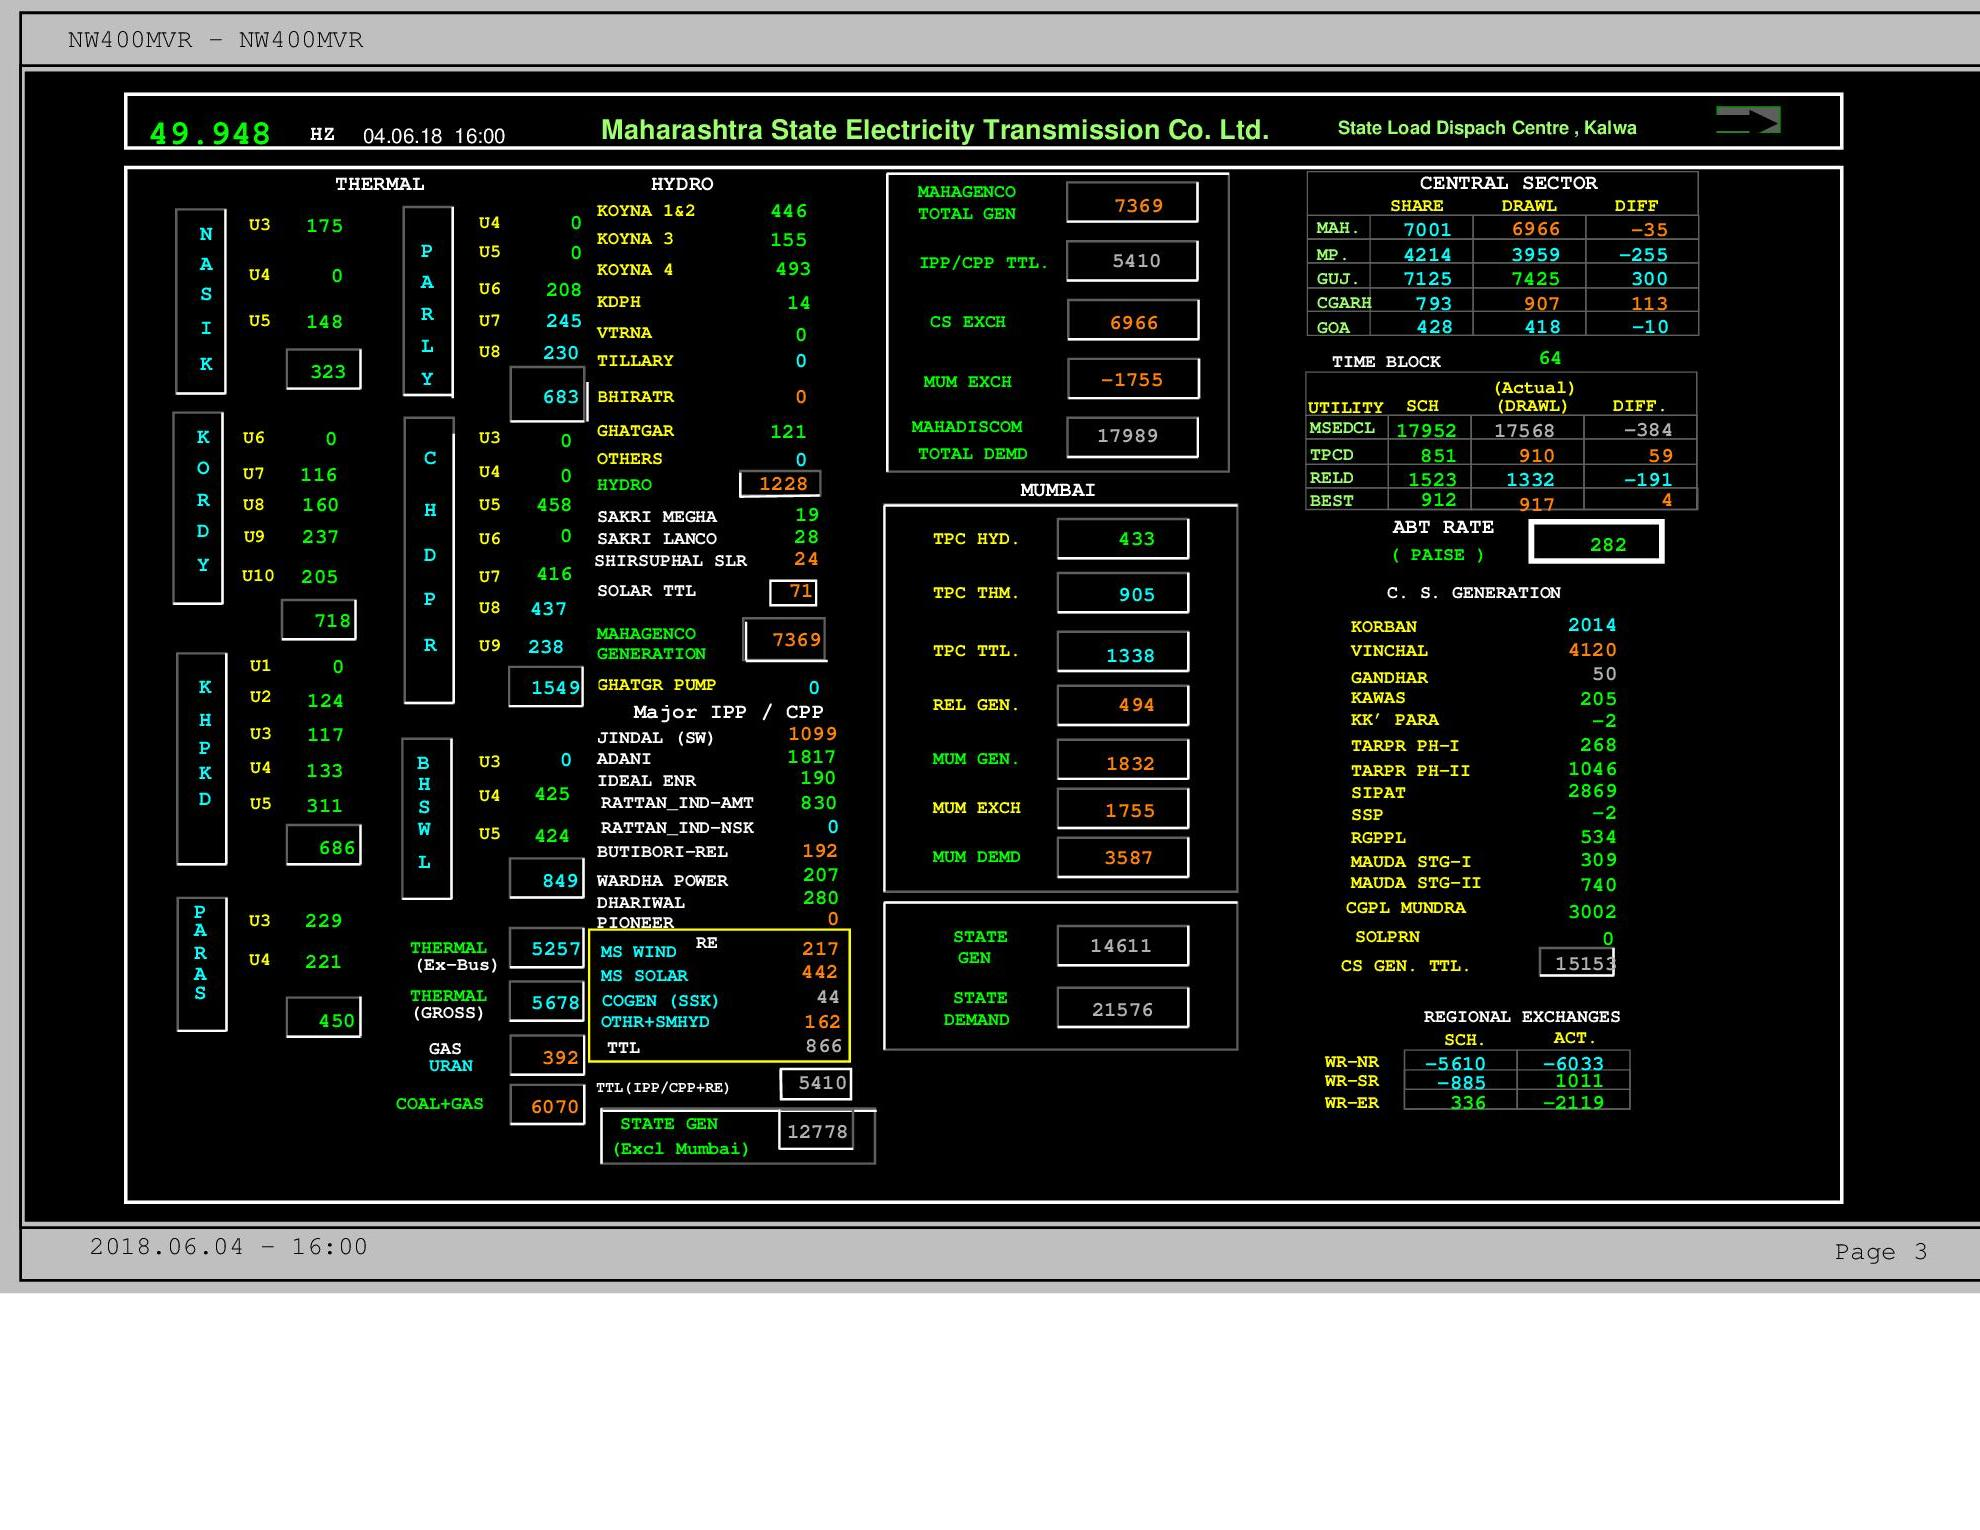
First off, there seems to be a single image containing all of the relevant generation for all types:
I played around with the URLs of the various images, and changing the end of the URL to "3.jpg" leads to this major dashboard:
https://mahasldc.in/wp-content/reports/sldc/mvrreport3.jpg
- coal: "THERMAL" in the lower left part of the image is for generation from coal. There is data for net generation ("behind bus") and gross generation, I suggest using the latter one to cover self-consumption related emissions (~+10%).
- gas: Below thermal, there is "GAS". Don't get distracted by the "Uran" label, it's not related to nuclear but just a city name of the unit's location south of Mumbai.
- hydro: The next column slightly left of the center has a field summarizing total "hydro" output.
- Note: Within the hydro units, there is "Ghatghar", which is a pumped storage hydro plant!!! If we decide to put this in its respective category, there is another field "Ghatgr pump" for the pumping consumption (I have not yet observed if it's showing any value, it's 0 at the moment.)
So the Ghatghar output could be subtracted from HYDRO and added to hydro storage, in case OCR works reliably enough to perform this.
- Note: Within the hydro units, there is "Ghatghar", which is a pumped storage hydro plant!!! If we decide to put this in its respective category, there is another field "Ghatgr pump" for the pumping consumption (I have not yet observed if it's showing any value, it's 0 at the moment.)
- solar, wind, biomass, unknown: On the bottom of this column, there is a yellow box containing several types of generation.
Obviously, MS WIND is wind and MS SOLAR is solar. CO-GEN is from biomass (bagasse).
I'd map the output of of "OTHER + SMHYD" entirely to "unknown", because small hydro has a tiny share (scroll down to the end for the direct link to that dashboard). - nuclear: There are nuclear units of Tarapur power station TARPR PH-I (oldest operational in the world) and TARPR PH-II, displayed under the "C. S. GENERATION" section on the very right
There are three more crucial things to consider, which makes it really complicated.
- The city of Mumbai, which is within Maharashtra on the west coast, has a seperate box with figures for generation and demand. It is split to "TPC THM" for thermal, "TPC HYD" for hydro and "REL GEN", probably for "relative share of generation in some power plants outside of Mumbai".
1.1 TPC THM could be added to coal, because these are the types of plants in Mumbai operated by Tata Power Company (=TPC!).
1.2 There is no hydro power plant directly within the city of Mumbai. But this figure is probably related to some hydro power plants of the private sector, which also belong to the private Mumbai based Tata Power Company with 310 MW of hydro installed very, very close to Mumbai in three locations. https://npp.gov.in/dashBoard/cp-map-dashboard So I think it's legit to include these hydro figures as well!
1.3 "REL GEN" could be excluded or just added to unknown. - There is another huge chunk of "IPP / CPP" generation, which stands for Intependent and Central power producers. The list contains 9 of such power plants plus "other", that seem to produce for Maharashtra, but are not necessarily located within the state. I tried to locate them and their fuel types:
- JINDAL - Jindal Tamnar coal power plant in Chhattisgarh
- ADANI - Mundra thermal coal power station operated by Adani in Gujarat (we've had this in the last Gujarat improvement issue)
- IDEAL ENR - Bela coal power plant owned by ideal in Maharashtra
- RATTAN_IND-AMST and _IND-NSK - RattanIndia coal power plants in Amravati and Nasik in Maharashtra
- BUTIBORI-REL - coal power plant in Maharashtra
- WARDHA - Wardha-Warora coal power plant in Maharashtra
- DHARIWAL - Dhariwal coal power station in Maharashtra
- PIONEER - Pioneer gas power plant in Maharashtra
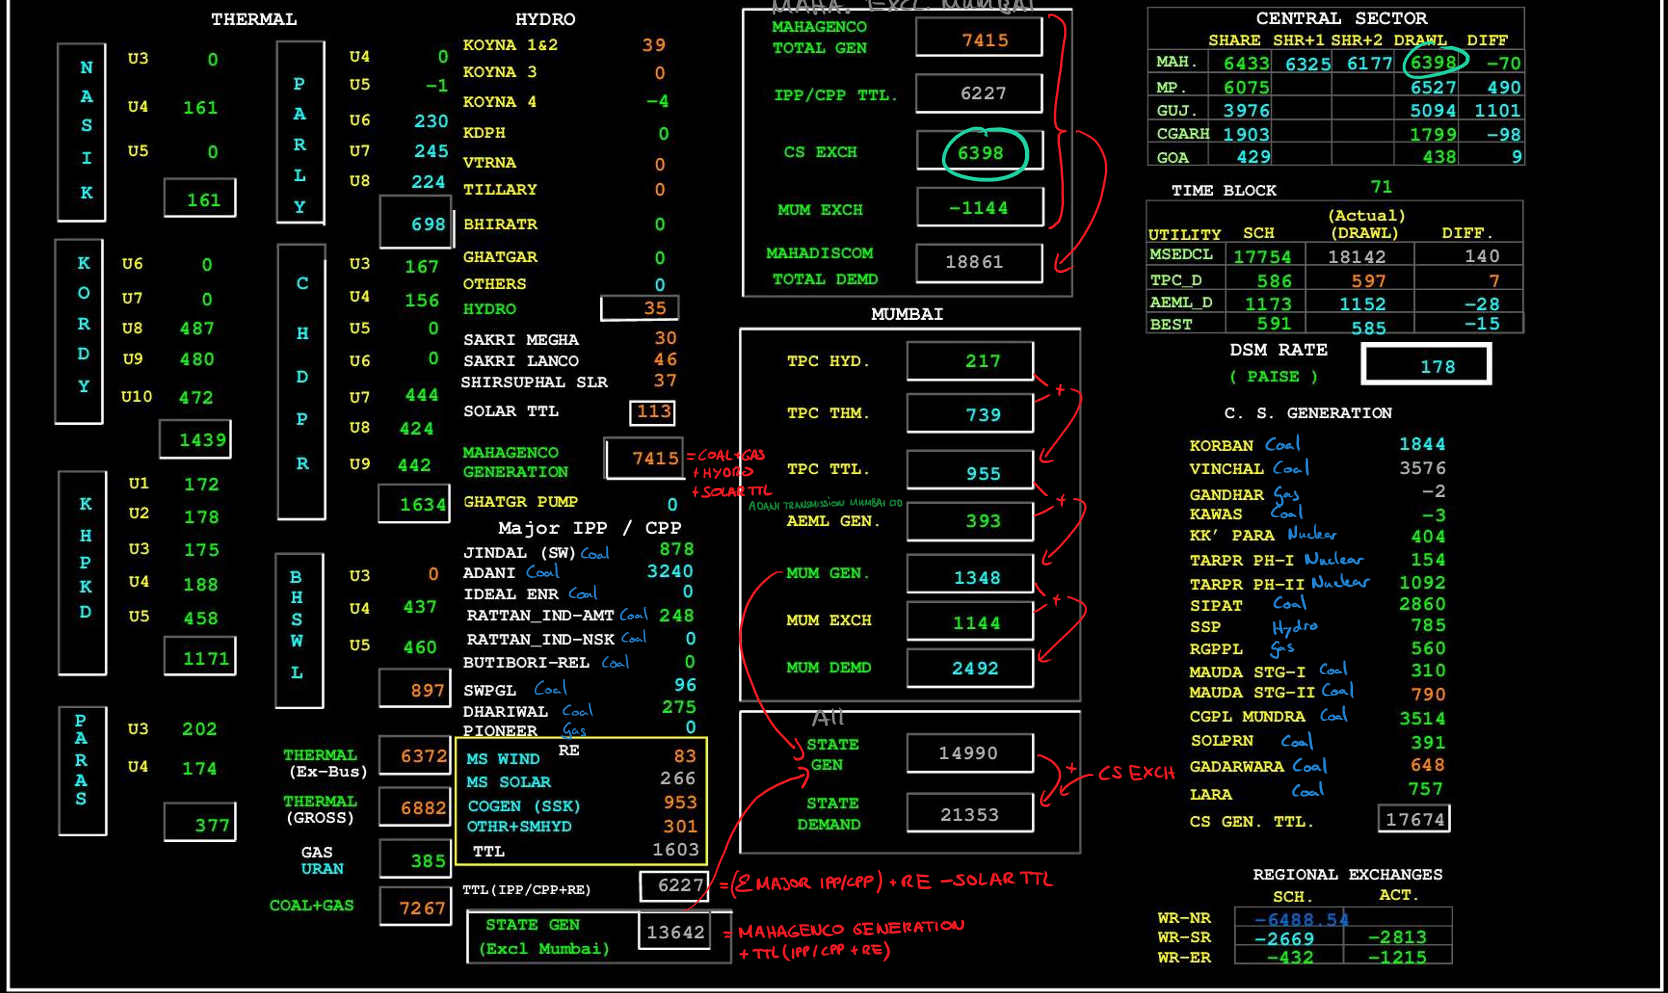
- Central state generation is also displayed on the right side of the board. Some of these ultra super large power plants are in Maharashtra, some are outside of it. Not sure what to do with this data, maybe including all that is within IN-MH is the way to go since they feed in the grid of this state and make up the mix.
Here are the power plants of the central sector and their types + locations: - KORBAN - Korba coal power station in Chhattisgarh
- VINCHAL - Vindhyachal coal power station in Madhya Pradesh
- GANDHAR - Jhanor-Ghandar gas power station in Gujarat
- KAWAS - Kawas coal power station in Gujarat
- KK' PARA - Kakrapar nuclear power station in Gujarat
- TARPR PH-I and TARPR PH-II - Tarapur nuclear in Maharashtra (see comments above)
- SIPAT - Sipat coal power station in Chhattisgarh
- SSD - Sardar Sarovar hydro dam in Gujarat (suffering from drouhgts)
- RGPPL - Ratnagiri gas and power in Maharashtra
- MAUDA STG-I and STG-II - Mauda super thermal coal power station in Maharashtra
- CGPL MUNDRA - Mundra ultra mega coal power plant in Gujarat
- SOLPRN - Solapur super thermal coal power station in Maharashtra
Here is the image of the dashboard with all that info:
Further details for the types of generation, but not necessarily needed for the parser:
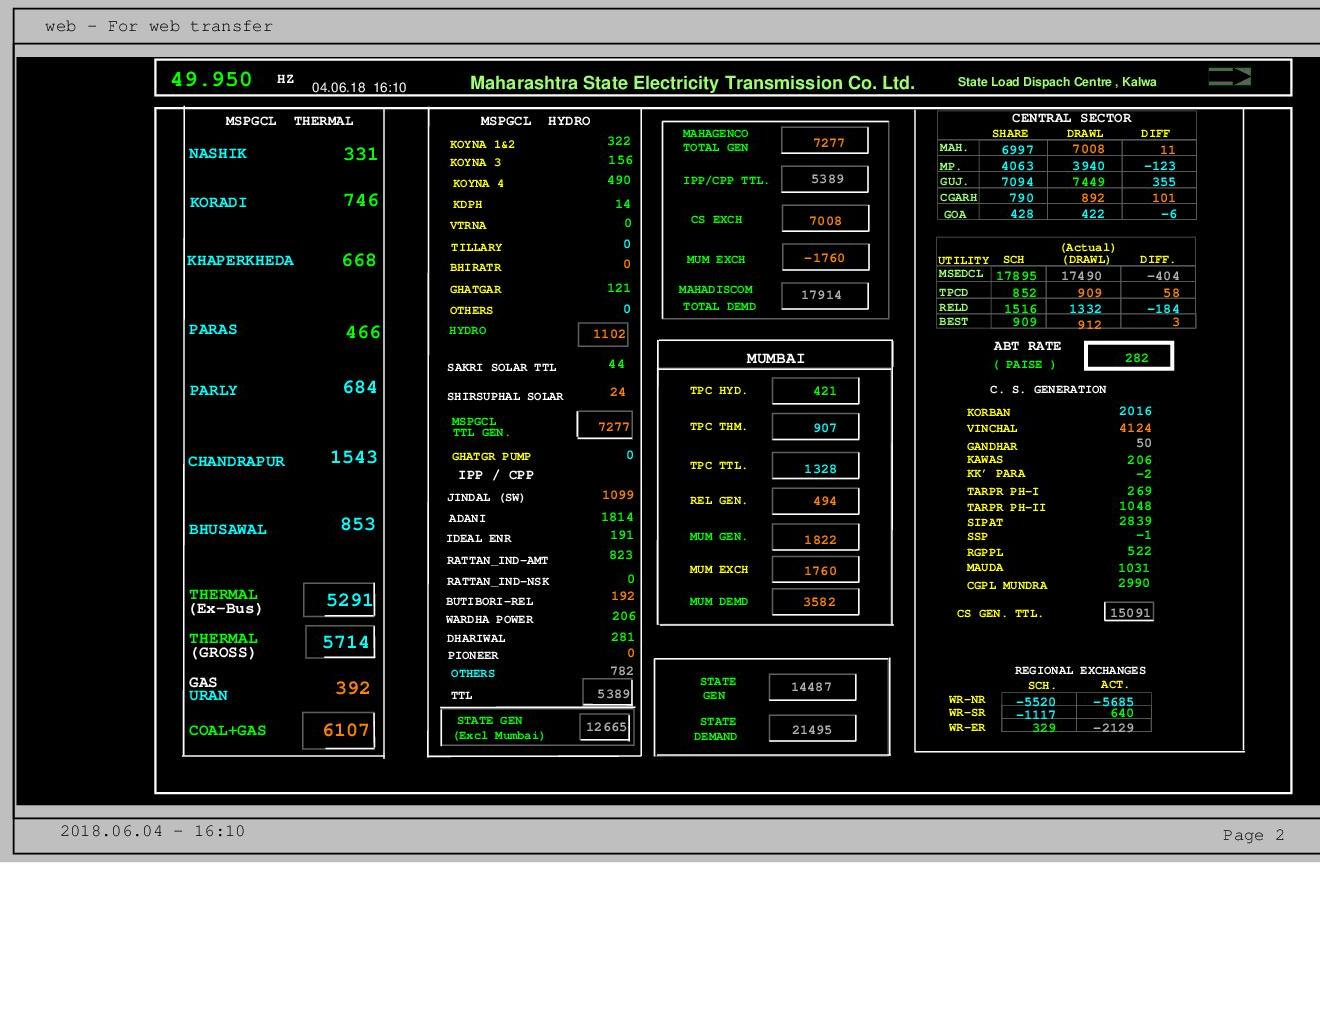
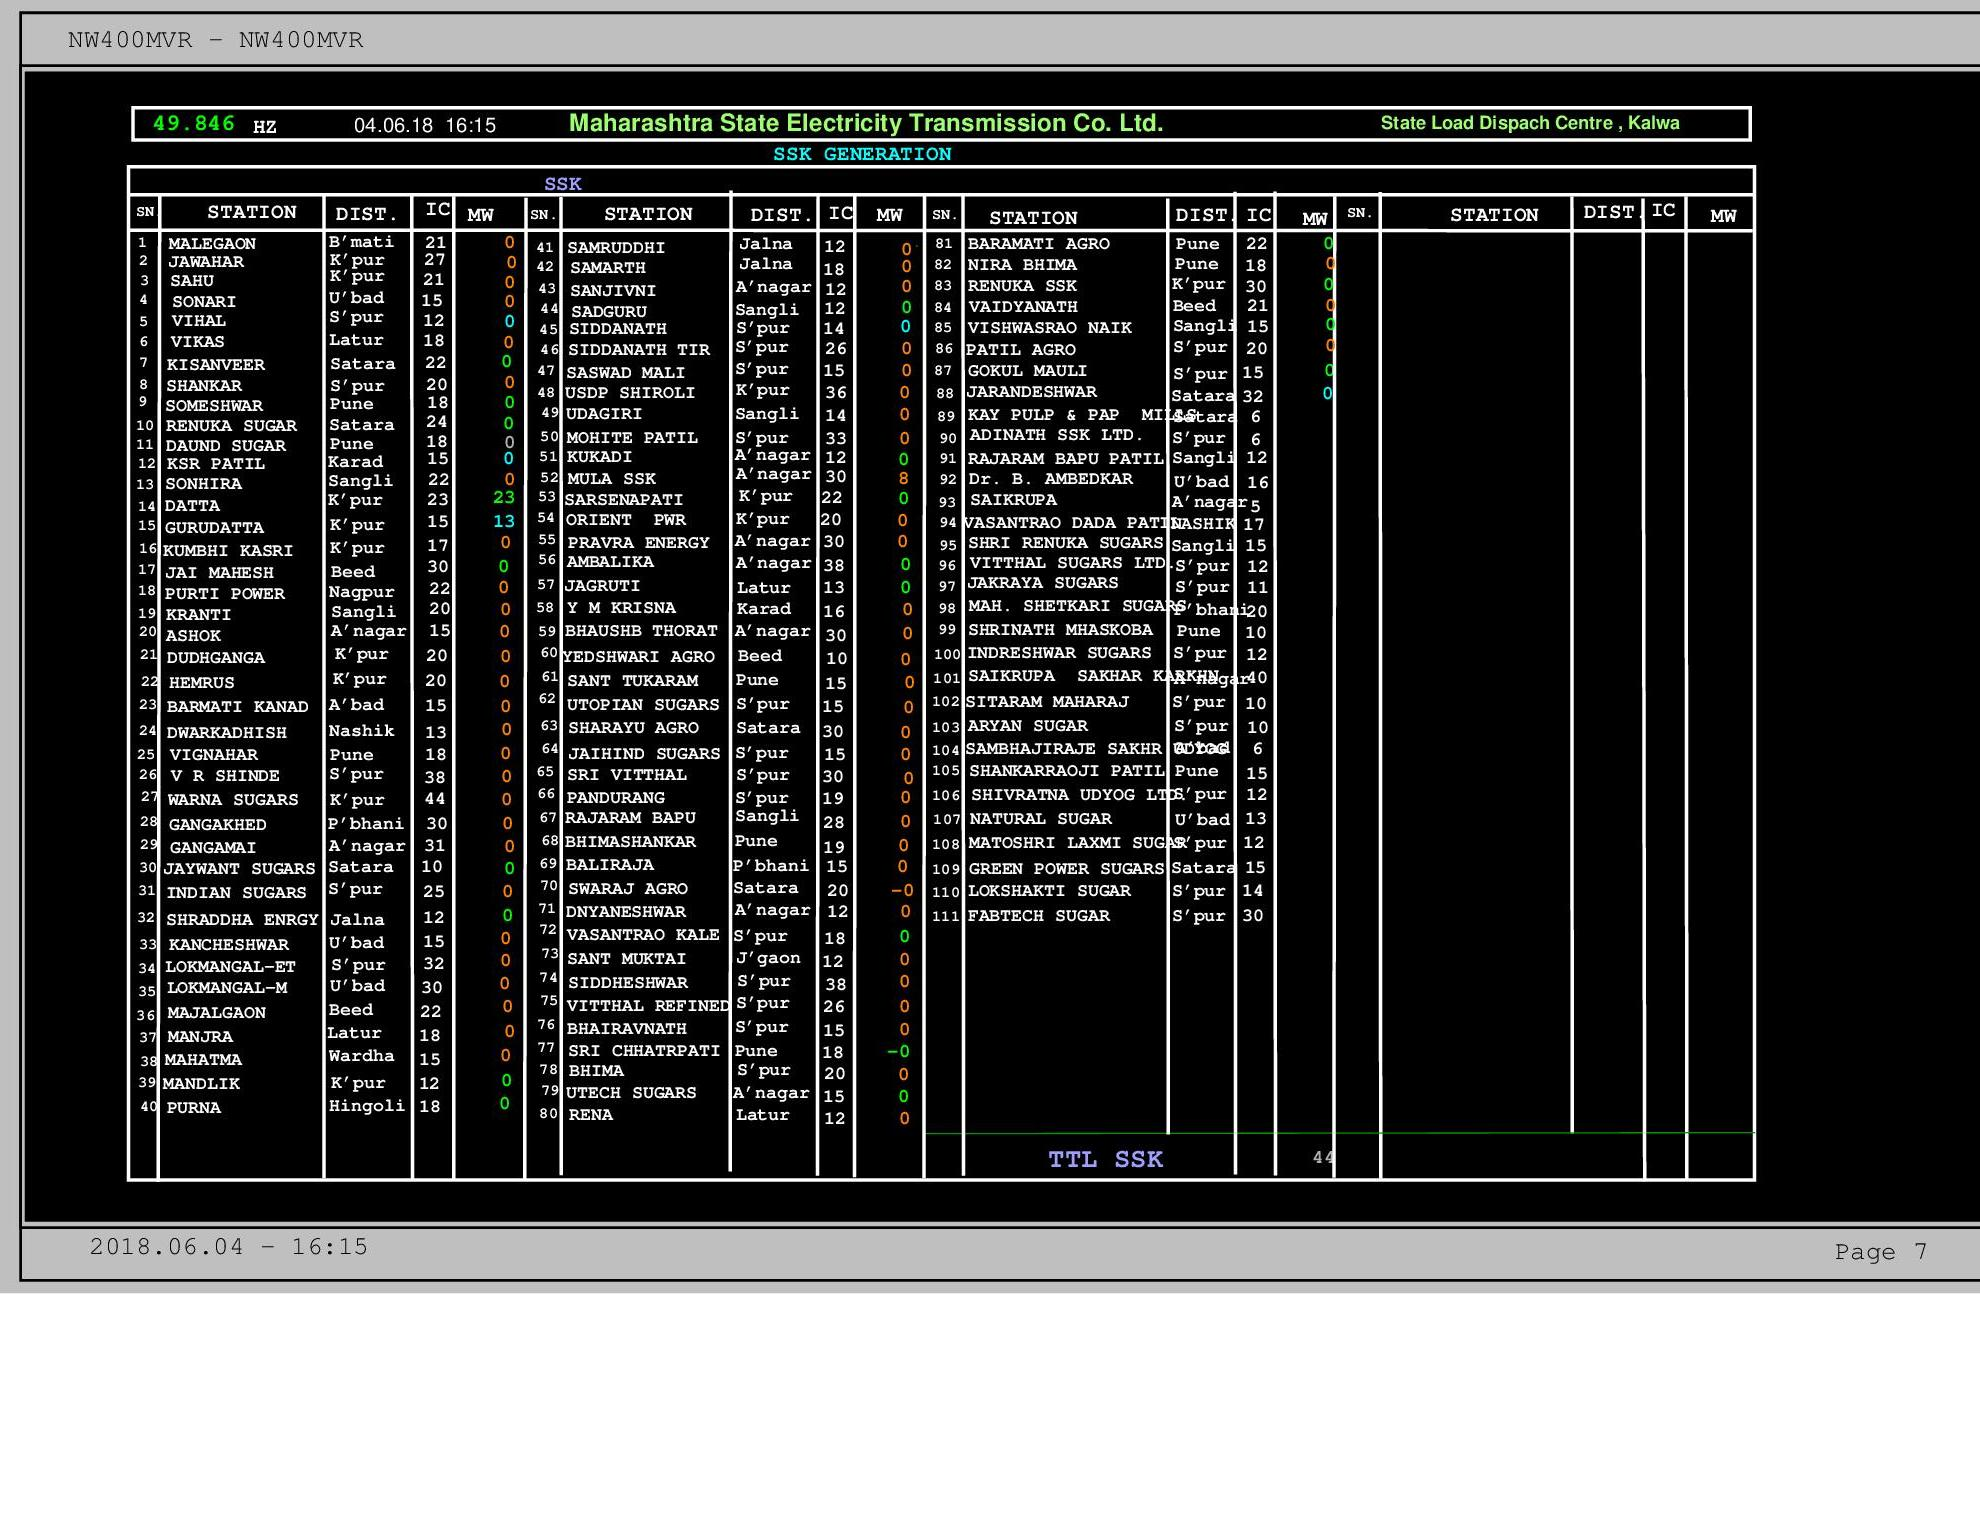
Station wise generation, exchange and demand (many, many figures):
https://mahasldc.in/report2/
https://mahasldc.in/wp-content/reports/sldc/report2.jpg
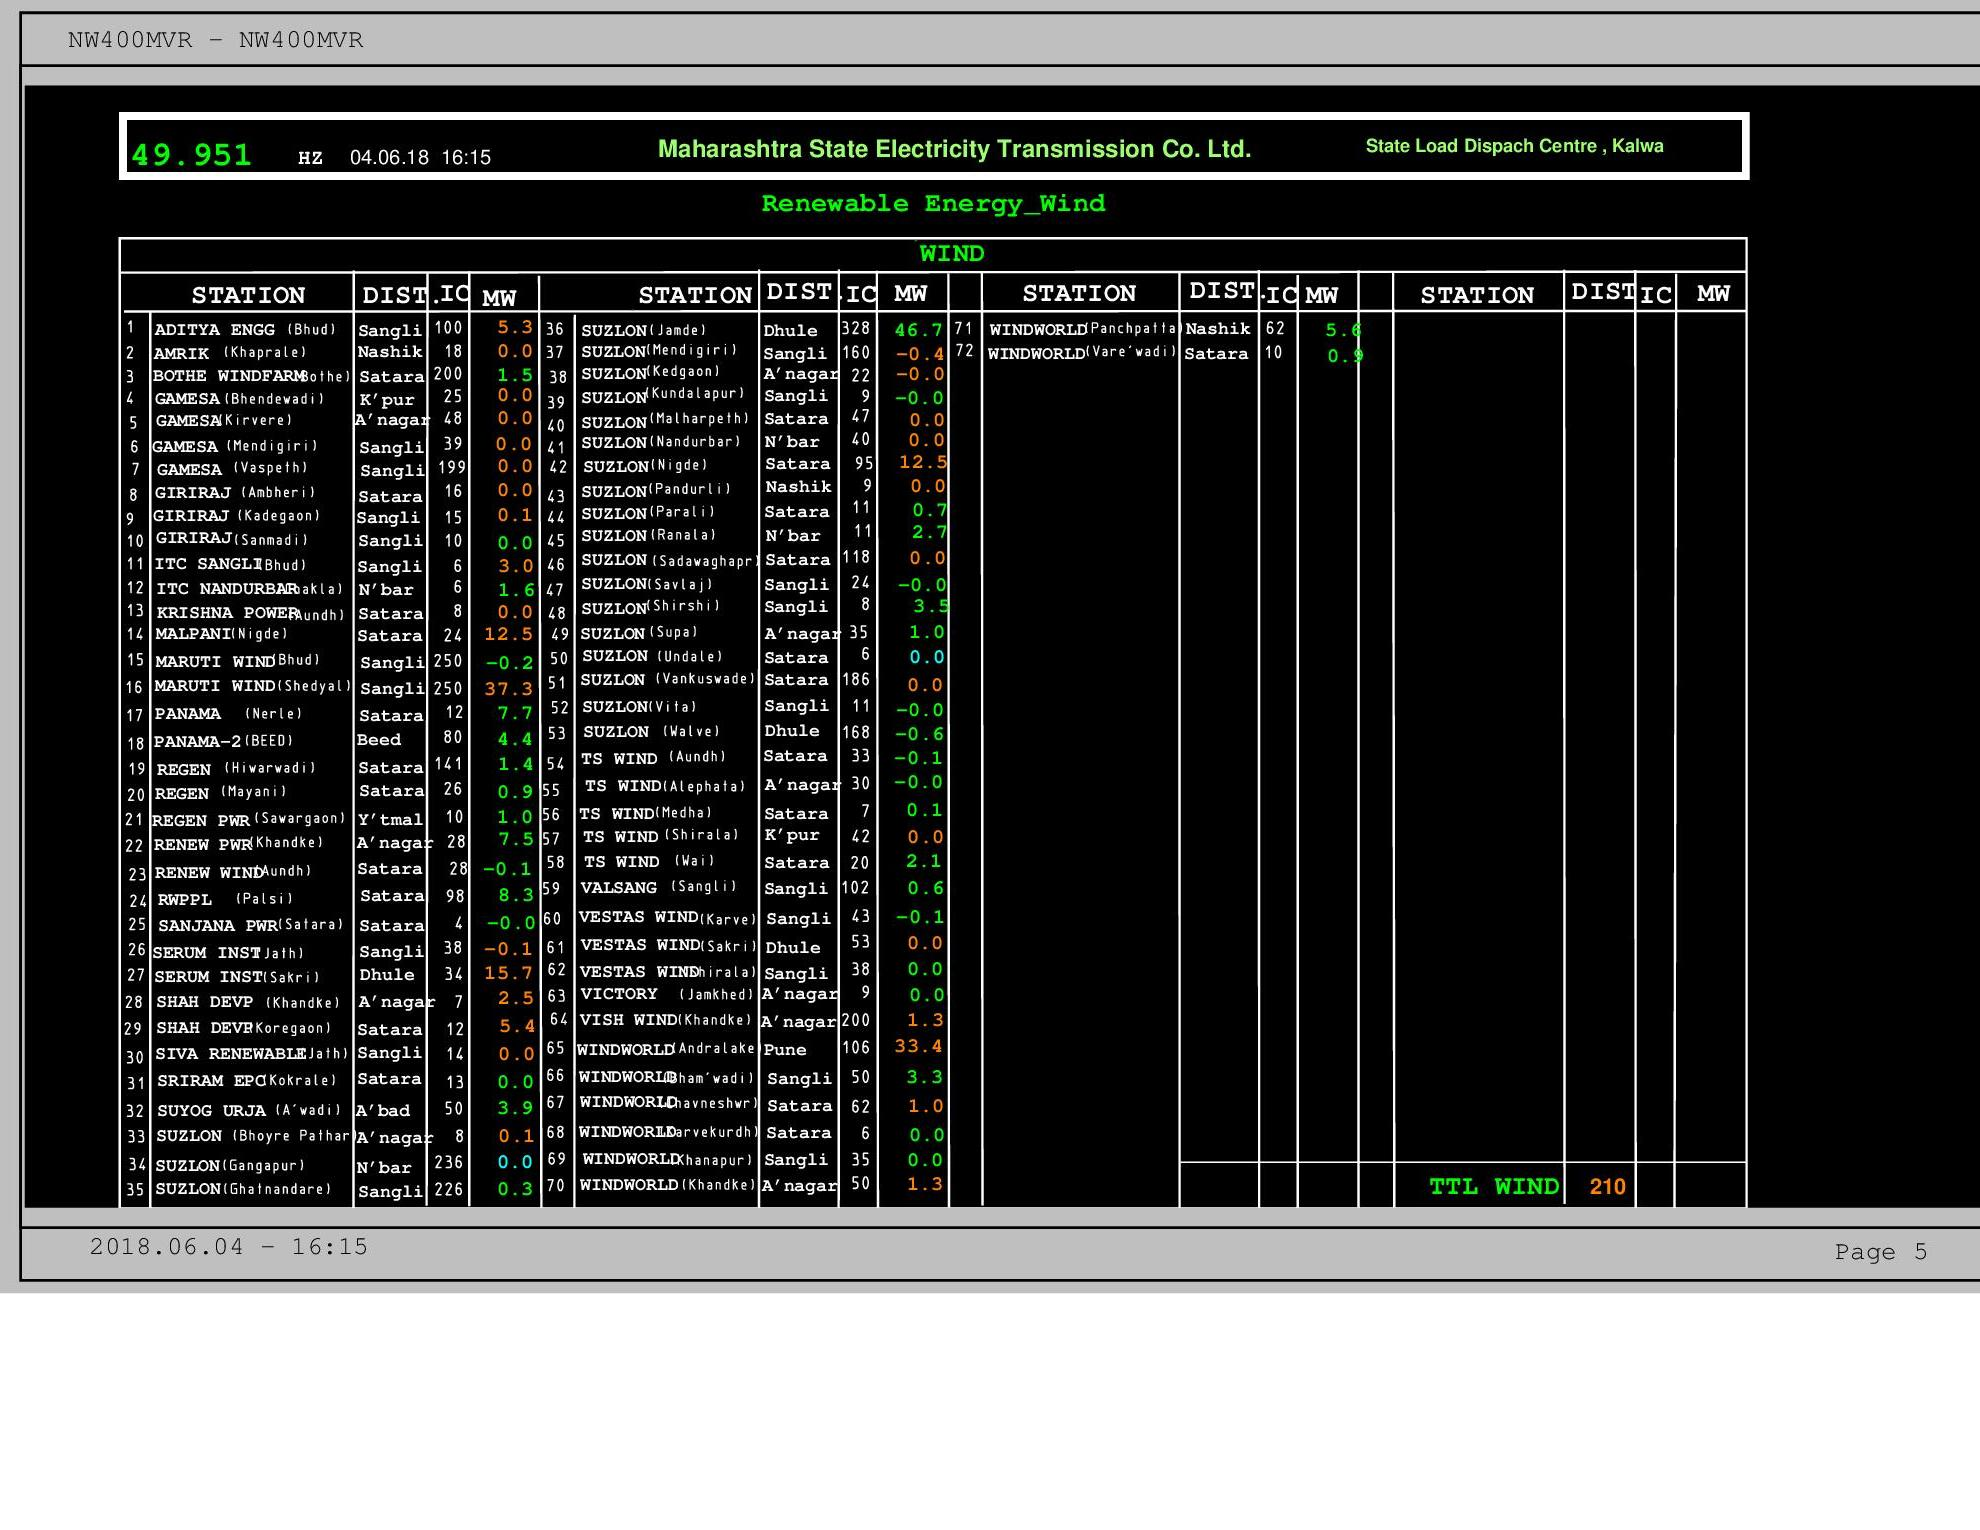
Wind generation data:
https://mahasldc.in/on-line-re-data/
https://mahasldc.in/wp-content/reports/sldc/mvrreport5.jpg
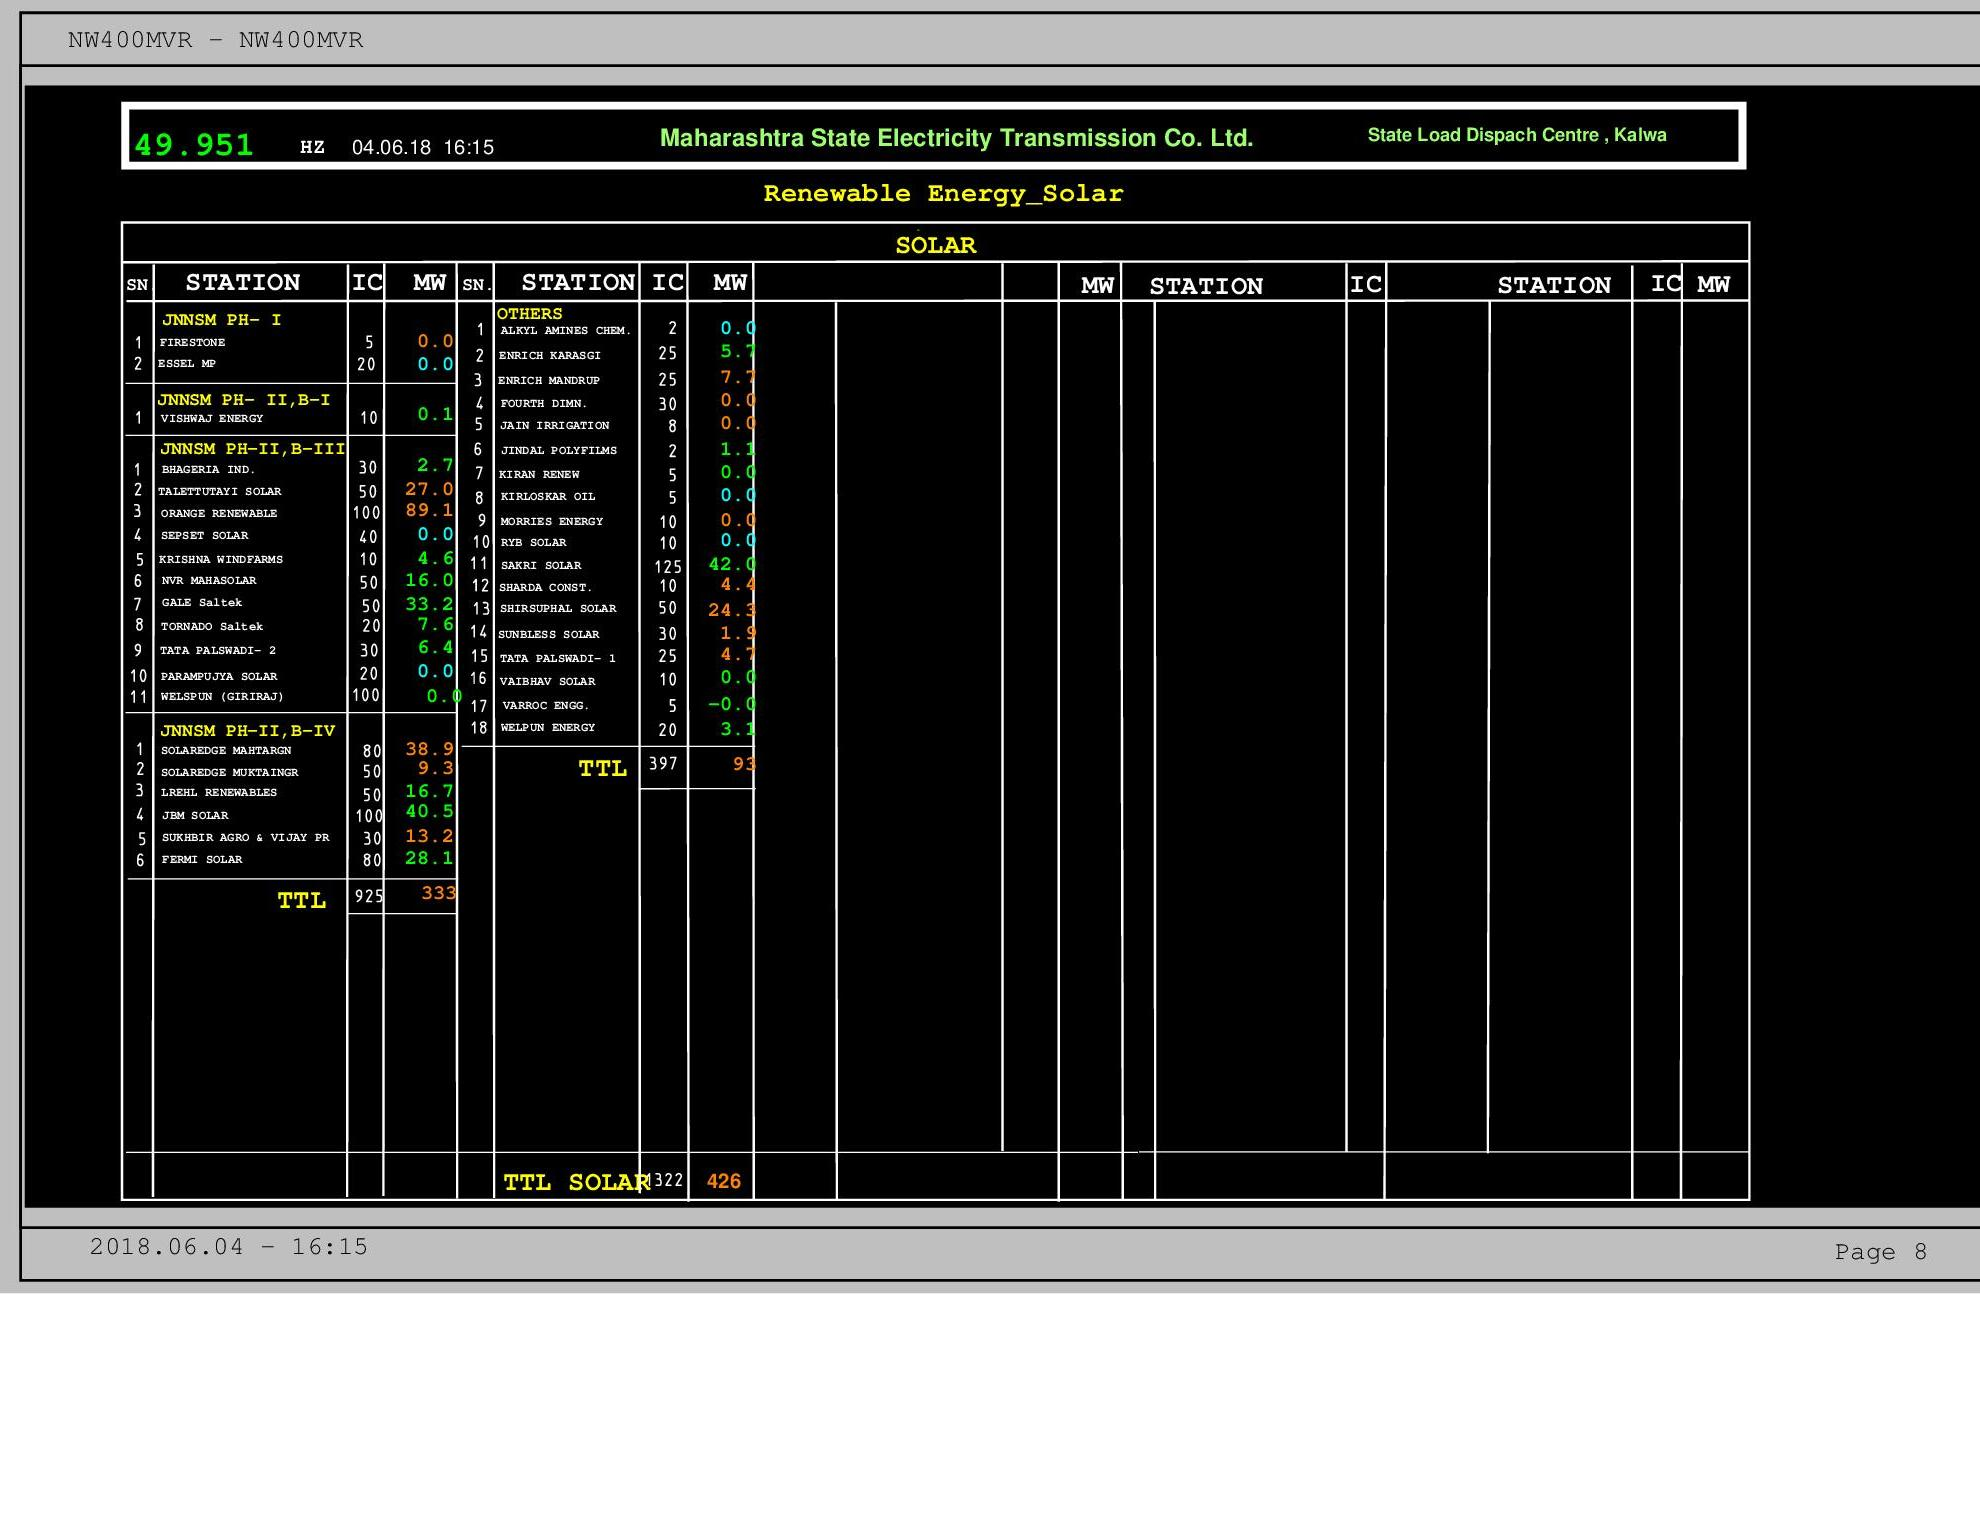
Solar data:
https://mahasldc.in/on-line-solar-data/
https://mahasldc.in/wp-content/reports/sldc/mvrreport8.jpg
Something called "Bagasse data" (= biomass):
https://mahasldc.in/on-line-co-gen-others-data/
https://mahasldc.in/wp-content/reports/sldc/mvrreport7.jpg
And, finally, "others and small hydro":
https://mahasldc.in/on-line-others-small-hydro/
https://mahasldc.in/wp-content/reports/sldc/mvrreport9.jpg
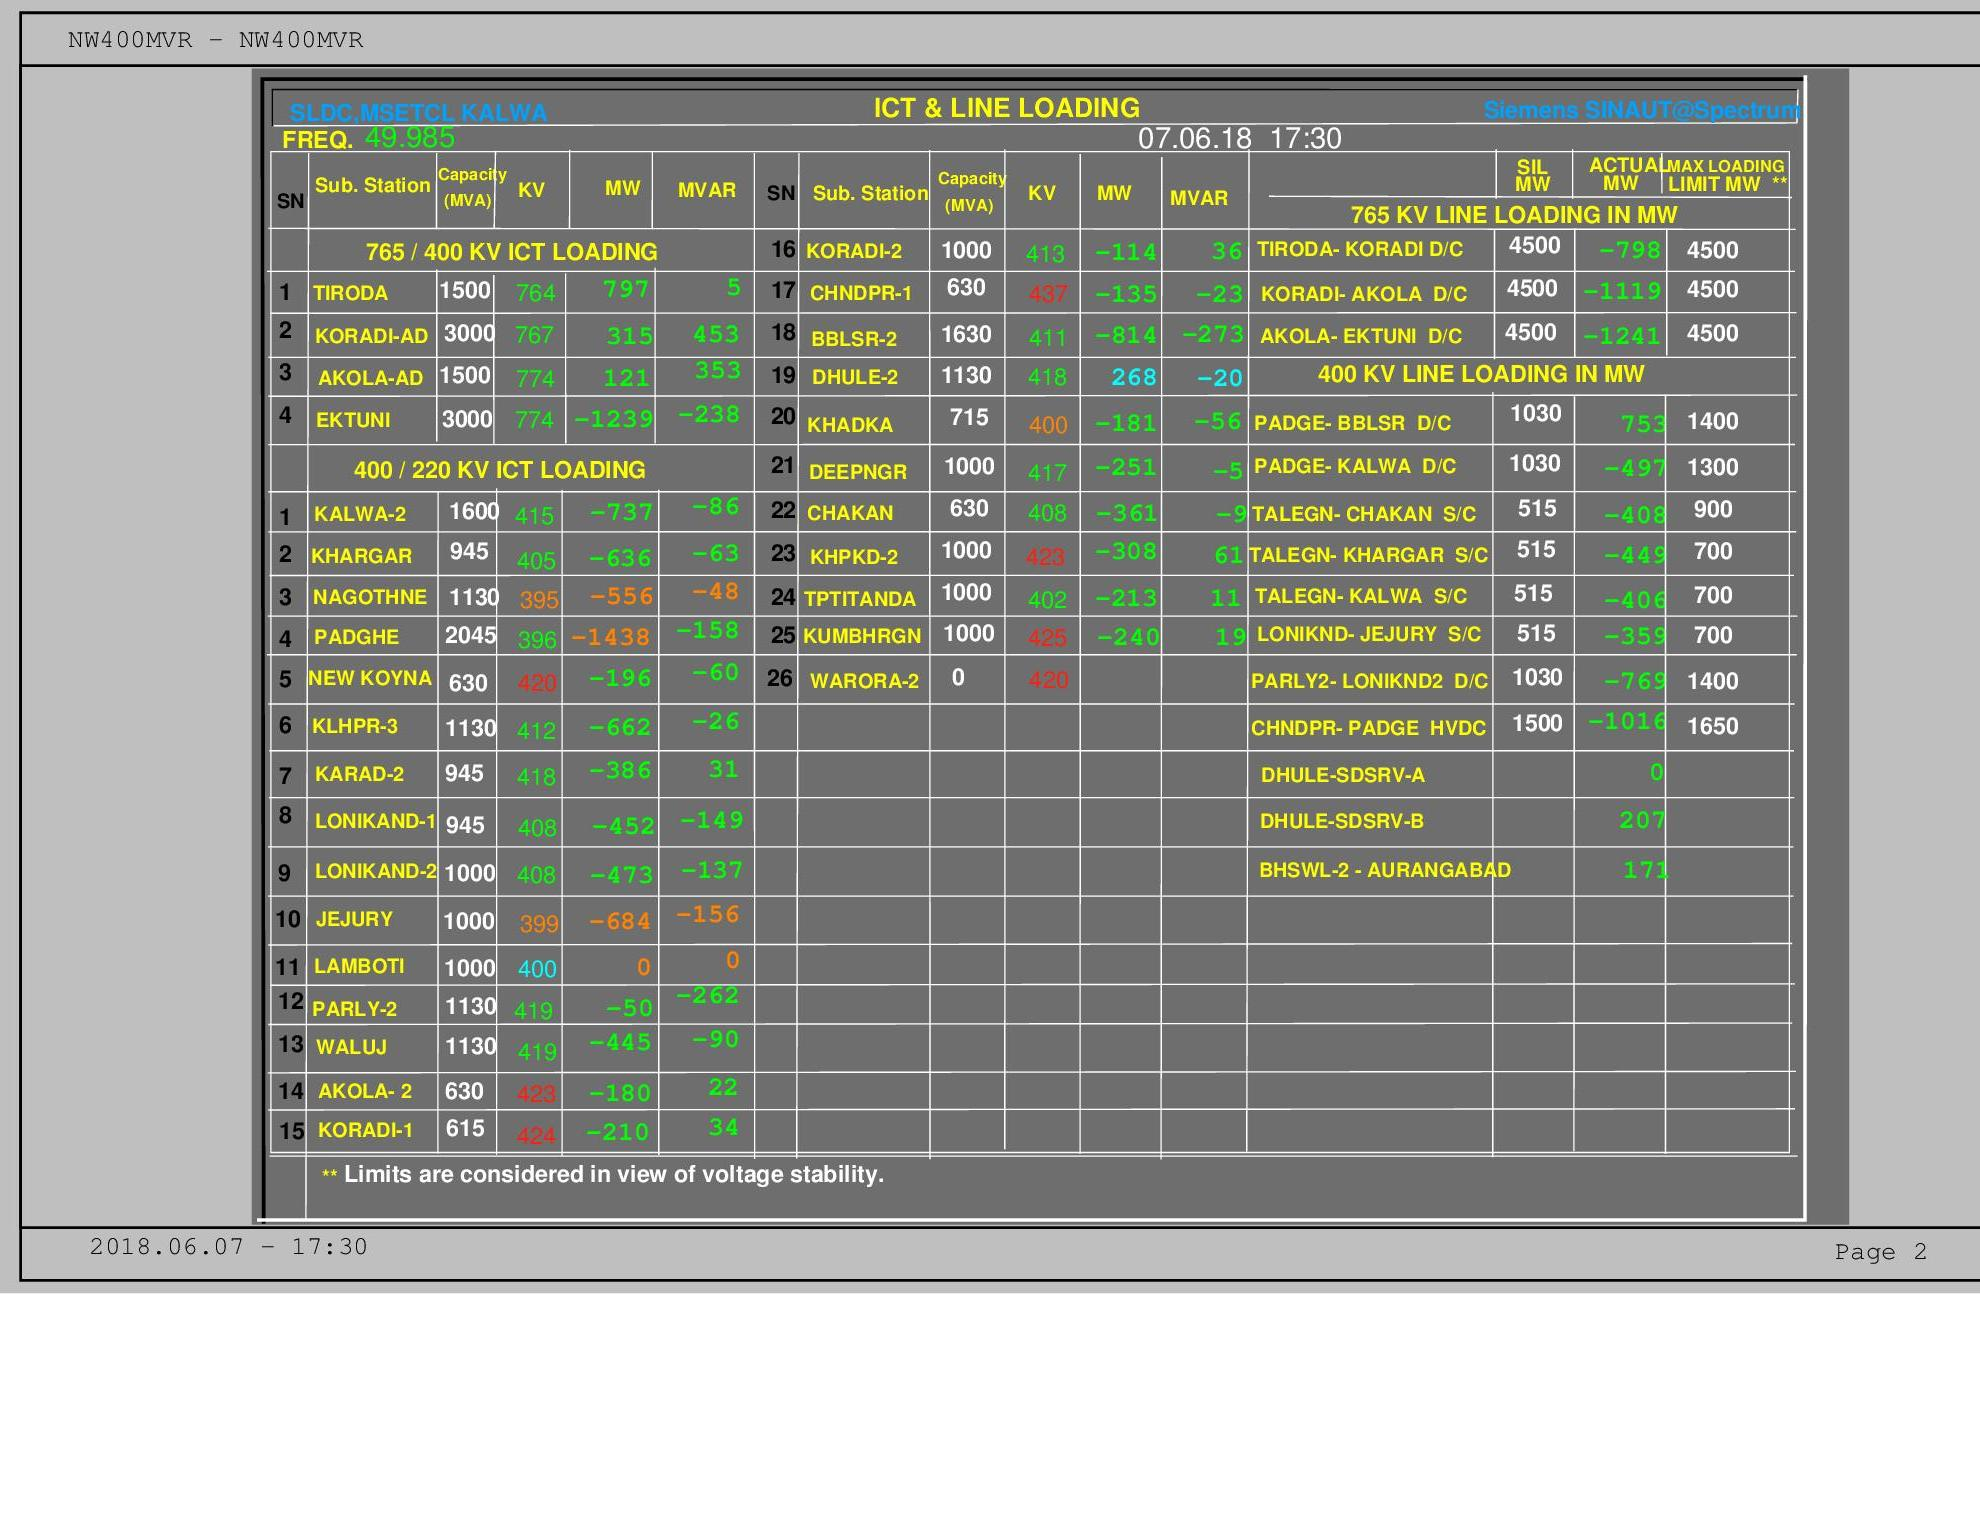
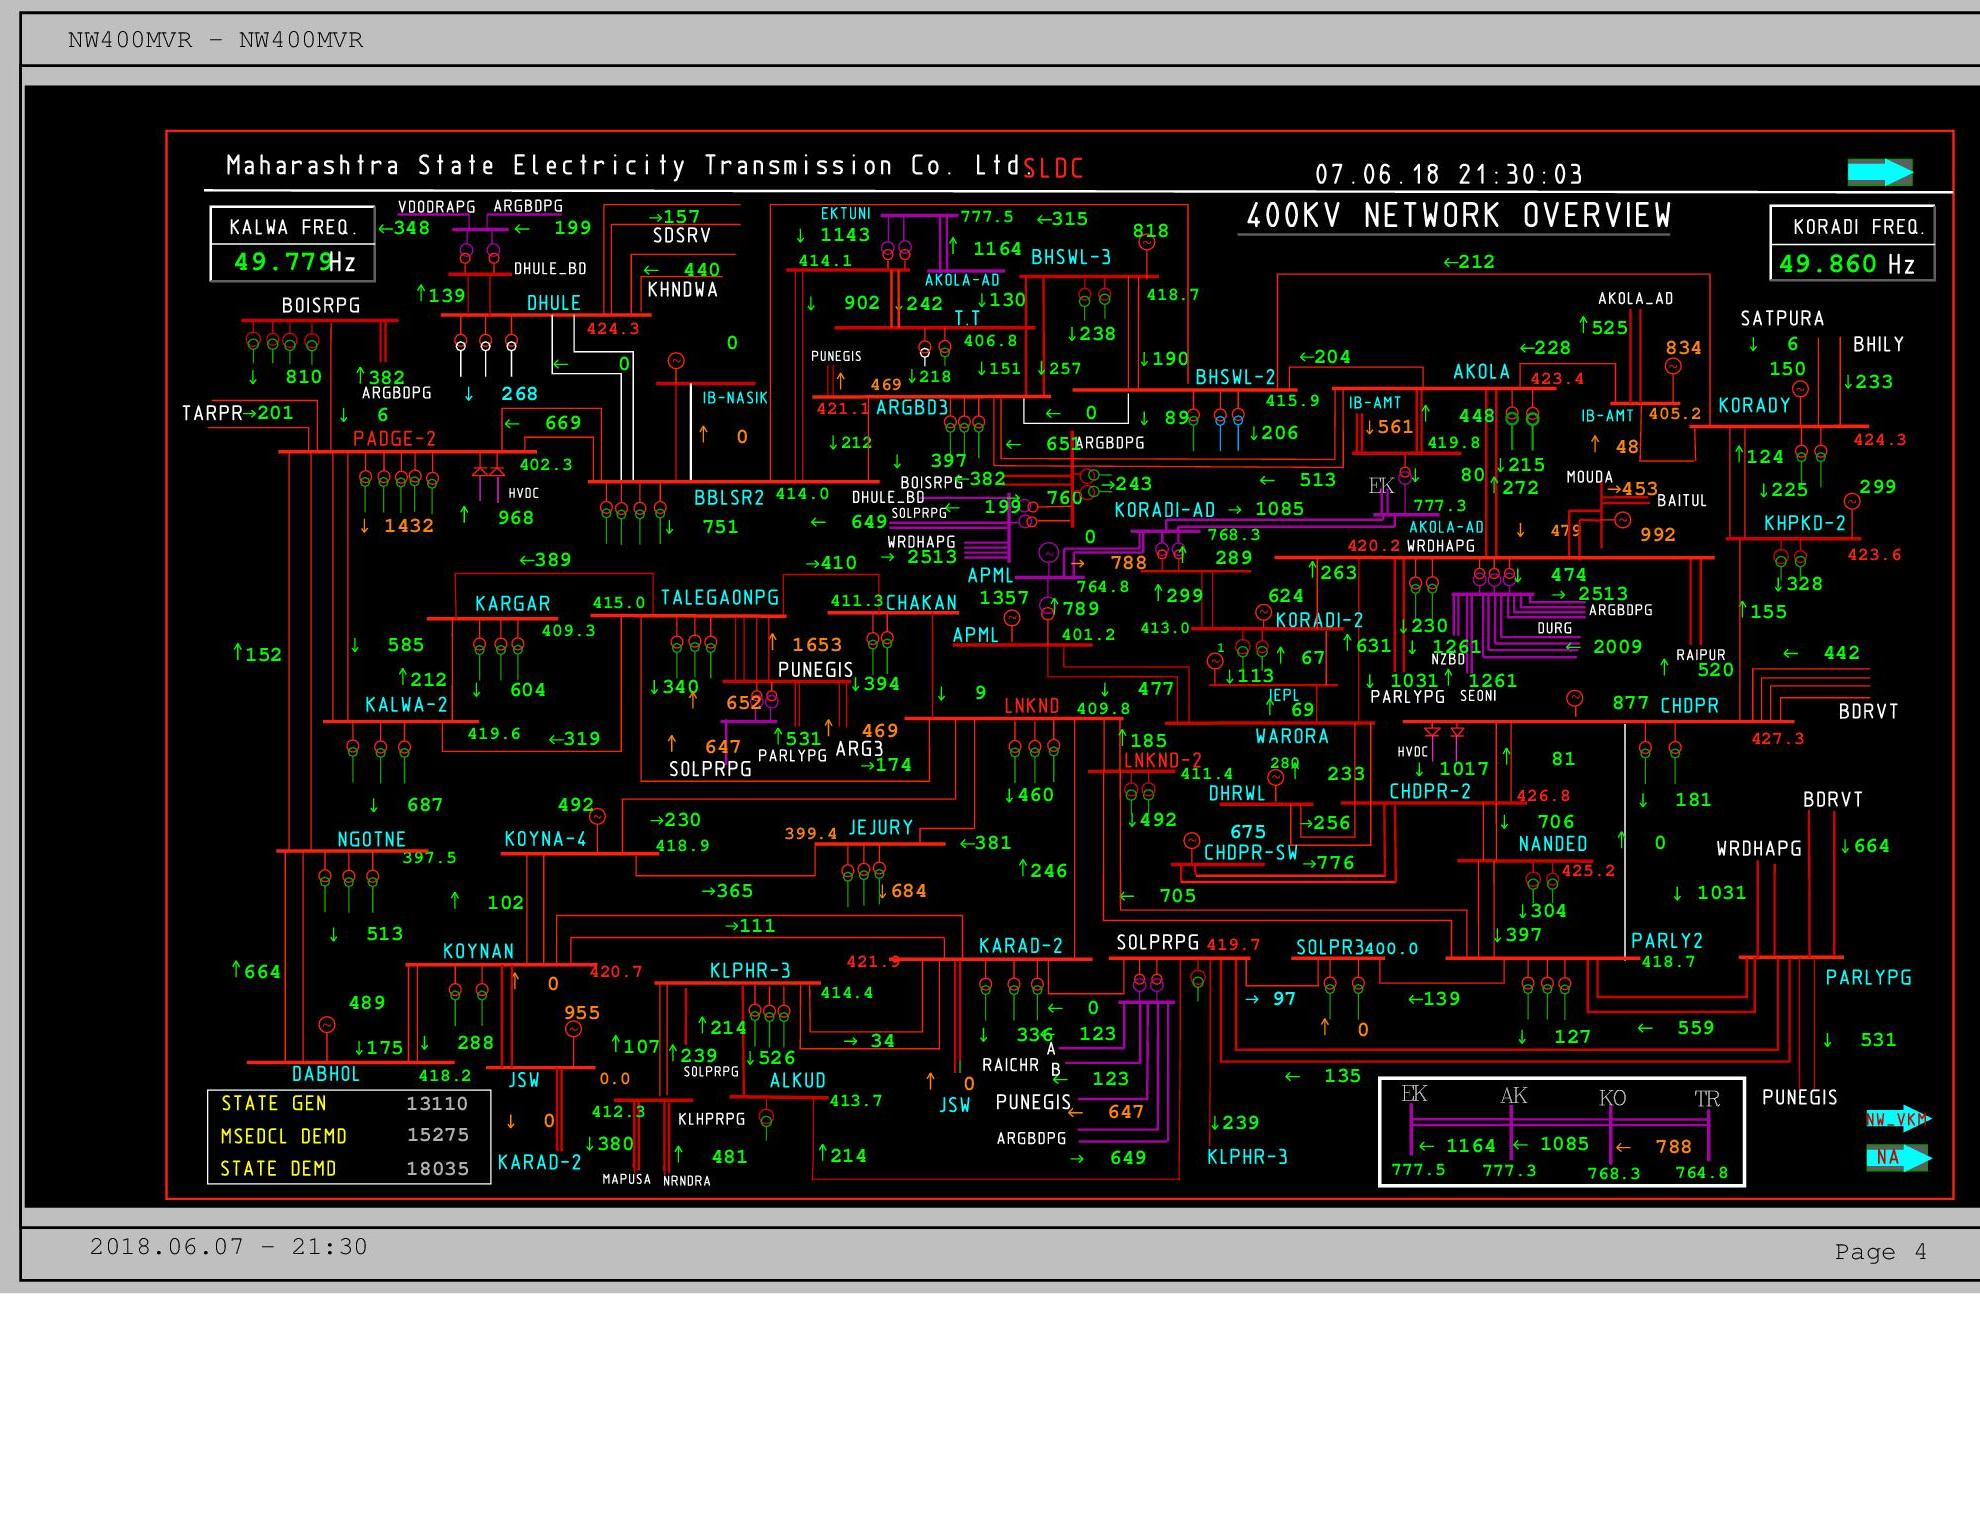
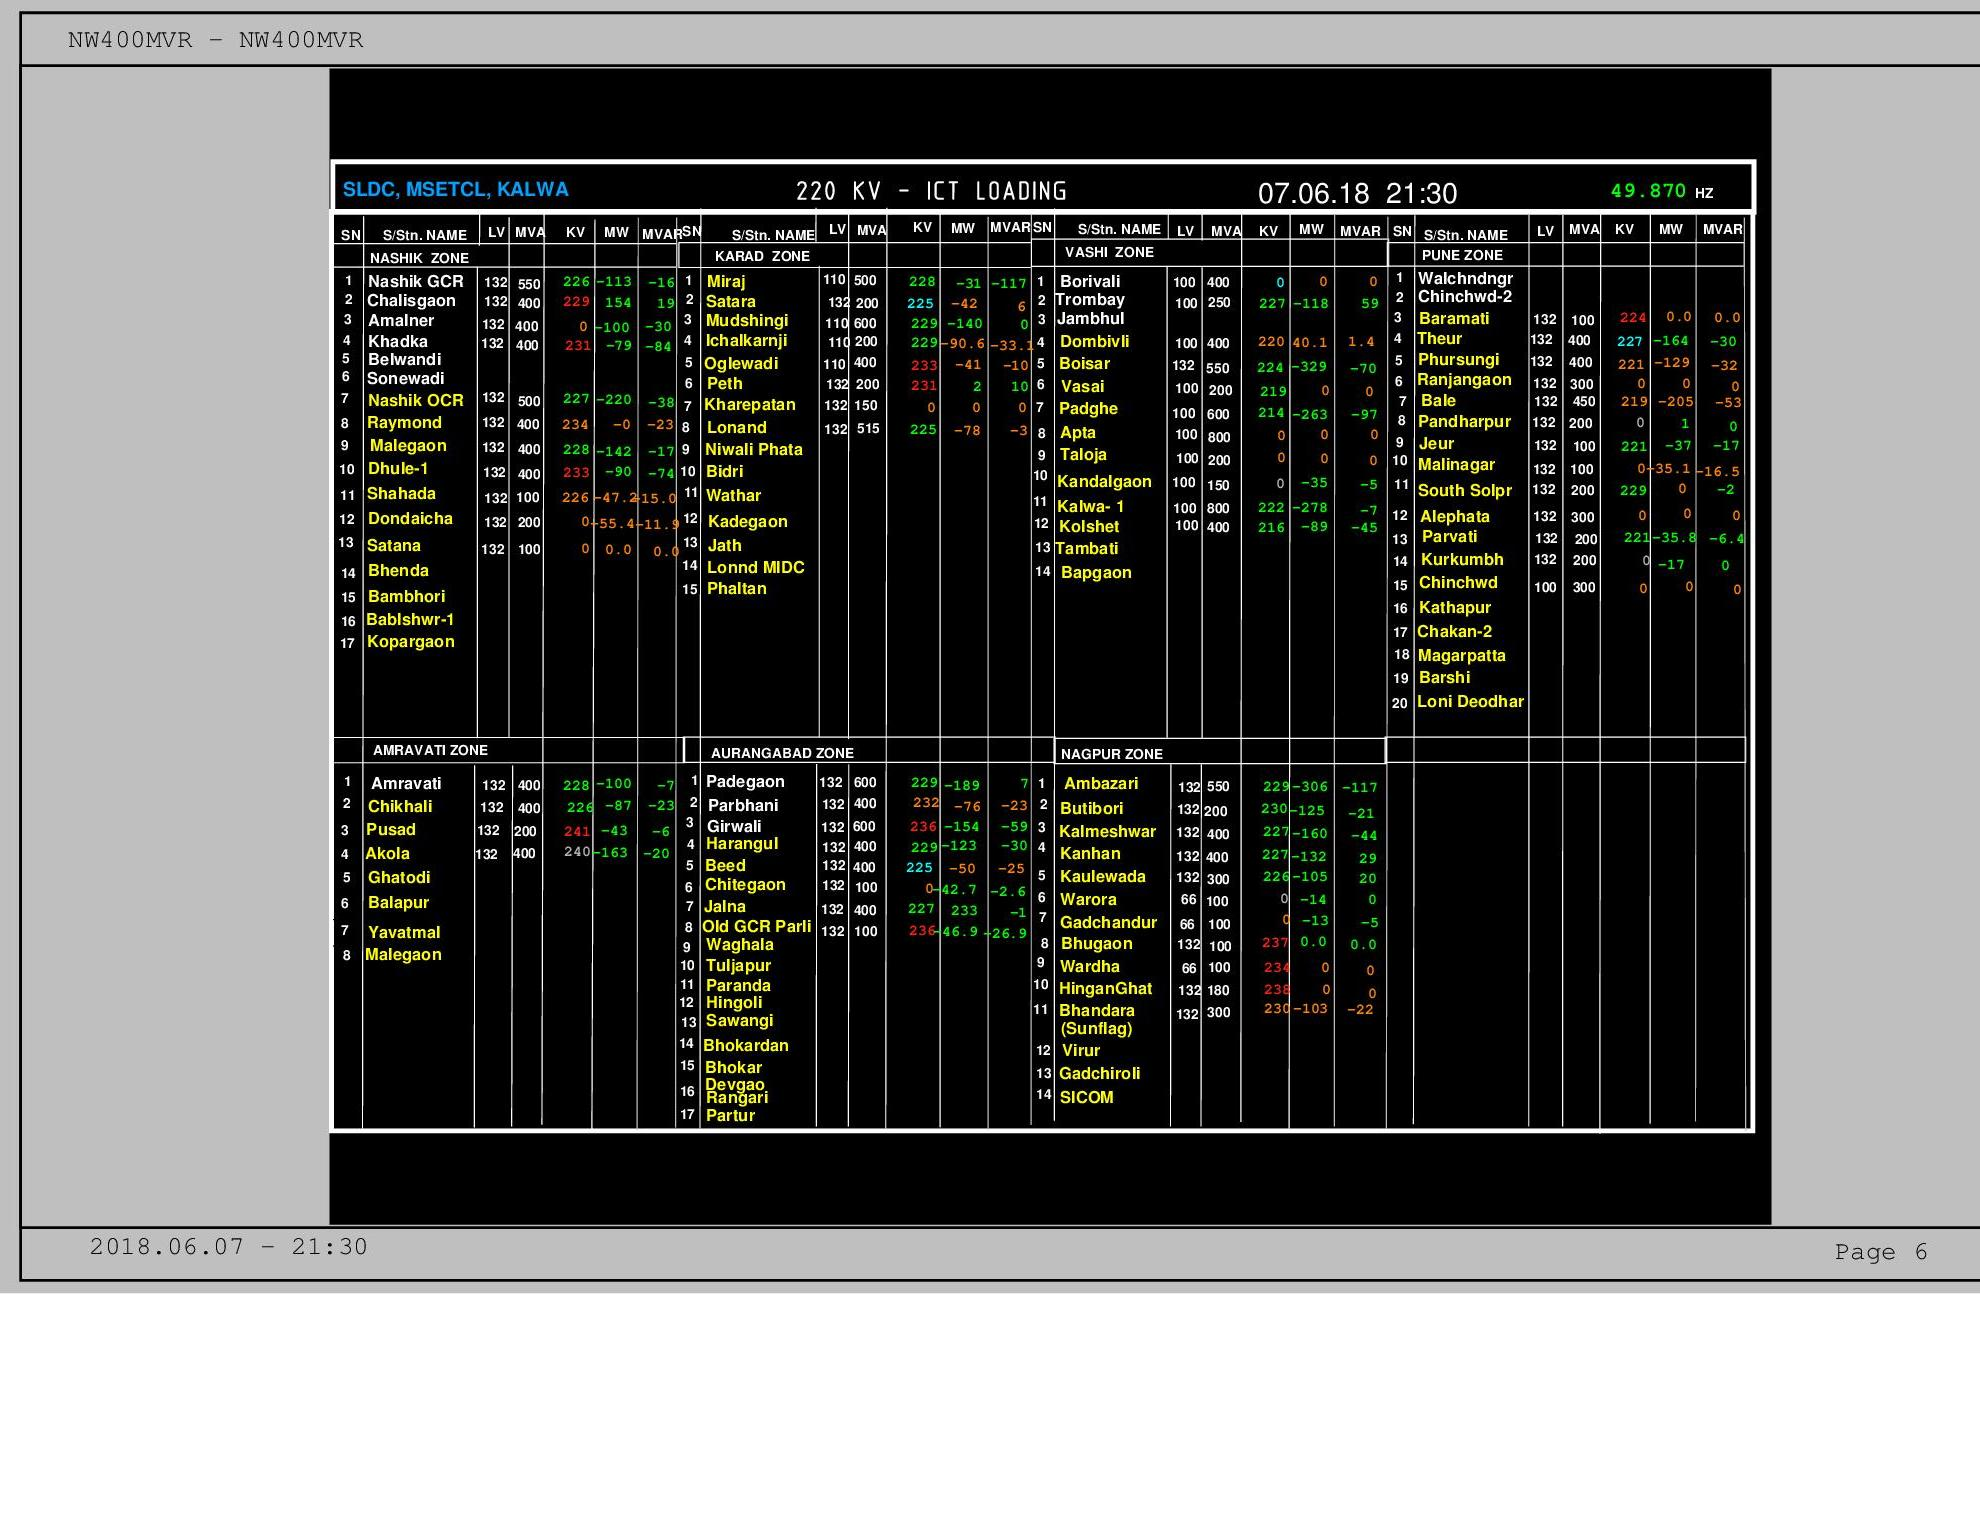
There are some more dashboards with power line schemes and line loadings, but this is wayyyy to complex:
https://mahasldc.in/wp-content/reports/sldc/mvrreport2.jpg
https://mahasldc.in/wp-content/reports/sldc/mvrreport4.jpg
https://mahasldc.in/wp-content/reports/sldc/mvrreport6.jpg
 alixunderplatz
All 11 comments
That's a good challenge!
I ran tesseract on the main image but unsurprisingly got garbage back. We could split the dashboard into multiple images using the pillow module to try and improve OCR performance. Or we could do the same on the smaller thermal/solar/wind images which will be easier to work with.
 systemcatch
on 8 Jun 2018
systemcatch
on 8 Jun 2018
Using Daily Reports one can fetch (previous)day data in PDF. That might help.
 psachin
on 15 Oct 2019
psachin
on 15 Oct 2019
Hi,
I'm new to electricity map but I'm a big fan and I figured to put the knowledge from my recent image processing lecture to good use and build the parser!
You can check out the code here: https://github.com/GitMatze/maharashtra_parser
For now it's just a demo but it seems to work well and reliably.
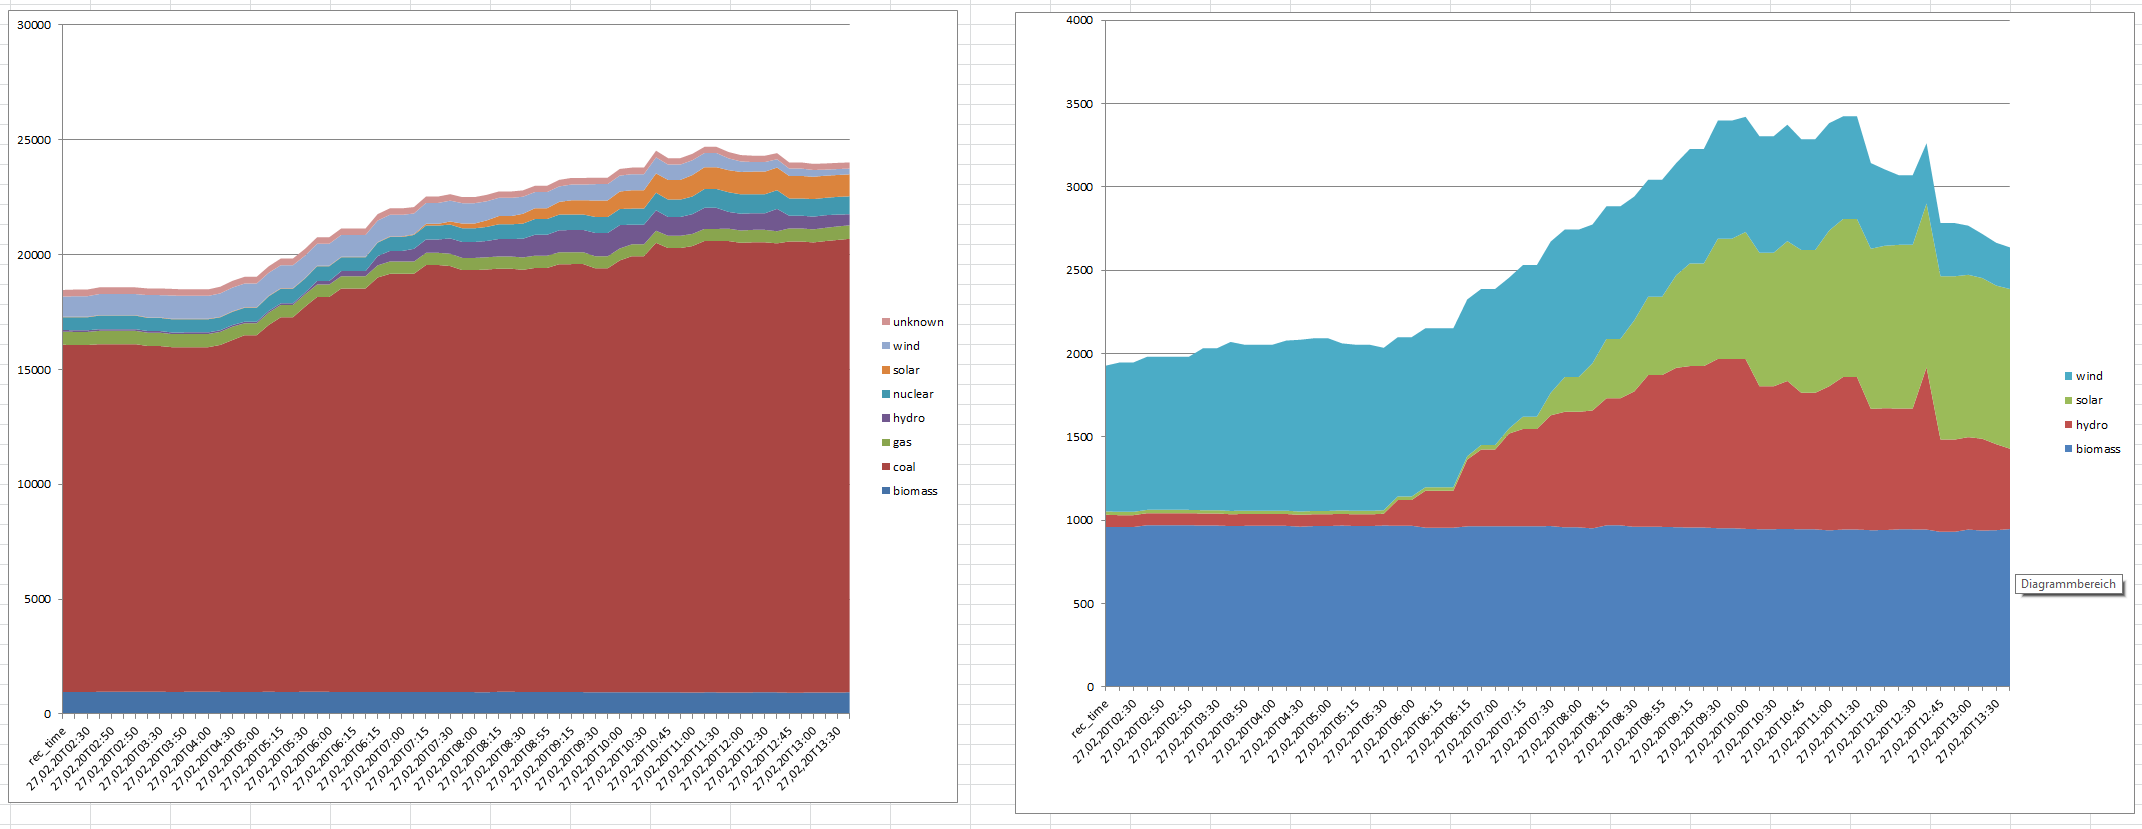
Here's some of the data I've been logging over the last hours:
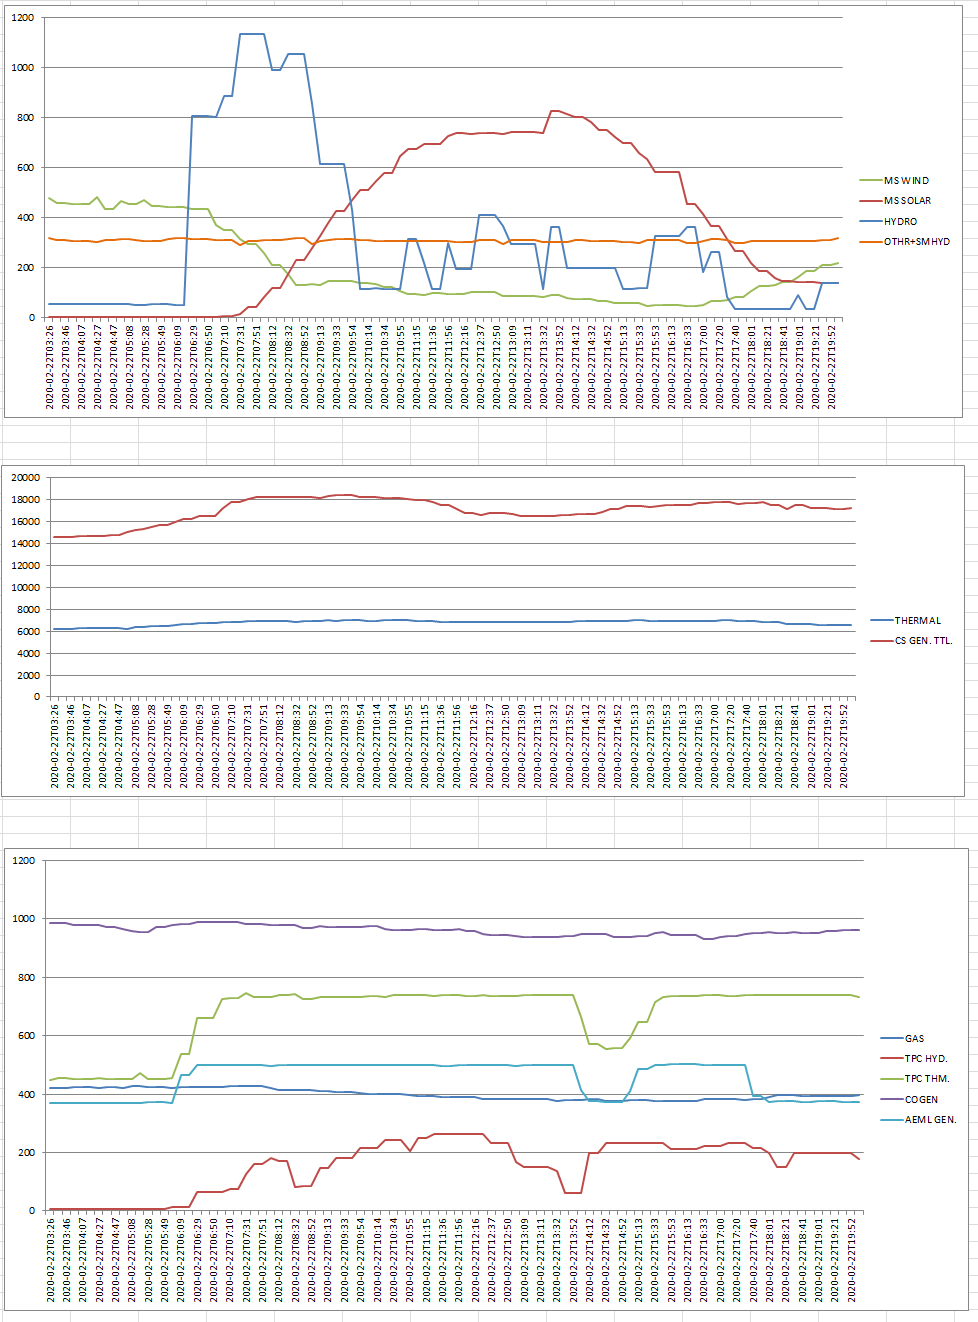
If you can make use of that, I can integrate this into electricityMap. However I would need some further information on how to exactly use all these figures. I figured out how to build the total demand and production sums but the Central State figures in the righmost column remain kind of unclear to me. Since the figure MAH./DRAWL in the upper right table corresponds to CS EXCH in the middle section I suppose that that's the share of the total Central State production that goes into Maharashtra State Demand. To account for that I think we have to calculate the mix of the central state production in order to then break down CS EXCH..? That would mean reading in a lot of numbers though.
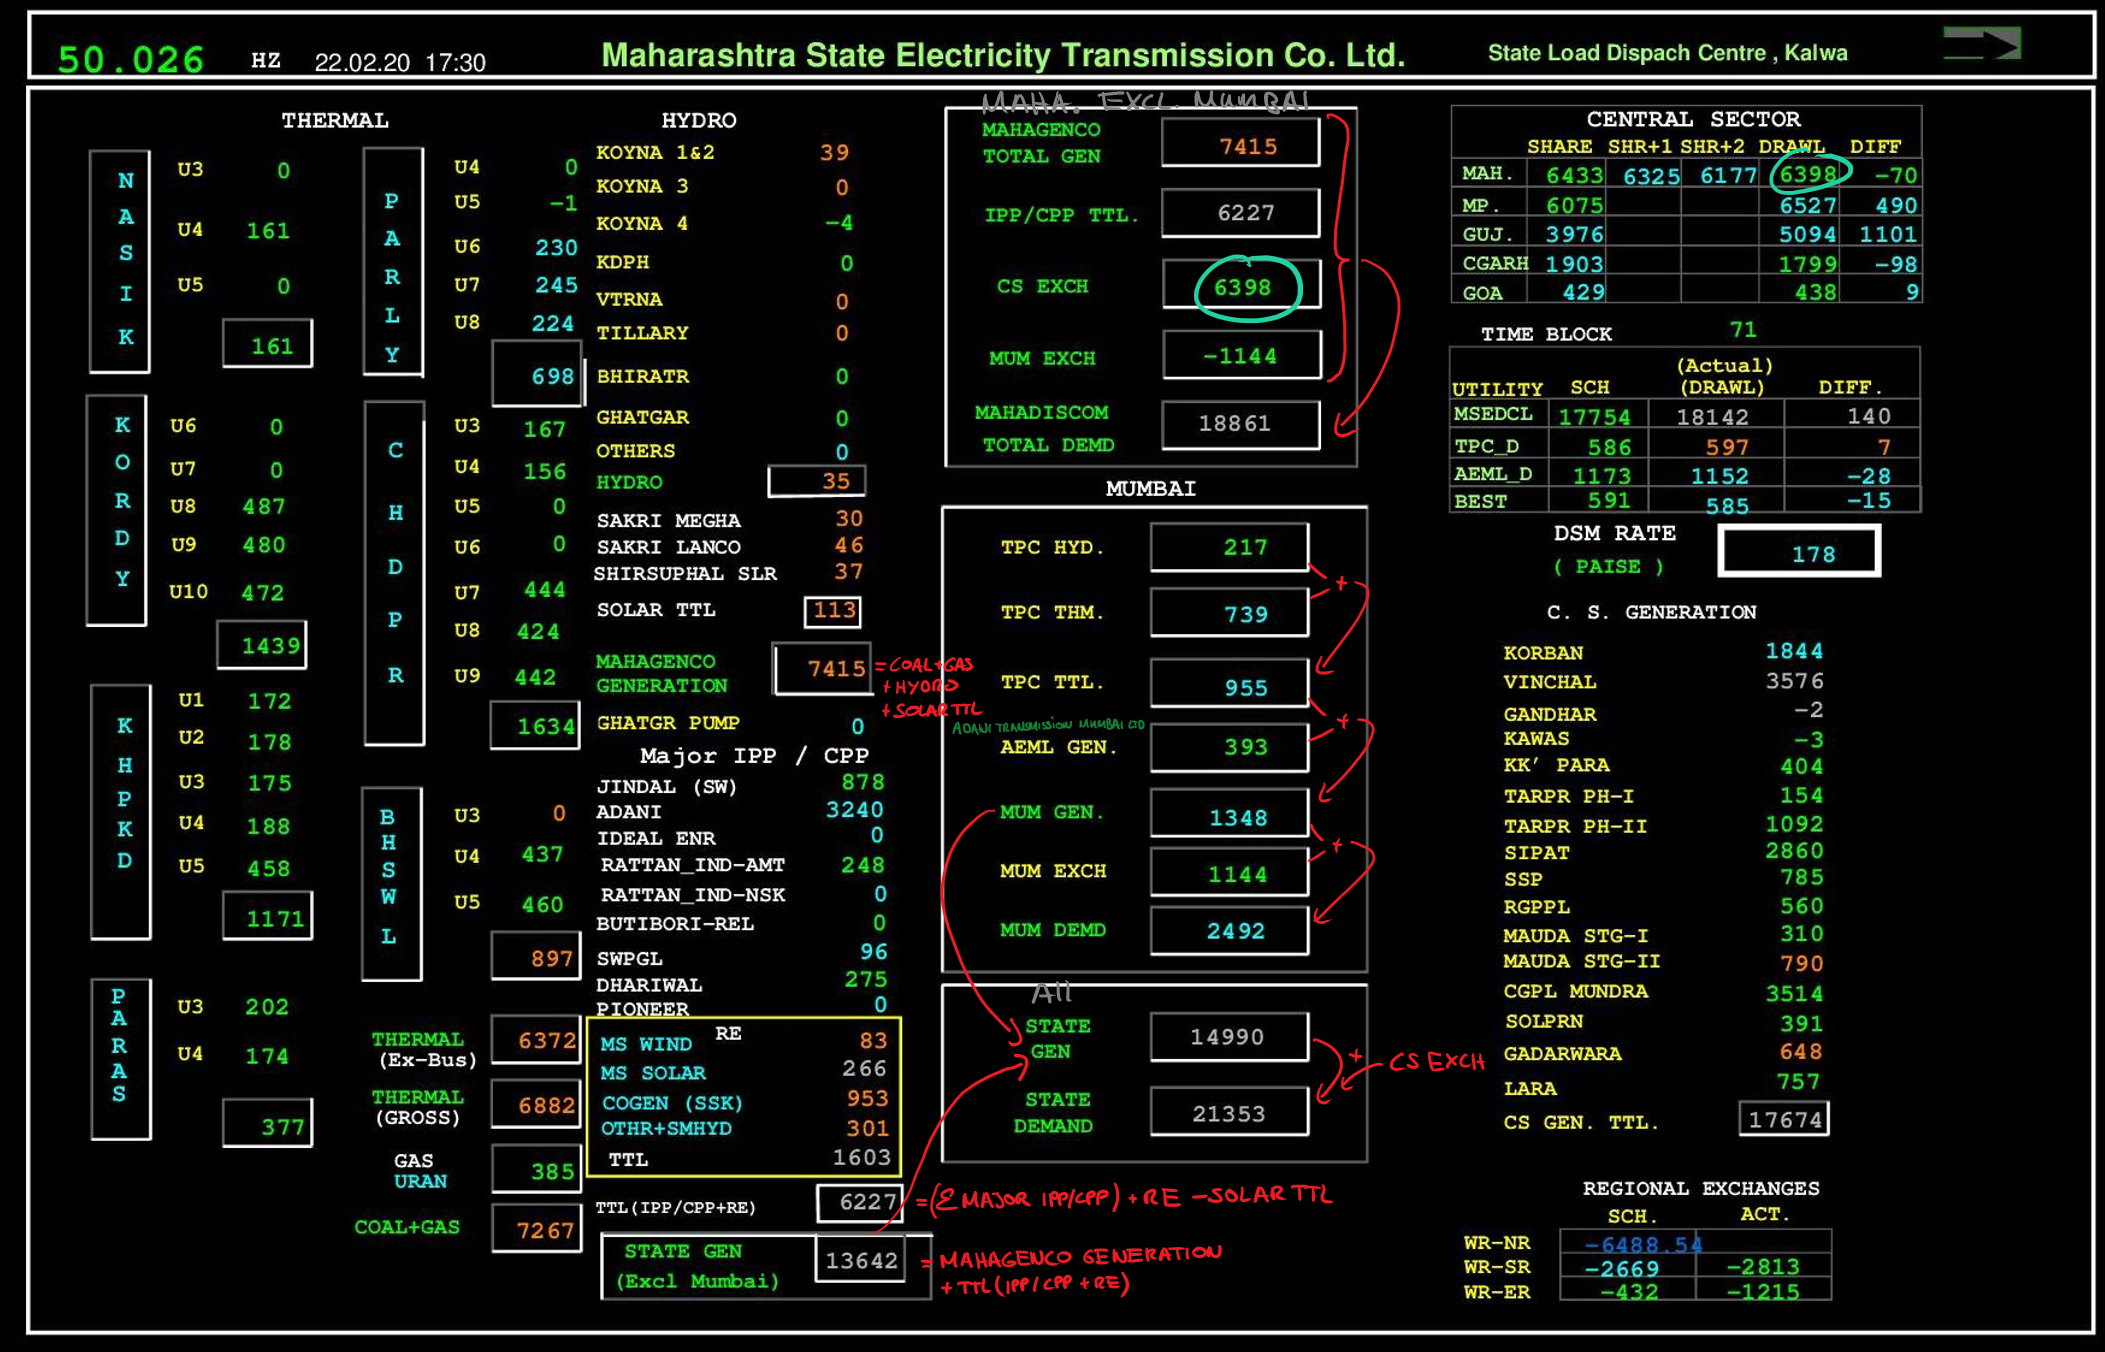
Here are the notes I took to understand the picture, maybe they are helpful:
 GitMatze
on 22 Feb 2020
GitMatze
on 22 Feb 2020
@GitMatze this is just incredible, good job! 👍 👍 👍
The wind/solar/hydro data in your first shows perfect expected behaviour of the renewables.
The conventional fuels look good as well. I'll try to have another look at the dashboard this weekend to make sure what is needed/not needed for the electricityMap.
alixunderplatz
on 22 Feb 2020
Thanks!
I drew a quick overview of what's going on there, at least to my understanding.
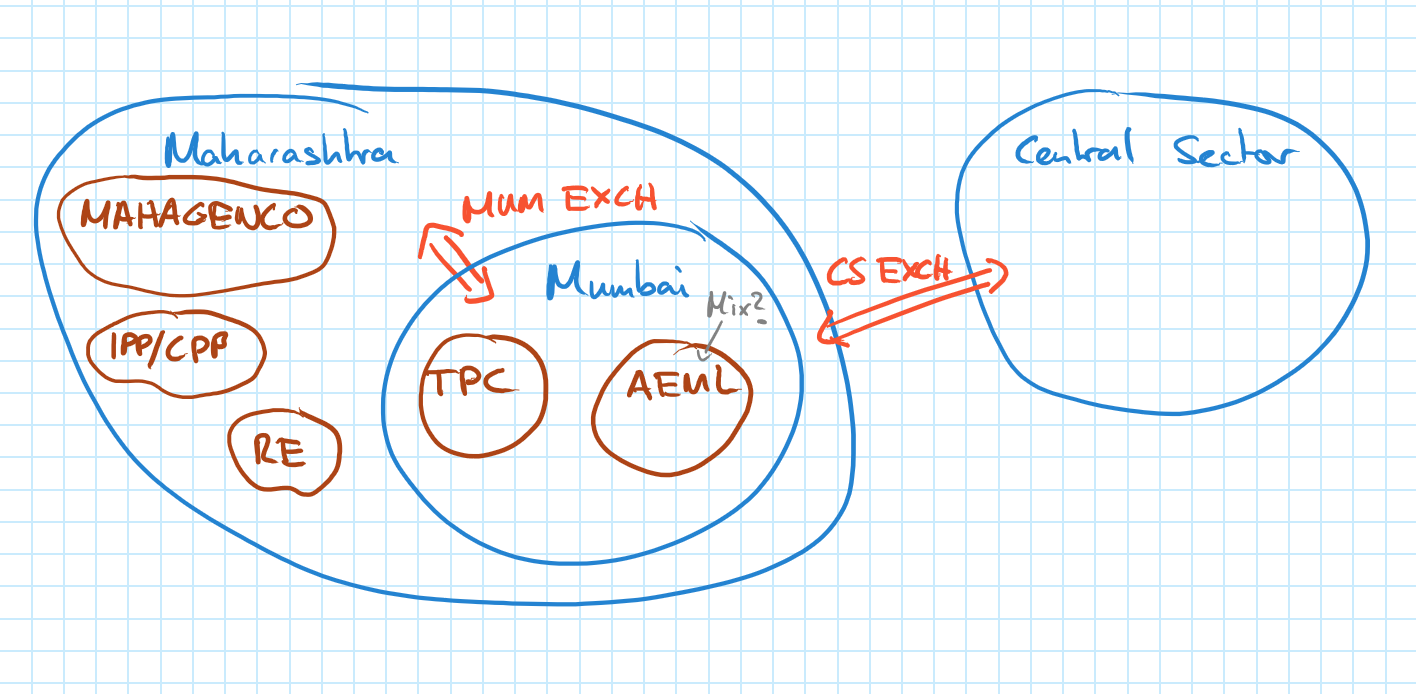
GitMatze
on 22 Feb 2020
Fantastic work @GitMatze!
From looking over your code I don't see a problem adapting it to work with the map.
systemcatch
on 24 Feb 2020
Ok, here's how I would break down the dashboard:
In general:
Total State production STATE GEN is made up of MUM GEN and "STATE GEN (Excl Mumbai)".
Total State demand STATE DEMAND is made up of STATE GEN and CS EXCH
CS EXCH (=Central State Exchange) can be broken down to the power plants on the right.
CS_Share = Share of CS that goes to Maharashtra = ( CS EXCH / CS GEN TTL )
coal = THERMAL(GROSS)
       + CoalFrom(IPP/CPP)
       + CoalFrom(Mumbai)
       + CoalFrom(Total Central State Production) * CS_Share

     = THERMAL(GROSS)
       + TTL(IPP/CPP + RE) - RE TTL - SOLAR TTL - PIONEER
       + TPC THM.
       + (CS GEN TTL - SSP - RGPPL - TARPR PH I+II - KK PARA - GANDHAR) * CS_Share
gas = GAS(URAN) + PIONEER + (GANDHAR + GRPPL) * CS_Share
hydro = HYDRO + TPC HYD + SSP * CS_Share
solar = MS SOLAR
wind = MS WIND
biomass = COGEN(SSK)
nuclear = ( TARPR PH_I + II + KK PARA ) * CS_Share
unknown = AEML GEN. + OTHR+SMHYDR
storage_hydro = CHATGR PUMP #seems to be always 0
All these numbers should add up to the total state demand, so they are easy to validate.
Open questions:
- What about the regional exchanges in the lower right corner? Neither do I know what these regions are nor do I see any connection between these numbers and State Demand/Generation. The only difference between state generation and demand is CS EXCH. Which leads to the next question: There's no state we can attribute the Central State Generation to.
- What is the power mix of AEML (Adani Mumbai Electricity Ltd.)?
Any comments/objections are very much appreciated!
GitMatze
on 25 Feb 2020
I think your breakdown is quite reasonable, the good thing is since we are not implementing any exchanges there is no risk of polluting other zones data. I favour using your breakdown and then iterating quickly as new information becomes available, @alixunderplatz any thoughts?
Regarding AEML here is a list of their power plants (https://en.wikipedia.org/wiki/Adani_Power#Operations). Seeing as it's mostly coal we can assign a default CO2 intensity quite easily.
My guess is the regional exchanges correspond to (East, West, North, South) so I don't think they matter at this level of detail.
systemcatch
on 25 Feb 2020
The parser is ready to be integrated into EM now! I've been testing it for a couple of hours and everything works as expected. To pass validation all energy sources have to add up to the STATE DEMAND as displayed in the dashboard, so there's virtually no chance that incorrect recognitions go undetected.
EDIT: This is not entirely correct. Since coal-based power is derived by _subtracting_ all other sources from sums like CS.GEN.TTL, there are values that cancel each other out when adding all sources up. Misreading them will in fact not be detected.
For the record, here are some of my findings:
- Theres a mistake in the equations above: for coal SOLAR TTL has to be added, not subtracted
- The totals given in the dashboard do not always equal the sums perfectly. Like here:
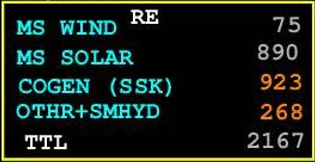
75+890+923+268=2.156 = TTL-11
In these cases the STATE DEMAND no longer corresponds to the demand derived by adding up all energy sources, which means the validation fails. To not be overly restrictive and disregard otherwise flawless readings, I allow a difference of maximum 30 (MW) in the validation. 95% of the times the sums add up perfectly and everything runs super smoothly. - In general there's new data every 15 minutes, however the dashboard on the website is often updated with quite some delay.
I'm not sure how to ingegrate this into EM now:
- In zones.js, how do I know the correct zone key?
- What's this bounding box and where do I find the data?
GitMatze
on 27 Feb 2020
The zone code will be IN-MH (we try to use the iso codes where possible). This will need to be set in https://github.com/tmrowco/electricitymap-contrib/blob/master/config/zones.json
The bounding box for the the state will need to be calculated, I've used Open Street Map before (https://www.openstreetmap.org/#map=4/24.85/91.58) but any other map would work.
If you open a pull request I'm happy to help with any questions you have, I'm away this weekend but should be free after that.
systemcatch
on 28 Feb 2020
Here's some code to debug this parser.
Features:
-logs results to a txt file
-generates and saves a visualization of every OCR task
-saves a copy of the dasboard everytime an error occurs
if __name__ == '__main__':

        import matplotlib.pyplot as plt


    #data =fetch_production(zone_key=None, session=None, target_datetime = None, logger = None)

    #FOR DEBUGGING
    #logs results in a logfile, saves an image of all ocr tasks and saves the dashboard image in case of failure

    file = open('log.txt', 'a')

    # write column names
    for key in locations.keys():
        file.write(key.replace(' ', '_') + ' ')
    for key in generation_map.keys():
        file.write(key + ' ')

    file.write('localtime' + ' ')
    file.write('rec_time' + '\n')


    #read image and save to a logfile
    while (True):
    #for dir in dirs:

        results = {
            'biomass': 0.0,
            'coal': 0.0,
            'gas': 0.0,
            'hydro': 0.0,
            'nuclear': 0.0,
            'solar': 0.0,
            'wind': 0.0,
            'unknown': 0.0}

        image = imread(url)
        image = Image.fromarray(image)  # create PIL image
        #image = Image.open('error.png')

        line = ''
        labels = {}
        values = {}

        localtime = arrow.utcnow().shift(hours=5, minutes=30)
        localtime = localtime.format('YYYY-MM-DDTHH:mm')
        filename_time = localtime.replace(':', ' ')

        plt_num = 1
        fig = plt.figure(figsize=(3,23))
        plt.subplots_adjust(top=0.8, wspace=0.2, hspace=0.3)
        rows = len(locations)
        cols = 2

        #recognize label and value for all items in locations-dict
        for type, locs in locations.items():
            label, l_img = recognize(locs['label'], image, 'eng')
            value, v_img = recognize(locs['value'], image, 'digits_comma')
            labels[type] = label
            values[type] = float(value)

            axes = fig.add_subplot(rows, cols, plt_num)
            axes.get_xaxis().set_visible(False)
            axes.get_yaxis().set_visible(False)
            plt.imshow(l_img)
            plt.title(label)
            plt_num = plt_num + 1

            axes = fig.add_subplot(rows, cols, plt_num)
            axes.get_xaxis().set_visible(False)
            axes.get_yaxis().set_visible(False)
            plt.imshow(v_img)
            plt.title(value)
            plt_num = plt_num + 1

        share = values['CS EXCH'] / values['CS GEN. TTL.']
        for type, plants in generation_map.items():
            for plant in plants['add']:
                fac = share if plant in CS else 1  # add only a fraction of central state plant production
                results[type] += fac * values[plant]
            for plant in plants['subtract']:
                fac = share if plant in CS else 1
                results[type] -= fac * values[plant]

        #create line for log.txt
        #compare recognized label with name in locations dict to detect errors
        for key in locations.keys():
            line = line+str(values[key])+ ' '
            if not areEqual( labels[key], key ):
                image.save('error_'+filename_time+'.png')
                print('Error: ' + labels[key] + ', ' +key)

        demand_diff = sum(results.values()) - values['DEMAND']
        if (abs(demand_diff) > 5):
            image.save('error_' + filename_time + '.png')
            print('Error: Demand Difference = {}'.format(demand_diff))


        for value in results.values():
            line = line + str(value) + ' '

        #read daytime from image
        rec_time, img = recognize( (355,110,524,150), image, 'eng')
        rec_time = rec_time.replace(' ', 'T')


        line = line + localtime +' '
        line = line + rec_time
        file.write(line+'\n')
        print(line)
        #print(results)
        plt.savefig('figures/' + filename_time + '.png')
        #plt.show()
        time.sleep(60*10)
        plt.close()

    file.close()
Related issues
systemcatch
·
3Comments
 corradio
·
4Comments
corradio
·
4Comments
corradio
·
4Comments
alixunderplatz
·
3Comments
corradio
·
4Comments
corradio
·
4Comments
corradio
·
4Comments
alixunderplatz
·
3Comments
Most helpful comment
Hi,
I'm new to electricity map but I'm a big fan and I figured to put the knowledge from my recent image processing lecture to good use and build the parser!
You can check out the code here: https://github.com/GitMatze/maharashtra_parser
For now it's just a demo but it seems to work well and reliably.
Here's some of the data I've been logging over the last hours:
If you can make use of that, I can integrate this into electricityMap. However I would need some further information on how to exactly use all these figures. I figured out how to build the total demand and production sums but the Central State figures in the righmost column remain kind of unclear to me. Since the figure MAH./DRAWL in the upper right table corresponds to CS EXCH in the middle section I suppose that that's the share of the total Central State production that goes into Maharashtra State Demand. To account for that I think we have to calculate the mix of the central state production in order to then break down CS EXCH..? That would mean reading in a lot of numbers though.
Here are the notes I took to understand the picture, maybe they are helpful:
