Electricitymap-contrib: Add static carbon intensity for NL exports
 corradio
All 7 comments
Talked to Dr. Martien Visser from Entrance (cc @alixunderplatz)
To make it easy: the number for the last 12 months (April 2017 - March 2018) is 437 gr/kWh.
I think that's a number we can use!
corradio
on 3 Apr 2018
@corradio I still have some concerns about spoiling the export intensity. NL is kind of different from the other areas where a hardcoded intensity is used. These zones had a more "predictable", "not-so-diversified" or "fluctuating-RES" generation portfolio.
Opposed to this, The Netherlands
- have a considerable amount of fluctuating solar and especially wind
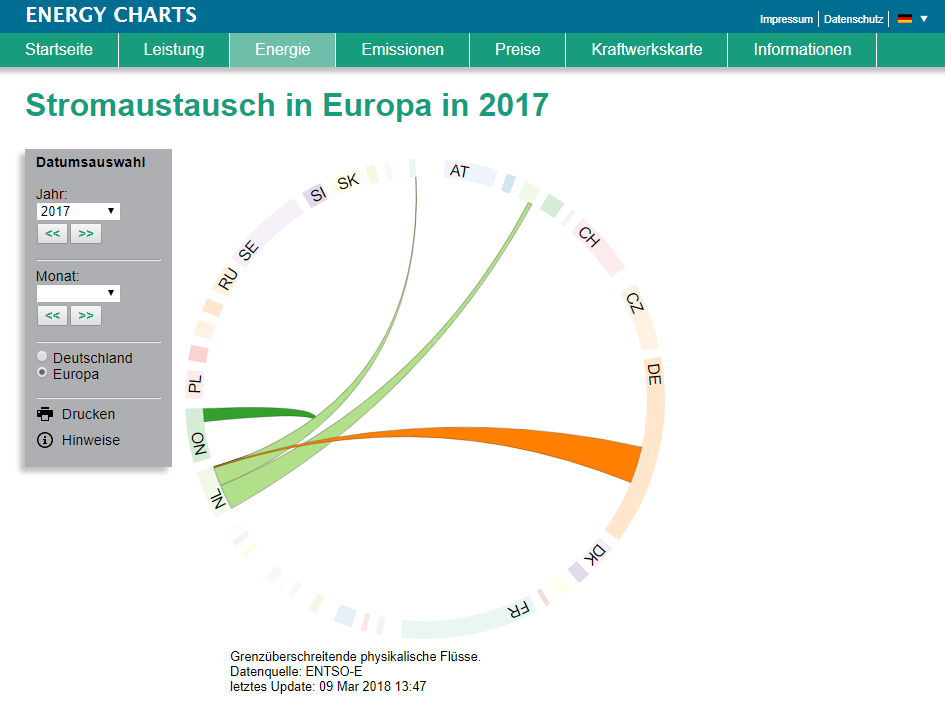
- recieve & transport a large amount of power. In 2017:
- the physical imports from DE were 14.2 TWh, while exports to DE only were 0.42 TWh
- the physical imports from NO were 5 TWH, while exports to NO only were 0.11 TWh
- DE and NO are sources for the NL mix. NO's intensity is almost static, DE is fluctuating heavily.
- the physical imports from BE only were 1.6 TWh, while exports to BE were 9.6 TWh
- the physical imports from GB only were 0.19 TWh, while exports to GB were 7.2 TWh
- BE and GB are recievers of power from the NL mix
Yearly numbers for physical power flows are from energy-charts, who take them from ENTSO-E.
Does the static value of 437 g/kWh include imports from NO and DE, or is it for the domestic generation only? Right now, about 4 GW come in from DE, which makes up 20-25% of the electricity mix of NL. Even if this is just a temporary solution, I am wondering how strong the carbon intensity will deviate from the static figure. It will have a limited influence on GB's intensity, because transmission capacity is limited to 1 GW. However, for for BE, where one could also observe exports from NL of around 3 GW over longer periods, it will have some significant influence on the mix and carbon intensity.
 alixunderplatz
on 4 Apr 2018
alixunderplatz
on 4 Apr 2018
It's domestic generation only, so indeed it is a very crude approximation. You are totally right.
How do you suggest we proceed? Correct it with the average flows and the intensities of neighbours?
corradio
on 4 Apr 2018
That's really a tough question.
The only thing that seems possible at the moment is combining total generation from TenneT (even though it is not always reliably available) with the static intensity and putting it to the "unknown" category. This way, at least the imports would have their influence on the average domestic carbon intensity. If it's possible, I suggest leaving NL in grey and only consider this "synthetic mix" for the export intensity.
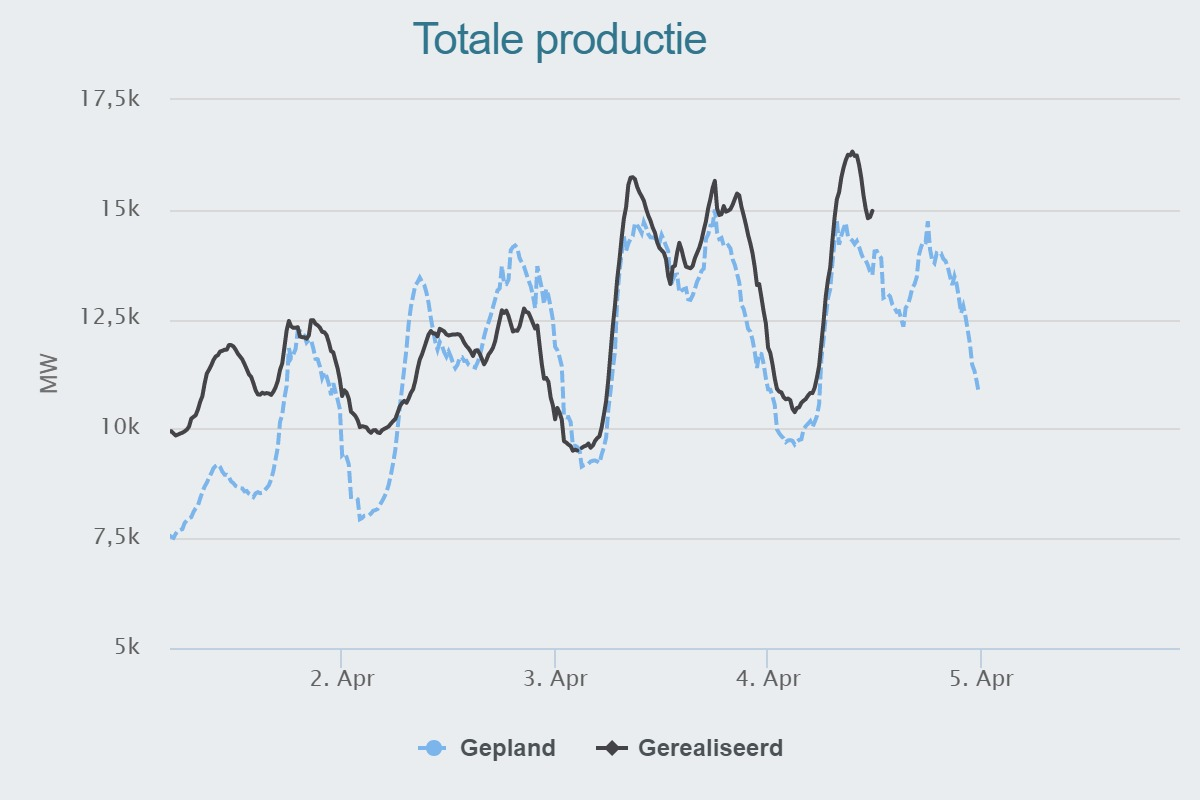
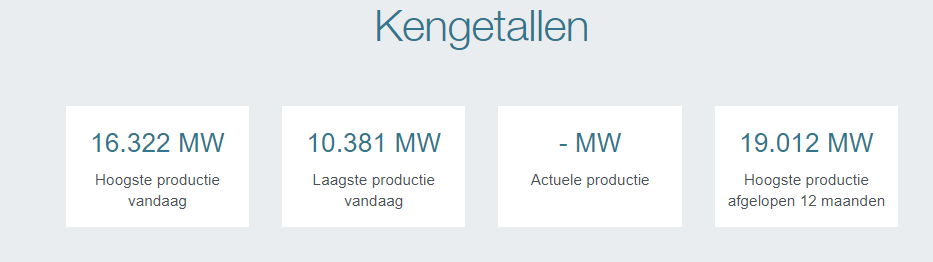
Unfortunately, the recent generation is displayed as "-" at the moment. Maybe that's a temporary issue.
alixunderplatz
on 4 Apr 2018
Actually you don't have to put it all under "unknown" because renewables production is available from:
http://energieopwek.nl
Separated in biomass, wind and solar.
 PaulCornelissen
on 4 Apr 2018
PaulCornelissen
on 4 Apr 2018
@PaulCornelissen yeah, that site had also been mentioned in the main issue #78.
As far as I can recall, these figures are estimates and would "spoil" the mix with the static carbon intensity in return, because they are already included in that static value that is mentioned above.
In addition, in the biogas category, they only seem to consider generation from biogas and not from other biomass like wood chips (I think there were projects to use wood chips as fuel in coal power plants, similar to Denmark?!) or waste.
alixunderplatz
on 4 Apr 2018
A more detailed answer from Dr. Visser on the (April 2017 - March 2018) annual NL average production (MWh) is:
30% coal, 20% cogeneration (gas) and 28% gas-fired, renewables (14%), coke-oven gas (5%), nuclear (4%).
We shall be able to compute our own carbon-intensity for an "unknown" category which would include coal, cogen, gas, coke and nuclear. And use biomass, wind and solar from Tennet. Let's try!
 brunolajoie
on 5 Apr 2018
brunolajoie
on 5 Apr 2018
Related issues
 jzlcdh
·
5Comments
corradio
·
5Comments
jzlcdh
·
5Comments
corradio
·
5Comments
 pascalheraud
·
4Comments
pascalheraud
·
4Comments
 systemcatch
·
4Comments
alixunderplatz
·
3Comments
systemcatch
·
4Comments
alixunderplatz
·
3Comments
Most helpful comment
Talked to Dr. Martien Visser from Entrance (cc @alixunderplatz)
I think that's a number we can use!