Electricitymap-contrib: Total current power consumption (GW) info on top level
First: excellent piece of Software, I like it.
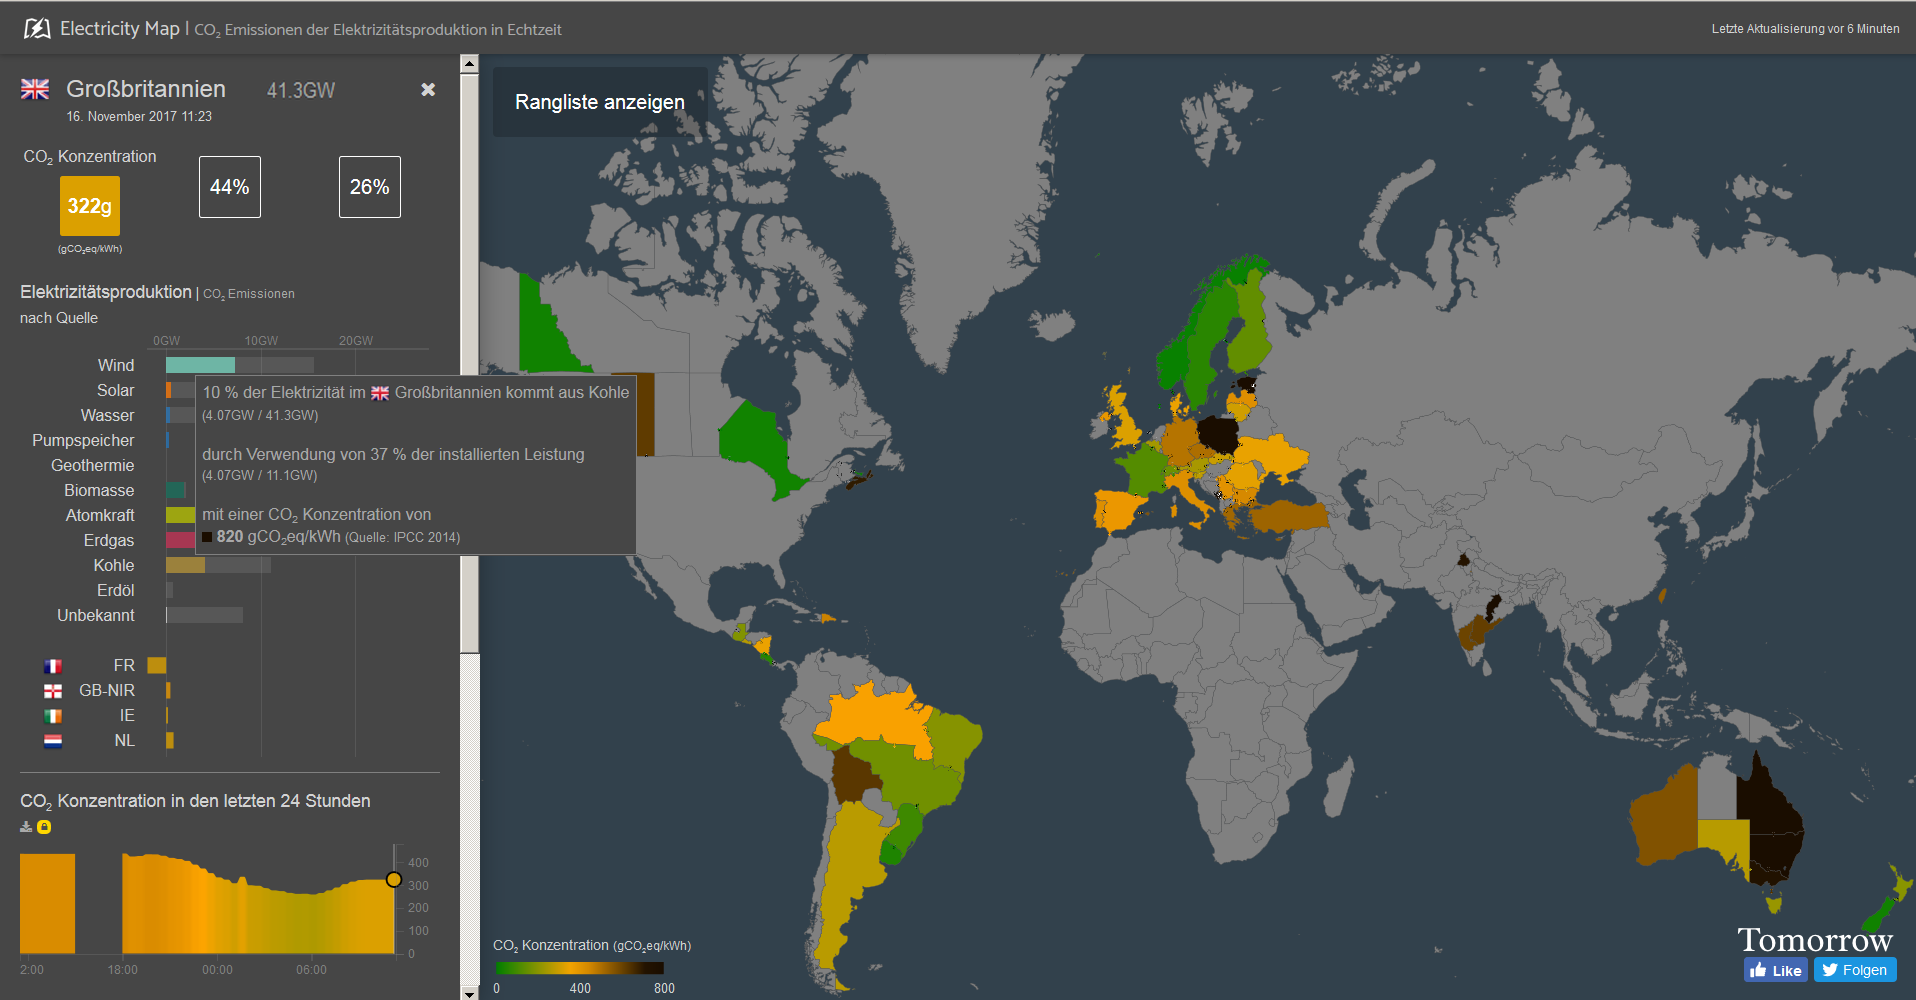
Second: I am curious, if you like to plot the total power consumption, which is available in the "hoover info" also in the country specific window on the left, maybe directly behind the country name?
Another good place can be also close to the headline "Power production".
Thank you!
 Bolero-8
All 7 comments
Hi @Bolero-8,
Thanks for your request. I am curious about your use case. What is your interest in this figure? What are you looking to learn?
And to point out just in case you haven't seen it: when you scroll down in the left pane, you will see a chart of the region's total generation over last 24 hours.
My concern would be that the total generation number is not really meaningful -- it is, to a significant degree, a product of region population, and we have regions widely varying in population.
 jarek
on 17 Nov 2017
jarek
on 17 Nov 2017
I like the idea of seeing total current power production, both on a country by country basis, but also a global total (e.g. How much power is the entire planet generating right now?).
@jarek I don't have a particular use case for this data, I just think it would be quite interesting.
 nathanjmassey
on 29 Nov 2017
nathanjmassey
on 29 Nov 2017
Thanks for your reply, Jarek. To answer your question: the only interest for this figure is to get a more simpler access to this number. Its already calculated and available as you mentioned either in the "fly-over" windows or at the bottom in the left pane. I would found it just helpful to see this info immediately with no further user activity.
What you also mentioned, is an interesting info too - normalizing the consumed power toward a number per person...., but this may be a lengthy discussion and may not be a topic of this thread.
Bolero-8
on 30 Nov 2017
Hello @Bolero-8 & @jarek
I was thinking along similar lines suggesting current aggregated country/state generation (not the same as current load - as most systems run in the neighborhood of 10% reserve above load) be added in GW (###.### GW). In contrast to within the country subpage, if possible I think adding it to the map itself for each country would be the best location.
The carbon intensity color coding adds 1 part of the puzzle instantly, the current generation would add more relevance & context on initial view. For example, Estonia running at 1000+ gCO2eq/kWhr looks really bad... but at only ~1 GW of capacity, in perspective it is equal to 3GW in Germany running at 333 gCO2eq/kWHr.
Then if someone wants to drill down to see the generation mix, they can do that. But with CO2 color & current generation per country, an user can quickly do some back of the napkin calculations as to how a region (ie the EU) is performing.
 HansHyde
on 11 Dec 2017
HansHyde
on 11 Dec 2017
Personally I am not a fan of that. Showing absolute numbers mostly just shows which region is less populated. Estonia is currently running around 1.5 GW to Germany's 77 GW, that's true, but Germany also has 62 times more people, so they're actually using less MW per capita.
Not to mention higher electricity use is not necessarily problematic. If a region uses gas-generated electricity to run trains or trolleybuses, that's probably preferable to running transport on diesel - which doesn't show up in Electricity Map at all.
In the end, I think absolute numbers just don't say that much. The original idea of Electricity Map was "when should I charge my electric car?" or "how much emissions will I cause turning on this lamp right now?" and hence the focus on current emissions per kWh - it's probably the metric that is most comparable between regions
(Personal opinion, not the project's)
jarek
on 11 Dec 2017
@jarek Understood... and I'm looking at EM from a much different angle. I have already seen EM's historic data used as evidence of the "failure" of Germany's Energiewende in an extensive report shared widely to decision makers. Whether Germany is a "failure" or not is open to interpretation, and frequently cherrypicking of data, but it just shows that EM has already moved beyond "when to charge an EV". Which says a lot already! :)
HansHyde
on 11 Dec 2017
I agree with @jarek . I'm closing this issue as I think the UI will be too cluttered if we start adding too many numbers.
If anything, we should try to make the map accessible to more non-exports (and not complexify)
 corradio
on 11 Dec 2017
corradio
on 11 Dec 2017
Related issues
 ghost
·
5Comments
ghost
·
5Comments
 alixunderplatz
·
4Comments
corradio
·
4Comments
alixunderplatz
·
4Comments
corradio
·
4Comments
 jzlcdh
·
5Comments
corradio
·
4Comments
jzlcdh
·
5Comments
corradio
·
4Comments