Electricitymap-contrib: Refine GHG emission factors by regions
The aim of this issue is to discuss the possibility/find peer reviewed studies of a standardized approach to refinie LifeCycle GHG-intensity factors of the various power plant category per geographical zone (country, zone, region...). We don't want to re-invent the wheel, and would rather use an external, trustable analysis that uses the same assumption between all country covered.
[Dec 2019 update]
We (electricitymap team and other) have published a peer reviewed paper called "Real-time carbon accounting method for the European electricity markets" free donwload here that contains in Table 1 of appendix an interesting list of GHG emission factors, LCA based, computed for each EU country.

Other interesting leads include
- the following See & download data: Read sci paper:
- http://www.reliable-disclosure.org/upload/259-D5.2_Best_Practice_Environmental_Data.pdf
- https://link.springer.com/article/10.1007/s11367-013-0665-2
- http://iopscience.iop.org/article/10.1088/1748-9326/aa6047
- http://www.sciencedirect.com/science/article/pii/S1364032117304215
 brunolajoie
All 56 comments
Hi @brunolajoie, great that you mention further refining of the GHG factors and the potential addition of other indicators.
I'm a co-author of the paper you refer to, and I would be glad to provide the underlying data for the various technologies we considered. We published two more papers containing such data, to extend the range of technologies and indicators.
To complete your suggestions, we can indeed:
Refine the factors per region, based on how efficient technologies are (based on local characteristics that alter the load factors, such as insolation and wind),
Refine the emissions factor based on the technologies used in various regions (we can use ecoinvent data, which has become very spatially-explicit in its latest version, the data team did the work of associating technologies with regions),
For me, the most interesting would be to add further indicators (land use and material requirements come as obvious ones because they are potential trade-offs of the energy transition). There is an issue of introducing high uncertainty for certain indicators (namely, for toxicity) but indicators of direct emissions like particulate matter and smog emissions could be added.
 thomasgibon
on 22 Nov 2017
thomasgibon
on 22 Nov 2017
Thanks a lot! let me have at it more closely! I'm posting a study here so we don't forget it, which gives a breakdown at the country level for Europe. http://www.reliable-disclosure.org/upload/259-D5.2_Best_Practice_Environmental_Data.pdf
brunolajoie
on 24 Nov 2017
Perfect, I think the ecoinvent data reported in this paper is excellent for the electricity map. The paper detailing the update of electricity inventories in the latest ecoinvent database is a good read: https://link.springer.com/article/10.1007/s11367-013-0665-2
I've had some thoughts on what can be achieved with the app. There are two main reasons why factors change across regions/grids:
- _Intrinsic factors._ For the baseload technologies (fossil, nuclear, biomass, hydro), the variation across regions is a matter of technology differences, load factors and efficiencies -> factors can be directly applied from the paper.
- _Extrinsic factors._ For the intermittent technologies (principally solar and wind), the LCA results _per kWh_ are derived from the total impacts of a power plant construction, maintenance and decommissioning, divided by the plant's lifetime production, in kWh. To cite the ecoinvent paper:
Annual wind load hours of wind turbines and annual yields of photovoltaic plants are key factors for the environmental life cycle burdens of wind and solar power
...which is precisely the kind of data that the app fetches with a high resolution. After collecting data over a year, the app could eventually provide yield (load factor) data that is more accurate than the one used by ecoinvent to calculate solar & wind GHG emissions per kWh. It's probably not for now, but I would be interested in knowing whether the load factors assumed in ecoinvent and those from the app align.
And if you want more than GHG data, the full range of environmental impacts from the ReCiPe2016 can be calculated easily for each technology/region, see Table 1.1 here: http://www.rivm.nl/bibliotheek/rapporten/2016-0104.pdf
thomasgibon
on 24 Nov 2017
@corradio - thanks for providing this link
https://github.com/tmrowco/electricitymap/blob/master/config/co2eq_parameters.js
Oli,
There are multiple "issues" discussing the need for refinements, within Regions/Countries & within the Fuel Type definitions themselves, by the same people who are concerned to the extent co2eq are being compiled/accounted for incorrectly.
@amaurea, @brunolajoie, @alixunderplatz, @ThierryOllivero, @superlonglong, @kristianmadsen88, @KetsOne, @ovotom, @7hibault, @systemcatch
915 - My thinking before reading through... co2eq_parameters.js is exactly how the backend is built.
162 - same discussion subject
196 - similar but from a different perspective (sub region calculations)
393 - same discussion subject
480 - same discussion subject
484 - similar discussion subject
787 - similar discussion occurring here too
There are likely others...
Additions of "sub"Fuel Types, i.e. Gas1, Gas2, etc., definitions with appropriate values appears very straight forward, and without a major overhaul of the system.
When the Region/Country parser is built, then the appropriate Fuel Type(s) would be included. Or as more information is gathered (updating our understanding of a Region/Countries), it could be adjusted accordingly. If we know Country X has no Gas2, Coal3, Nuclear, Pumped Storage, etc., it would not be included in the Gen Mix charts.
_As I commented in #general on Slack yesterday, EM's numbers are being used in extensive academic report/paper generation distributed to thought leaders & decision makers around the world._ To say the report referenced has enough followers who regularly engage in _Astroturfing_ to discredit IPCC & the UN would be an understatement, hence strictly adhering to IPCC charts of average co2eq/kWhr is a bit ironic.
Now that I know EM backend is reporting an "average" value for Coal in Germany, when it is known Germany reports specifically 2 different types & their generation realtime, I have only one choice --> I must discount any report using data from a flawed methodology
Can you close the above "Issues" threads now that they and their contributors are all linked, and we can work towards addressing this common problem in one place?
The amount of effort required to correct this appears to be quite small & straight forward, while the improvement in data quality will be quite substantial.
If there are backend reasons for your aversion to adding more Fuel Type definitions, maybe you could list those briefly???
 HansHyde
on 15 Dec 2017
HansHyde
on 15 Dec 2017
Hello @thomasgibon, sorry for the late answer:
- Yes, in the future we will be able to add other variables to the map than GHG, but let's start with this one.
Very good idea, we should cooperate with ecoinvent to improve their LCA analysis based on our identified load factors globally.
Back to this issue: we're looking for "Lifecycle Analysis CO2eq/kWh values per country/states and per fuel type. We don't need very detailed factors per sub)categories of power plants as we don't have the production data with such breakdown. We would need a standardized approach across many countries in order to make the EMap compare regions in a fair manner.
To your opinion, which database is preferable to investigate? Econinvent? If so, would you know where we could access such data? It seems that your suggested paper only gives direct emissions, not LCA. Any contacts at ecoinvent we could talk to?
brunolajoie
on 6 Jan 2018
Update on ecoinvent:
1/ It's not free
2/ "Licensee is not entitled to reproduce, disseminate or publicly display any significant portions of the ecoinvent Database or the ecoinvent Datasets."
We want to remain transparent, and show in the electricitymap the c-intensity factor used to compute country's c-intensity.
I'll contact them to figure out in detail if we can collaborate on this, hopefully we can work something out!
brunolajoie
on 6 Jan 2018
@brunolajoie I'd like to leave this chart here based on LCA for Germany. I had posted another part of this before (in the lignite vs. hard coal emission issue #162).
The study can be found here:
https://www.vdi.de/fileadmin/vdi_de/redakteur_dateien/geu_dateien/FB4-Internetseiten/CO2-Emissionen%20der%20Stromerzeugung_01.pdf

It was released 2007. There are many examples per production type and several sources given.
- For fossil and hydro generation, numbers will still be valid.
- As the majority of PV was installed between 2009-2013 after the relase of the study, I'd stick with IPCC for that category (as well as for the rest of renewables)
 alixunderplatz
on 6 Jan 2018
alixunderplatz
on 6 Jan 2018
Thanks. Same remark than for moldova: lets keep that in mind if we don't find standardized approach valid for all ocuntries.
brunolajoie
on 7 Jan 2018
@brunolajoie
On the database. Ecoinvent is probably the best reference in terms of life cycle inventory databases. As you remarked, it is unfortunately not free _BUT_ I am sure we (e.g., I) can compile life-cycle factors for the electricity-producing processes that can be found in ecoinvent without infringing the copyright issue, as long as (1) we don't disclose the disaggregated inventory data (i.e. only one number per kWh, without detail on the impact contribution) and (2) we remain reasonable in how much data we extract (I guess ~100 technologies would be fine, the database contains >15000 processes). The best would be to get in touch with the ecoinvent people, I can suggest Christian Bauer and Laurent Vandepaer, who are working on refining the electricity inventories for the next ecoinvent version.
On direct emissions. You are right, the regional detail is for direct emissions only, I think the assumption is that all plants are built and decommissioned in the same way everywhere, so the variable share is only the direct emissions. The contribution from infrastructure is usually very low as long as we only look at CO2 (see below the detail for 1 kWh from coal).

@alixunderplatz We have made the same comparison for my PhD thesis work, see Papers III and IV here: https://brage.bibsys.no/xmlui/handle/11250/2469193
Especially:
...for CO2:

and for other environmental impacts:

thomasgibon
on 8 Jan 2018
Great news @thomasgibon. I've contacted ecoinvent last week through their contact-us generic email, (no answer yet) and would be happy to try again if you could give me in private the contacts of Christian Bauer and Laurent Vandepaer that you mentioned. Else i'll try to find them online thanks!
brunolajoie
on 8 Jan 2018
@brunolajoie I actually talked to Laurent yesterday, who said he'd contact you directly. He's a PhD student working with marginal electricity mix data in ecoinvent, and Christian Bauer is one of his supervisors.
thomasgibon
on 9 Jan 2018
Thanks! I'm in discussion with Econinvent. Will let you know
brunolajoie
on 10 Jan 2018
The following document comes from the scientific service of the German parliament and is a collection of carbon emission factors for different generation types (it's from 2007!).
https://www.bundestag.de/blob/406432/70f77c4c170d9048d88dcc3071b7721c/wd-8-056-07-pdf-data.pdf
I want to point at the chart on page 25. It is a list of related emissions from nuclear power plants. It says that emissions highly depend on where (country) and how (process) the uranium enrichment took place before delivery to the NPP. France mainly uses domestic "nuclear" electricity for this process, so CO2eq is at 8 g/kWh for NPPs using French fuel elements. For South African uranium fuel it is at 125 g/kWh, because of high coal share in their electricity mix and using a more energy consuming process for uranium enrichment.

alixunderplatz
on 6 Feb 2018
@thomasgibon, I'd be happy to have a chat with you about your proposed approach, ping me on slack anytime!
brunolajoie
on 28 Feb 2018
For info re ecoinvent the paper https://www.sciencedirect.com/science/article/pii/S030142151630091X I referred to in #1309 for Turkey says: "The background life cycle inventory data have been sourced largely from Ecoinvent v2.2 (Dones et al., 2007) but have been adapted as far as possible to Turkey's conditions"
 jzlcdh
on 4 May 2018
jzlcdh
on 4 May 2018
We have a new lead: The following paper "Real-Time Carbon Accounting Method for the European Electricity Markets", supplementary material Table 1,2,3, provides: emission factors for each EU country, per type of power plant, and distinguishing Operational vs. Lifecycle emissions factor., derived from ecoinvent v3
We could use it to have a more precise electricityMap for each EU countries.
As values differ significatively from IPCC's median value, we can't use them only for EU countries and fall back to IPCC for the rest of the world. That would be highly unfair comparison.
Hopefully, it also contains a EU-28 average emission factor per fuel which we could potentially use as a not so bad proxy for default emission factor of countries outside EU.
As we have a operational vs. lifecycle emission factors, we could potentially create a "toogle switch" to switch between an electricityMap with "only operational emission", and another one with "operational + lifecycle" emissions


What do you guys think? cc @thomasgibon
brunolajoie
on 18 Dec 2018
Hi @brunolajoie, that was quick :)
First, I think we need to wait for the reviewers' comments and decision on the paper. I ran quality checks on this data, but third-party verification is most welcome.
Second, your proposition sounds adequate:
- if country-specific data exists: use it,
- elif country is in EU28: use EU28 average,
- else: use IPCC average.
For some technologies, the change would be pretty drastic (e.g. Finnish oil-fired power plants, which seem to be very efficient). I should remake Table 1 adding the IPCC values to have a general overview of how it would change mix results.
And third, the total vs. operational (vs. direct?) toggle would be great to see! A remark, I went back to look at the IPCC CO2/kWh figure, they make the split direct/indirect (supply chain + infrastructure):
 thomasgibon
on 19 Dec 2018
thomasgibon
on 19 Dec 2018
Thanks Thomas.
I'm not comfortable mixing using IPCC average for non-EU country, and ecoinvent-derived data for EU countries. The methodology and underlying assumption would be very different.
Ideally, what we would have needed is a Global Average emission factors using the same methodology that was used in the paper to compute EU-28 average.
If we don't have that, what do you think about using the paper's EU-28 average for NON-EU countries?
brunolajoie
on 19 Dec 2018
Very good point, it would work if we used the lifecycle numbers only.
However, the IPCC also provides a rough breakdown of these emissions in Table A.III.2 of AR5 WGIII: https://www.ipcc.ch/site/assets/uploads/2018/02/ipcc_wg3_ar5_annex-iii.pdf
The split is direct/indirect, though, meaning that all low-carbon sources have "0" direct emissions. Maybe show the lifecycle numbers by default, and when switching to "operations" or "direct" show only the countries that have this data?
thomasgibon
on 19 Dec 2018
Table A.III.2 is already what we use. However you see it's not "global coal average" but only "Pulverized coal PC", which makes this 820 a bit low for the electricityMap.
I'm not sure to understand your first sentence?
brunolajoie
on 20 Dec 2018
Quoting @erdmark in #1765
On your site coal has a carbon intensity of 820g/kWh in Germany.
I think it is a bit higher. In Germany there are two types of coal burned, normal hard coal with ~870 and lignite coal with ~1130g.
The data is from energy-charts.de for 2016. I divided CO2 emissions by generated power over the whole year. The weighted average of both types 1020, much higher than what electricitymap calculates with.
Climate impact could be even worse, because this is only co2 without methane emissions.
You can see the calculation, data source and data from 2007 to 2016 in the attachment.
 systemcatch
on 11 Feb 2019
systemcatch
on 11 Feb 2019
I like the idea of having a toggle switch between lifecycle and operational. I presume the operational figures are much more accurate than the lifecycle ones? Certainly a couple of years ago here in Turkey methane emissions from coal mining were the least certain figures in the country's ghg emissions. I don't know if that is still true and whether they are also very uncertain in other coal mining countries. So having a toggle switch might enable people to choose between a very uncertain lifecycle figure and a reasonably accurate operational figure?
jzlcdh
on 13 Feb 2019
Yes, the idea of the toogle switch would be awesome.
As discussed above we're waiting for the peer review of the following paper which could provide such figures. We would be able to have the Lifecycle vs. Operation emissions, splitted by EU-country, and use EU-28 average as default value to all non-EU countries in the eMap. cc @thomasgibon
brunolajoie
on 13 Feb 2019
I concur, great idea. I don't think we have heard back from the reviewers yet.
The main criticism I am awaiting from the review is the relevance of separating indirect (i.e. not on-site, such as coal mining, logistics, ...) vs. direct (e.g. direct emissions from combustion) emissions, as opposed to what is done in the paper, i.e. separating infrastructure (i.e. invested capital, namely construction of plants and mines) vs. operation (which includes mining activities and transportation). For renewables this distinction is almost unnecessary (infrastructure emissions ~ indirect emissions) but for coal or gas, should extraction be part of infrastructure or operation? What would be the most informative to the electricity map users? As long as this is clearly explained, I see no issue using one or the other.
@erdmark in the paper we find emissions of 1170 g CO2 eq./kWh average for German coal plants (so not only CO2), which seems to fit the data from energy-charts.de
thomasgibon
on 13 Feb 2019
@thomasgibon I personally like very much the split in the paper (operational vs. non-operational emissions. One is clearly per kWh. The other depends on the lifetime & load factor of the power plant). What would be the split closer to scope 2 vs. scope 3 GHG accounting? Let's wait for the reviews!
brunolajoie
on 13 Feb 2019
The paper is now peer-reviewed and published here
We shall be able to use it to finally update our default emission factor per country, using table 1 from supplementary material

What we could do, as a suggestion, is
- Update emission factors for each EU country based on table 1
- Update the default fallback emission factor to that or EU-28 average
- Make sure to also recompute manually some "unknown" values that were computed based on assumptions of a static fuel mix
- Make sure to adjust the color scale because figures will be 30% higher in average
- Re-compute all historical carbon intensity values in our database to maintain continuity
We can leave for another issue the distinction between operational vs. non-operational (to make things a bit clearer).
Does this seems reasonable to you guys?
brunolajoie
on 6 Jun 2019
Bruno's most recent comment here https://github.com/tmrowco/electricitymap-contrib/issues/738#issuecomment-499397532 has a table of carbon intensities for fuels for EU/ENTSO-E countries. It would be a great contribution to add these to corresponding zoneOverrides in https://github.com/tmrowco/electricitymap-contrib/blob/master/config/co2eq_parameters.json.
 jarek
on 30 Sep 2019
jarek
on 30 Sep 2019
The paper is now peer-reviewed and published
@brunolajoie I am confused: how can coal cogeneration values be higher than non-cogeneration? And moreover, how do we make use of the cogeneration values at all?
 scriptator
on 27 Oct 2019
scriptator
on 27 Oct 2019
@scriptator In general, it is not really possible to distinguish between co-generation and non-co-generation from most of our data sources. In addition, there are several different scientific approaches how to account for the carbon emissions of heat and electricity from co-generation and there is no right or wrong in "how to account for it correctly".
We're probably never going to seperately account for co-gen and non-co-gen for these reasons.
Trying to answer your question regarding the data table: "how can co-generation emissions be higher than non-co-generation"
(I'm not too sure, though, if it's totally correct^^) It seems, this mainly applies to coal power plants with co-generation in the table. I guess, it's because many of these co-gen coal plants in Europe are "operated by electricity demand".
In winter times with additional heat demand, you will often withdraw hot steam from the thermodynamic cycle, which is not able to contribute to electricity generation anymore. Waste heat from the process might not be sufficient enough to cover the heat demand during the heating period. Therefore, you will use more fuel to acchieve the nominal electricity output of your generator plus to cover the greater heat demand. When accounting the "emissions of fuel used per kWh electricity output", you might end up with a higher intensity than before. Depends on the method of accounting as well.
alixunderplatz
on 27 Oct 2019
These figure were derived from ecoinvent Database. @thomasgibon might know the exact answer!
brunolajoie
on 30 Oct 2019
The values given were indeed extracted from the ecoinvent database, in its "cut-off" version, which applies the simplest allocation methods. Some information here.
(I'm not too sure, though, if it's totally correct^^) It seems, this mainly applies to coal power plants with co-generation in the table. I guess, it's because many of these co-gen coal plants in Europe are "operated by electricity demand".
This is correct, electricity is the main driver for coal power plants, as opposed to gas or biomass, therefore most of the impact is allocated to the electricity consumption.
The co-generation power plants are a little less efficient, I'll try to find the exact efficiencies assumed per country from the ecoinvent documentation.
At first I was wondering if the choice of database variant had an influence - so I have calculated the two processes "electricity, 1 kWh" and "heat, 1 MJ" from the German coal CHP plant of ecoinvent, both in version "cut-off" and "allocation at point of substitution" (a variant of the database that gives credit to an activity if a byproduct is valorized). It shows that the choice of database does not matter, as most of the impact is allocated to electricity based on economic allocation in both cases:

Prices assumed:

thomasgibon
on 2 Nov 2019
Super insightfull! If I understand well, in our scientific paper Table1 (above), cogen byproduycts are not taken into account and thus are not "reducing" the carbon intensity of power plants. It's just their relative efficiency wchich makes a difference. But another "fair" method would have been to allocate some carbon savings based on cogenerated heat, proportionally to the relative price of heat compared to electricity. Yet as heat is about 9 times cheaper than electricity, it would not make big of a difference.
In any case, right now electricityMap parsers does not really differentiate cogen plants from non cogen ones, as in many cases we don't have access to such level of details. It seems reasonnable for me to move forward with these new (non-cogen) values for our electricityMap CO2 intensity models.
brunolajoie
on 2 Nov 2019
Ok guys, is it time to update all our eMap GHG emission factor per fuel per country?
We have peer reviewed LCA-based figures, for each EU 28 country. We could use the EU-average as the default for all eMap countries (quite an extrapolation I admit), and override each EU country with their specific factor. Let me know what you think :thumbsup: :thumbsdown: I’m ready to code the PR whenever needed
brunolajoie
on 12 Dec 2019
Could you post here the IPCC table and the new default values we would have so we can compare?
The IPCC argument has been very solid in order to establish credibility in the nuclear vs renewable debate (irrespective of stance), so I want to make sure we can keep such a solid argument.
 corradio
on 12 Dec 2019
corradio
on 12 Dec 2019
 brunolajoie
on 12 Dec 2019
brunolajoie
on 12 Dec 2019
Do you have any intuition explaining why some changed drastically?
I'm thinking we will need to communicate about this, and maybe a quick blog post would help, specifically on:
- coal
- oil
- biomass
- solar
The other changes seem simpler.
corradio
on 13 Dec 2019
@thomasgibon would know better than me about ecoinvent database!
brunolajoie
on 13 Dec 2019
- For coal, it's quite easy to explain, the IPCC value of 820 g is actually quite optimistic, and based on pulverized coal technologies only (I would need an expert to check, but pulverized coal is mostly anthracite, hard coal). World average is still well above 1 kg CO2 eq./kWh, because you start including other sources, such as lignite (brown coal) and in the case of Estonia, other unconventional coal (oil shale). This gap also appears in the IPCC figure

- Regarding oil, I am not so sure - does the IPCC even give a range for oil combustion technologies?
- Biomass values are highly variable depending on source and pathway - I suspect allocation issues as well, as most biomass plants in ecoinvent are CHP.
- For solar, I would have to look into the sources. I reckon >90 is high, I think it's mostly because ecoinvent PV inventories might be a little outdated.
thomasgibon
on 13 Dec 2019
Great that you are working to differentiate emission factors according to regions, fuel and power plant level.
Nevertheless, something looks wrong in Table 1 posted by @brunolajoie in his update of the intro to this thread. It´s the ratio between the emission factors for thermal power generation - pure electricity generation compared to cogeneration from the same fuel. It is about the total efficiency, which is approx. twice as high for cogeneration plants as for power plants without heat utilization. That means the CO2 emission from burning the fuel is distributed over twice as many kWh (~50/50% between power and heat), which results in halving the emission factors for cogeneration.
Electricity and total efficiency vary from power plant to power plant, and can also depend on the season, due to varying heat requirements. It will be very useful if it is possible to retrieve data for the power plants efficiencies simultaneously with obtaining figures for electricity generation. In the absence of accurate live data for efficiency, it is possible to initially operate with power plant-specific efficiencies based on the design parameters or statements from these power plants.
 nielsanso
on 15 Dec 2019
nielsanso
on 15 Dec 2019
So to summarize:
- The current IPCC figure use for coal in eMap (820g/kWh) is not optimal cause it's only for pulverized coal plant. It could be updated to the ~1000g figure shown above, given by IPCC (AR5 WGIII chapter 7 figure 7.6, and covered in more detail in WGIII annex A.II.9.3.)
- oil figure was not given by IPCC, but by an independent study, but very few power plants use oil anyway
- biomass: need to check CHP allocation rules in ecoinvent
- solar : need to check by how much LCA figures are outdate in ecoinvent database
brunolajoie
on 17 Dec 2019
The issue about energy efficiency for CHP plants (eg. 80-90%) vs. Power Plants without heat utilization(eg. 40-45%), is not relevant only for biomass but for any fuel, incl. natural gas and coal. In Denmark all decentralized natural gas fired CHP´s has very high total energy efficiency, I think they produce slightly more heat than power, so 490 g CO2/kWh is far high – should be less than ½ (245 g CO2/kWh) because you get more than the double energy out from burning the same amount of fuel (same amount of CO2 emission). The Coal power plant in Aalborg, DK, is also utilizing the heat, so 820 g CO2/kWh is too high, at least during the heating season
nielsanso
on 17 Dec 2019
We already talked about CHP allocation in the discussion above, if you wish to have a look
brunolajoie
on 17 Dec 2019
Are we ready to make a PR here? Would be great to get this done.
corradio
on 31 Jan 2020
@thomasgibon @brunolajoie can you confirm to @nielsanso that chp allocation rules also are used for coal and gas (and not only biomass)?
corradio
on 31 Jan 2020
Hi all, the allocation rules are the same for all sources, yes, it's a continuously discussed topic in LCA because of the variety of methods you can apply. From what I know, economic partitioning seems to be the main method used for electricity and heat (because electricity is of higher quality, it would be unfair to allocate on an energy basis). This is what is done in Bo's paper. That probably explains the discrepancies observed by @nielsanso
@brunolajoie @corradio regarding coal, it is a single category in emap right? (i.e. no distinction hard coal/lignite) I also agree that 820 g is far optimistic in this regard.
thomasgibon
on 5 Feb 2020
Coal reffered in Estonia is actually Oil Shale. Its low calorific value fuel, about 50% ash after combustion. With heavy limestone content. It is sedimentary rock. https://en.wikipedia.org/wiki/Oil_shale
If it is under coal category , we can live on that, but emission factor today 1515 kg_CO2/MWh_el is far away from actual figure.
 katlavaht
on 5 Feb 2020
katlavaht
on 5 Feb 2020
Allright - then I think we're ready for a PR with all the numbers! Who
wants to lead that? @brunolajoie ?
On Wed, Feb 5, 2020 at 12:27 PM Ain Laidoja notifications@github.com
wrote:
Coal reffered in Estonia is actually Oil Shale. Its low calorific
value fuel, about 50% ash after combustion. With heavy limestone content.
It is sedimentary rock. https://en.wikipedia.org/wiki/Oil_shale
If it is under coal category , we can live on that, but emission factor
today 1515 kg_CO2/MWh_el is far away from actual figure.—
You are receiving this because you were mentioned.
Reply to this email directly, view it on GitHub
https://github.com/tmrowco/electricitymap-contrib/issues/738?email_source=notifications&email_token=AAMUIKCBRP6D7QHSSFS6Y7DRBKPC3A5CNFSM4DZWD732YY3PNVWWK3TUL52HS4DFVREXG43VMVBW63LNMVXHJKTDN5WW2ZLOORPWSZGOEK3C2DQ#issuecomment-582364430,
or unsubscribe
https://github.com/notifications/unsubscribe-auth/AAMUIKHEXLFJDWFZ25SRZZTRBKPC3ANCNFSM4DZWD73Q
.
--
Olivier Corradi
Founder, CEO
https://www.linkedin.com/in/oliviercorradi https://twitter.com/corradio
tmrow.com
corradio
on 5 Feb 2020
I feel we are stuck somewhere ? @corradio @brunolajoie
katlavaht
on 17 Feb 2020
As soon as we have a PR ready we can start the migration process.
corradio
on 17 Feb 2020
I may be able to look at it in March
brunolajoie
on 18 Feb 2020
From what I know, economic partitioning seems to be the main method used for electricity and heat
Thank you for your efforts. Its great work.
I agree that it can make sense to distribute emissions based on the economic value of electricity and heat respectively. Nevertheless, the values of these vary dynamically. Eg. in recent days there has been cold and no wind in most of denmark. The heat demand is large, so the cogeneration plants run most on heat demand, so one can argue that heat is the main product and the power by-product.
But often there is excess wind energy, so the price of electricity drops, and it may even make sense to convert electricity to heat, thus saving fuel at the cogeneration plants.
If this price dynamic could be integrated into ElectricityMap, it could become an even better tool for comparing emissions and efficiency across regions.
I know its challenging – but its also very exciting, if it can be made.
nielsanso
on 28 Feb 2020
Good points. We'll discuss it internally but in any case just having better
static factors will already be a huge improvement
On Friday, February 28, 2020, nielsanso notifications@github.com wrote:
Hi all, the allocation rules are the same for all sources, yes, it's a
continuously discussed topic in LCA because of the variety of methods you
can apply. From what I know, economic partitioning seems to be the main
method used for electricity and heat (because electricity is of higher
quality, it would be unfair to allocate on an energy basis). This is what
is done in Bo's paper. That probably explains the discrepancies observed by
@nielsanso https://github.com/nielsanso
@brunolajoie https://github.com/brunolajoie @corradio
https://github.com/corradio regarding coal, it is a single category in
emap right? (i.e. no distinction hard coal/lignite) I also agree that 820 g
is far optimistic in this regard.From what I know, economic partitioning seems to be the main method used
for electricity and heatThank you for your efforts. Its great work.
I agree that it can make sense to distribute emissions based on the
economic value of electricity and heat respectively. Nevertheless, the
values of these vary dynamically. Eg. in recent days there has been cold
and no wind in most of denmark. The heat demand is large, so the
cogeneration plants run most on heat demand, so one can argue that heat is
the main product and the power by-product.
But often there is excess wind energy, so the price of electricity drops,
and it may even make sense to convert electricity to heat, thus saving fuel
at the cogeneration plants.
If this price dynamic could be integrated into ElectricityMap, it could
become an even better tool for comparing emissions and efficiency across
regions.
I know its challenging – but its also very exciting, if it can be made.—
You are receiving this because you were mentioned.
Reply to this email directly, view it on GitHub
https://github.com/tmrowco/electricitymap-contrib/issues/738?email_source=notifications&email_token=AAMUIKHGZTIXX2TMKQQ253DRFEIGHA5CNFSM4DZWD732YY3PNVWWK3TUL52HS4DFVREXG43VMVBW63LNMVXHJKTDN5WW2ZLOORPWSZGOENIRYFA#issuecomment-592518164,
or unsubscribe
https://github.com/notifications/unsubscribe-auth/AAMUIKBBXTJXEPS7UVKFBHTRFEIGHANCNFSM4DZWD73Q
.
--
Olivier Corradi
Founder, CEO
https://www.linkedin.com/in/oliviercorradi https://twitter.com/corradio
tmrow.com
corradio
on 1 Mar 2020
Does anyone participating in this issue have a scientifically backed rebuttal against the claims made by Peter Zeihan regarding the environmental potential for solar energy in 'the countries in green': for example Germany, the Netherlands, Belgium...? I apologize for referring to a twitter discussion, but the argument is made there in a few sentences, and the necessary maps are included:
https://mobile.twitter.com/PeterZeihan/status/989868124525809664
Could it really be that bad? The table posted above by @brunolajoie states numbers around 110gCO2eq/kWh for those central/western EU-countries, which is (though far from zero-carbon) quite acceptable. Since I'm an amateur - no engineer - I'd like the insight of some of you experts here.
I tend to be nuclear positive, but I'm not a solar or wind energy hater. Sadly, policies seem to be based on ideological rather than factual basis. In this case, one would hope Zeihan is mistaken, since otherwise it would mean our governments have been throwing away a lot of dough...
 freddiy
on 27 Mar 2020
freddiy
on 27 Mar 2020
Not sure this is the place to discuss the topic, and there's a lot to unpack from your comment @freddiy :)
You refer to a Twitter comment from someone who claims to be a "Green who can do math", yet they do not provide any figure to substantiate their message (that photovoltaics are not a proper and scalable technological solution to reach a low-carbon electricity paradigm).
To quickly go through their arguments, in order:
PV still needs subsidies because it is immature, so of course it still has a higher levelized cost of electricity (LCOE, see figure S.1 in this IRENA report) than the grid in most places, but a) the gap is actually closing, and b) coal and gas electricity is also virtually subsidized through the absence of a proper carbon pricing mechanism. All in all, even in <1000 kWh/m2/year places, PV still makes economic sense.
I don't see how transmission is a PV-specific problem. First, PV's best use is decentralized and auto-production, this is what works best. Utility-scale PV is also a good idea, and not only in the sunniest regions. Actually the sunniest areas are also the hottest and dustiest, creating extreme conditions under which PV may not always fare well.
I have to agree partly on the intermittency problem, and storage techs are probably not yet up to the task of smoothing the production curve to match our consumption patterns.
I also set the "low-carbon" bar at around 100 g CO2 eq./kWh, which makes PV perfectly acceptable even in not-so-sunny areas (I have made estimates during my PhD time on the effect of regional variations on the lifecycle impacts). As for nuclear power, I also agree that it should be part of any portfolio that claims to be truly low-carbon, but there are so many other factors specific to this industry as we know it today (necessity of long-term planning, energy policy vision, highly-skilled staff, public acceptance and trust in government, stable geopolitical conditions...) that I have to recognize that >1GW PW/BW reactors are probably not for everyone (now with the development of SMRs... let's see). Anyway, clearly out of scope for a github discussion - I suggest to move to slack if you want (I just joined it). I can also delete this post if it doesn't fit the rules.
thomasgibon
on 31 Mar 2020
Please move my comment to wherever it fits or delete if necessary. I'm new to this, and absolutely don't want to break the rules.
The twitter format is absolutely not the best way for making the claims Zeihan is making. After read his comments, it leaves me with a craving for some proper details. Zeihan also comes across as a fossil fuel positive guy, which makes me more sceptical about his arguments.
Thank you for your answer btw!
freddiy
on 31 Mar 2020
I found a EPD from 2019-12-31 that seems to indicate that the nuclear value (for Sweden at least) is a bit high.
Now the EPD don't include all the nuclear power plants but it does include a majority of them so it might be worth looking into this.
EPD link: EPD Electricity from Vattenfall Nordic Nuclear Power Plants
Screengrab of EPD greenhouse gases graph:
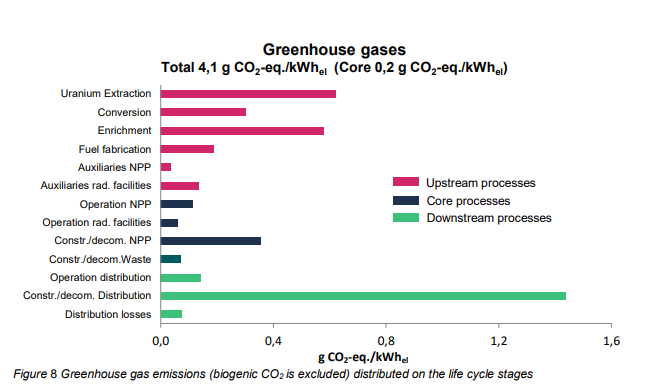
Note: There is also a calculation with biogenic co2 in the EPD that shows a 4.4g co2eq/kWh value but sadly there wasn't a graph for that.
 VIKTORVAV99
on 14 May 2020
VIKTORVAV99
on 14 May 2020
Related issues
alixunderplatz
·
3Comments
 StefanAO
·
4Comments
alixunderplatz
·
3Comments
StefanAO
·
4Comments
alixunderplatz
·
3Comments
 consideRatio
·
4Comments
corradio
·
5Comments
consideRatio
·
4Comments
corradio
·
5Comments
Most helpful comment
I may be able to look at it in March