Elastalert: expose metrics in Prometheus format
In addition to logging various information to Elasticsearch index to monitor the functioning of ElastAlert itself we can expose some stats related to ElastAlerts like hits, matches, time_taken, errors, number of alerts sent, number of silenced alerts in the prometheus format, since most of the kubernetes application are using prometheus format. I am already working on the same using prometheus python client and will be happy to submit a Pull Request for the same. Example snippet for the same
Defining metrics
# prometheus monitoring
self.prom_hits = Gauge('hits', 'Number of hits', ['rule_name'])
self.prom_matches = Gauge('matches', 'Number of matches', ['rule_name'])
self.prom_time_taken = Gauge('time_taken', 'Time taken to evaluate rule', ['rule_name'])
self.prom_alerts_sent = Counter('alerts_sent', 'Number of alerts sent', ['rule_name'])
self.prom_alerts_not_sent = Counter('alerts_not_sent', 'Number of alerts not sent', ['rule_name'])
self.prom_errors = Counter('errors', 'Number of errors')
self.prom_alerts_silenced = Counter('alerts_silenced', 'Number of silenced alerts', ['rule_name'])
Updating the metrics
def prometheus_export(elastalert, doc_type, body):
    if doc_type == 'elastalert_status':
        elastalert.prom_hits.labels(body['rule_name']).set(int(body['hits']))
        elastalert.prom_matches.labels(body['rule_name']).set(int(body['matches']))
        elastalert.prom_time_taken.labels(body['rule_name']).set(float(body['time_taken']))
    elif doc_type == 'elastalert':
        if body['alert_sent']:
            elastalert.prom_alerts_sent.labels(body['rule_name']).inc()
        else:
            elastalert.prom_alerts_not_sent.labels(body['rule_name']).inc()
    elif doc_type == 'elastalert_error':
        elastalert.prom_errors.inc()
    elif doc_type == 'silence':
        elastalert.prom_alerts_silenced.labels(body['rule_name']).inc()
Some example stats in prometheus format:
# HELP time_taken Time taken to evaluate rule
# TYPE time_taken gauge
time_taken{rule_name="Login Cardinality Rule"} 3.0952658653259277
# HELP alerts_silenced_total Number of silenced alerts
# TYPE alerts_silenced_total counter
alerts_silenced_total{rule_name="Rule  Login Cardinality"} 1.0
# TYPE alerts_silenced_created gauge
alerts_silenced_created{rule_name="Rule  Login Cardinality"} 1.544459418256786e+09
# HELP process_virtual_memory_bytes Virtual memory size in bytes.
# TYPE process_virtual_memory_bytes gauge
process_virtual_memory_bytes 3.57236736e+08
# HELP process_resident_memory_bytes Resident memory size in bytes.
# TYPE process_resident_memory_bytes gauge
process_resident_memory_bytes 8.859648e+07
# HELP process_start_time_seconds Start time of the process since unix epoch in seconds.
# TYPE process_start_time_seconds gauge
process_start_time_seconds 1.54445936291e+09
# HELP process_cpu_seconds_total Total user and system CPU time spent in seconds.
# TYPE process_cpu_seconds_total counter
process_cpu_seconds_total 1.1700000000000002
# HELP process_open_fds Number of open file descriptors.
# TYPE process_open_fds gauge
process_open_fds 16.0
# HELP process_max_fds Maximum number of open file descriptors.
# TYPE process_max_fds gauge
process_max_fds 1024.0
# HELP hits Number of hits
# TYPE hits gauge
hits{rule_name="Rule  Login Cardinality"} 13.0
# HELP alerts_not_sent_total Number of alerts sent
# TYPE alerts_not_sent_total counter
# HELP errors_total Number of errors
# TYPE errors_total counter
errors_total 0.0
# TYPE errors_created gauge
errors_created 1.544459364107193e+09
# HELP matches Number of matches
# TYPE matches gauge
matches{rule_name="Rule  Login Cardinality"} 13.0
# HELP python_info Python platform information
# TYPE python_info gauge
python_info{implementation="CPython",major="2",minor="7",patchlevel="14",version="2.7.14"} 1.0
# HELP alerts_sent_total Number of alerts sent
# TYPE alerts_sent_total counter
alerts_sent_total{rule_name="Rule  Login Cardinality"} 1.0
# TYPE alerts_sent_created gauge
alerts_sent_created{rule_name="Rule  Login Cardinality"} 1.544459419416654e+09
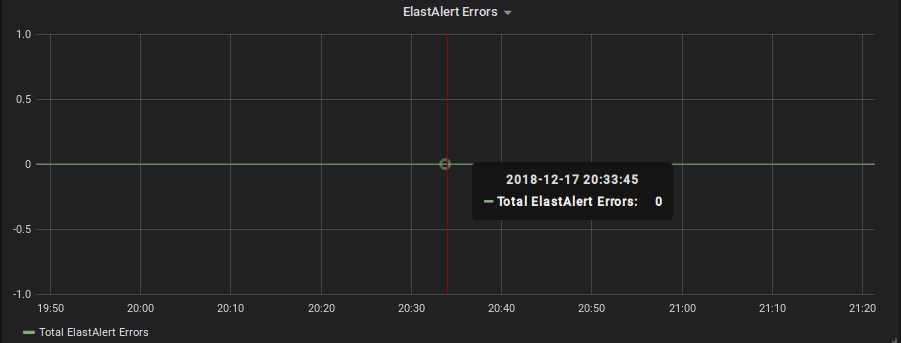
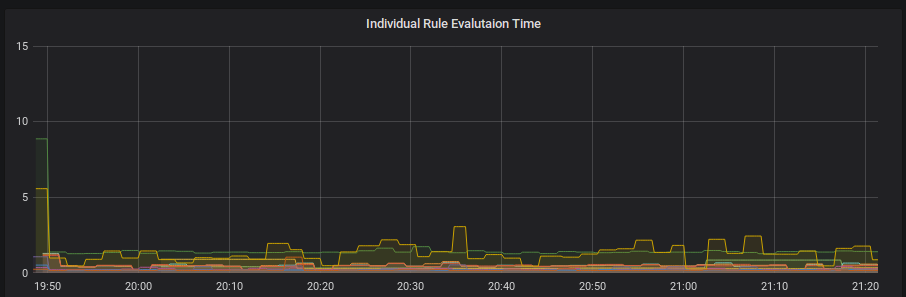
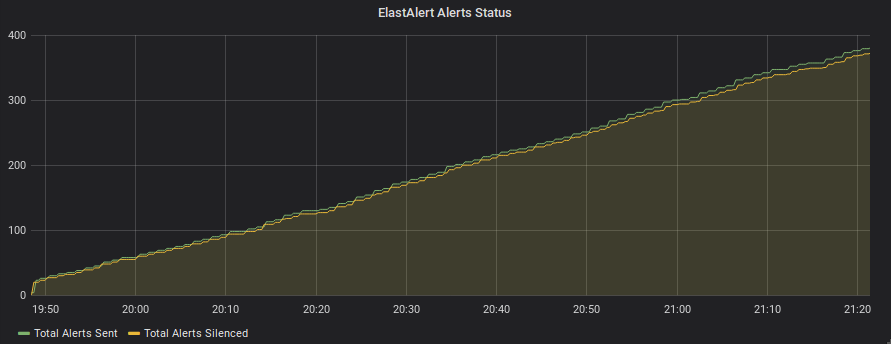
These metrics can be further used to make graphs and charts in Grafana or some other graphing tool
 abhishekjiitr
All 7 comments
+1
 jhejl2
on 17 Jan 2019
jhejl2
on 17 Jan 2019
@Qmando ?
abhishekjiitr
on 23 Jan 2019
+1
 Gareer
on 25 Mar 2019
Gareer
on 25 Mar 2019
Hi,
has there been any work in this direction? I would be very interested in this feature.
 Havilland
on 27 Mar 2019
Havilland
on 27 Mar 2019
This would be very useful to have!
 thommor
on 28 Mar 2019
thommor
on 28 Mar 2019
Would be great !
 rhnewtron
on 16 Apr 2019
rhnewtron
on 16 Apr 2019
2211 added, cheers! :beer:
abhishekjiitr
on 16 Apr 2019
Related issues
 wjk1982
·
3Comments
wjk1982
·
3Comments
 Shashankft9
·
3Comments
Shashankft9
·
3Comments
 chihhanyu
·
3Comments
chihhanyu
·
3Comments
 shortstack
·
3Comments
shortstack
·
3Comments
 vaibhavtupe
·
4Comments
vaibhavtupe
·
4Comments
Most helpful comment
2211 added, cheers! :beer: