Elastalert: Alert_text_args giving us <Missing Values> in output (debug mode)
Hi all,
I am trying to sent out an alert with ElastAlert and change the body of the mail by using alert_text_args. We would like to know, as we are running multiple servers, from what host a specific issue is coming from. Therefore we wanted to use 'host' which is an existing field in our metricbeat to alert that issue X is coming from server Y.

We are using a metric_aggregation rule type (test template) for now to see when our /tmp folder is over 80% of disk space we sent out an alert.
name: "Metricbeat low diskspace /tmp"
type: metric_aggregation

index: metricbeat-*

buffer_time:
  minutes: 1

metric_agg_key: system.filesystem.used.pct
metric_agg_type: min

doc_type: doc

bucket_interval:
  minutes: 1

sync_bucket_interval: true

#min_threshold: 0.01
max_threshold: 0.80

filter:
 - query:
     query_string:
       query: 'system.filesystem.mount_point: "/tmp"'

alert:
- "debug"

- "email"
email: "**********@hotmail.com"

alert_text: "{3} Server {0} Low diskspace available on {1}  Percentage used {2}"
alert_text_type: alert_text_only
alert_text_args: ["host", "system.filesystem.mount_point", "system.filesystem.used.pct", "@timestamp"]

realert:
  minutes: 0
However, when we do this, as mentioned above we get the following output:
INFO:elastalert:Alert for Metricbeat low diskspace /export/data at 2018-05-07T09:42:00Z:
INFO:elastalert:2018-05-07T09:42:00Z Server MISSING VALUE Low diskspace available on MISSING VALUE Percentage used MISSING VALUE
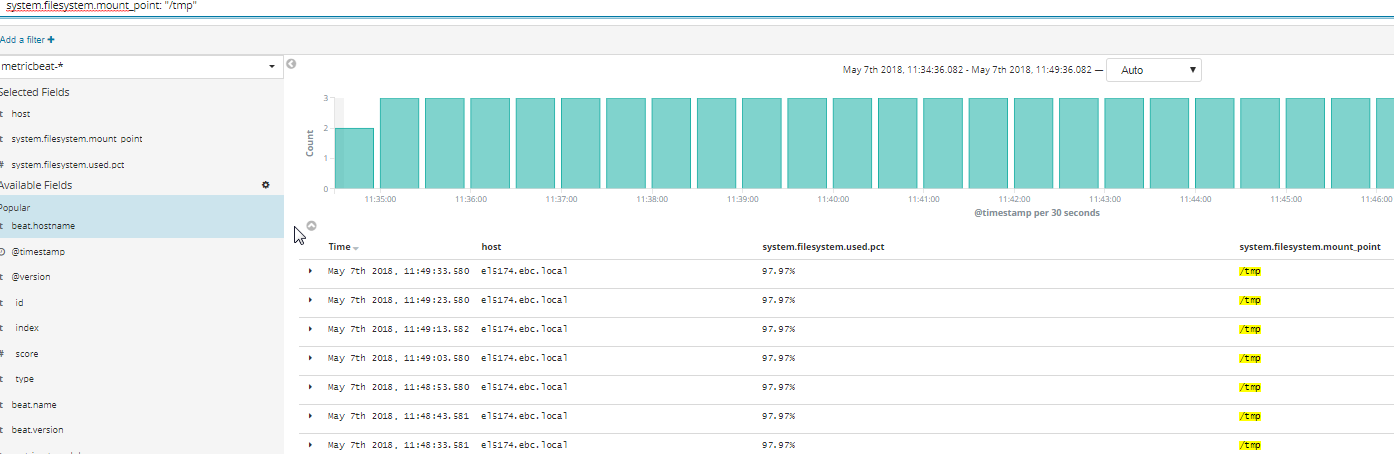
As extra information, I will also attach an example of the query we execute in elasticsearch, which shows that our /tmp folder is going over 80% for that specific host.
Thank you and I am looking forward to your answer.
Kind regards,
Yannick
 Yannick91
All 14 comments
Hi,
I'm experiencing the same issue. I found this issue but the suggested fix doesn't work for me.
I currently have a workaround using the "Any" rule. It seems with this rule the fields from metricbeat are present in Elastalert. Nevertheless I'm also looking for a way to set this up with "metric aggregation rules types"
@Qmando Maybe you can elaborate on the suggested alternative in this issue?
 MaximV93
on 7 May 2018
MaximV93
on 7 May 2018
Thanks for the quick reply!
Yeah, I have also tried to work with top_count_keys like in thread #1260 but it is not working for me either.
I will try to use the 'any' rule then and elaborate my query so I can filter out the information that I require.
Thanks!
Yannick
Yannick91
on 7 May 2018
You don't need a metric aggregation for this. "Any" will work since all you are looking for is a single document showing 80% disk usage. Calculating an aggregated metric means you are looking across all hosts at once.
type: any
filter:
- range:
system.filesystem.used.pct:
gt: 0.8
And keep (almost) everything else in the rule. Should do what you want.
 Qmando
on 7 May 2018
Qmando
on 7 May 2018
As a follow up though, you still could achieve this with metric aggregations. Generally you can't access any fields with metric aggregations, except for the "key", which acts as a bucket for the aggregation calculation. In this case, you'd need to add
query_key: host
This should make it available to use in alert_text_args.
Qmando
on 7 May 2018
Hey Qmando,
Thanks for your quick reply! I am able to do this with the 'any' rule as you mentioned. Also for the metric aggregation rule I can add the query_key: host which is then shown in the alert_text_args. However, I can't seem to figure out how to get the 'system.filesystem.mount_point'. The message is now as followed:
Server el5174.ebc.local Low diskspace available on MISSING VALUE Percentage used 0.899
This is what we use in the rule:
alert_text: "{3} Server {0} Low diskspace available on {1} Percentage used {2}"
alert_text_type: alert_text_only
alert_text_args:
- host
- system.filesystem.mount_point
- system.filesystem.used.pct_min
- "@timestamp"
Thank you for looking into this!
Kind regards,
Yannick
Yannick91
on 8 May 2018
I figured it out.
I fixed it with the any rule. I use your range filter + term filter for that specific mount point (/tmp).
However, the percentage is always visualized from 0.1 - 1.
Server el5174.ebc.local Low diskspace available on /tmp Percentage used 1
The quote here means that our /tmp is 100% full (1). Any idea on how we could convert the 1 to a 100% so that it is easily readable for others.
Thanks!
Kind regards,
Yannick
Yannick91
on 8 May 2018
Well, I don't think you can do percentage exactly, but you can round.
If you replace {2} with {2:.2f} for example, it will round to 2 digits.
This might be a good feature to add though
Qmando
on 8 May 2018
Correct, we can indeed round it to 2 digits but then we have 0.89 for example instead of 0.894567 which is a step forward. However, the ultimate solution would be to trim the 0. away and just have 89 there. We can add the % in the alert_text.
Thanks.
Yannick91
on 9 May 2018
@Yannick91
Here's one way to print the percentage format
alert_text: "{3} Server {0} Low diskspace in {1} Used {2:.0%}"
alert_text_type: alert_text_only
alert_text_args:
- host
- system.filesystem.mount_point
- system.filesystem.used.pct_min
- "@timestamp"
Credit to https://stackoverflow.com/a/5306787
 josh-barker
on 25 Jul 2018
josh-barker
on 25 Jul 2018
@Yannick91 : Can you please tell me how you used range filter + term filter as mentioned by you earlier in your comment. I'm trying to accomplish the same but getting "MISSING VALUE" and the fix in #1260 does not work for me either.
 tarun-kumawat
on 15 Aug 2018
tarun-kumawat
on 15 Aug 2018
@tarun-kumawat
Filters are completely unrelated to "MISSING VALUE". You'll get the missing value if you're using a query type that doesn't include full field data, ie, terms query, count query, and metric aggregation query.
If top_count_keys doesn't work, perhaps it's because you don't have .keyword fields. Try adding
raw_count_keys: false
@Yannick91 : Can you please tell me how you used range filter + term filter as mentioned by you earlier in your comment. I'm trying to accomplish the same but getting "MISSING VALUE" and the fix in #1260 does not work for me either.
You must be sure that doc_type is set to 'any' . Verify index sintax as well
 rvbmedeiros
on 22 Dec 2018
rvbmedeiros
on 22 Dec 2018
I had the same issue because I limited the document source with include and where missing some fields
 etwillbefine
on 29 Oct 2019
etwillbefine
on 29 Oct 2019
I'm getting the same missing value for the following configuration.
# The alert looks like
name: Account balance threshold is close
description: "Triggers when Account balance threshold is close"
type: frequency
use_strftime_index: true
index: logstash-*

filter:
- query:
    query_string:
      query: "threshold>5000000"

num_events: 1

timeframe:
  minutes: 10

buffer_time:
  minutes: 5

query_key: [airline]

alert_text: |
    The account balance threshold have reached. The remaining balance is {0}
alert_text_args: ["Funds.Balance"]
alert_text_type: alert_text_only


alert:
- "email"

email:

- "[email protected]"
And the email looks like
The account balance threshold has reached. The remaining balance is <MISSING VALUE>
 justrishabh
on 22 Sep 2020
justrishabh
on 22 Sep 2020
Related issues
 JeffAshton
·
3Comments
JeffAshton
·
3Comments
 aromualdo
·
4Comments
aromualdo
·
4Comments
 MaximilianKaltner
·
3Comments
MaximilianKaltner
·
3Comments
 shaohk
·
4Comments
shaohk
·
4Comments
 tkumark
·
3Comments
tkumark
·
3Comments
Most helpful comment
@Yannick91
Here's one way to print the percentage format
Credit to https://stackoverflow.com/a/5306787