Is it possible to customise HTML email alerts to have tables and logos on? Any advice or templates/examples would be great!
 Gee94
Gee94
All 18 comments
@Gee94
You can try this https://github.com/qianghaohao/elastalert/blob/master/alerts.py
Just replace the alerts.py and modify your rule to get the HTML format alert
# Email will contain following Subject TAG and Body message


alert_subject: "Port Scan activity detected between Source {0} and Destination {1} @ {2}"

alert_subject_args:

  - Field1
  - Field2
  - timestamp


html_table_title: "<h3> Scan has been detected </h3> <p style='color:#4169E1;' style=font-family:verdana> Hi Team <br/><br/> Elastalert has identified a potential Network port
scan detection between following source and destination IP address, do something about it</p>"

alert_text_type: alert_text_only

alert_text: |

email_type: "html"

summary_table_fields_html:

    - Field1

    - Field2
 sathishdsgithub
on 31 Jan 2018
sathishdsgithub
on 31 Jan 2018
I am getting a blank email output. Below is what my config file looks like:
# (Required)
# The alert is use when a match is found
alert:
- "email"

alert_subject: "NAGIOS Alert: Generated alert on {0} @ {1}"

alert_subject_args:
  - host
  - "@timestamp"

html_table_title: "<h3> Scan has been detected </h3> <p style='color:#4169E1;' style=font-family:verdana> Hi Team <br/><br/> Elastalert has identified a potential issue on the following host, do something about it</p>"

alert_text_type: alert_text_only

alert_text: |

email_type: "html"

summary_table_fields_html:
  - host
  - message

email:
- "[email protected]"
I have replaced the alerts.py as mentioned above. Am I missing anything? I do get the subject populated properly though.
 samsonkolge
on 20 Mar 2018
samsonkolge
on 20 Mar 2018
@samsonkolge
Please use the below alerts.py file. This is the updated one
https://github.com/sathishdsgithub/elastalert/blob/master/elastalert/alerts.py
sathishdsgithub
on 20 Mar 2018
I am still only getting blank email
 singhrajneesh
on 23 Jul 2018
singhrajneesh
on 23 Jul 2018
@singhrajneesh You didn't post your config so I don't know what's wrong.
If you're copying the previously posted one:
alert_text_type: alert_text_only

alert_text: |
This is why it's blank. You set alert_text to an empty string and then set the alert to only use that.
You can already add HTML to emails via the alert text. https://github.com/Yelp/elastalert/pull/1799 will let you add custom html surrounding the summary table specifically.
 Qmando
on 26 Jul 2018
Qmando
on 26 Jul 2018
@Qmando Can you please tell me what is wrong in it .It will be very helpful if you can correct it.
Alert when the rate of events exceeds a threshold
(Optional)
Elasticsearch host
es_host: localhost
(Optional)
Elasticsearch port
es_port: 9200
(OptionaL) Connect with SSL to Elasticsearch
use_ssl: True
(Optional) basic-auth username and password for Elasticsearch
es_username: someusername
es_password: somepassword
(Required)
Rule name, must be unique
name: Example frequency rule
(Required)
Type of alert.
the frequency rule type alerts when num_events events occur with timeframe time
type: frequency
(Required)
Index to search, wildcard supported
index: logstash-*
(Required, frequency specific)
Alert when this many documents matching the query occur within a timeframe
num_events: 1
attach_related: true
(Required, frequency specific)
num_events must occur within this amount of time to trigger an alert
timeframe:
hours: 24
(Required)
A list of Elasticsearch filters used for find events
These filters are joined with AND and nested in a filtered query
For more info: http://www.elasticsearch.org/guide/en/elasticsearch/reference/current/query-dsl.html
filter:
- bool:
should:
- range:
system.load.1:
from: 1
to: 10 - range:
system.filesystem.used.pct:
from: 0
to: 100
minimum_should_match: 0
- range:
alert_subject: "Port Scan activity detected between Source {0} and Destination {1} @ {2}"
alert_subject_args:
- system.load.1
- system.filesystem.used.pct
- "@timestamp"
html_table_title: "
Scan has been detected
Hi Team
Elastalert has identified a potential Network port
scan detection between following source and destination IP address, do something about it
alert_text_type: alert_text_only
alert_text: |
email_type: "html"
summary_table_fields_html:
- system.load.1
- system.filesystem.used.pct
(Required)
The alert is use when a match is found
alert:
- "email"
(required, email specific)
a list of email addresses to send alerts to
email:
- "$RecipientEmail"
smtp_host: "smtp.gmail.com"
smtp_port: 465
smtp_ssl: true
from_addr: "$SenderEmail"
smtp_auth_file: '/opt/elastalert/smtp_auth_file.yaml'
singhrajneesh
on 28 Jul 2018
Hi @Qmando @sathishdsgithub @singhrajneesh
I have been trying to display the matching results from elastalert into an email alert with HTML formatting.
I was able to create an HTML template in the email alert body by using the below config.
PFB snapshot of my alert.
.........
[alert_subject: "ElastAlert {1}: Error Code {0} encountered at {2}"
alert_subject_args:
- fieldName3
- category
- "@timestamp"
alert_text_type: alert_text_only
alert_text: |
Hi Team,
Scan report for Error Code {3}.PFB table for more details.
| FieldName3 | FieldName1 | FieldName2 | FieldName0 |
|---|---|---|---|
| {3} | {1} | {2} | {0} |
Regards,
ElastAlert Team
alert_text_args: ["@timestamp", FieldName1, FieldName2, FieldName3]
email_format: "html"
.........
alertsnapshot:
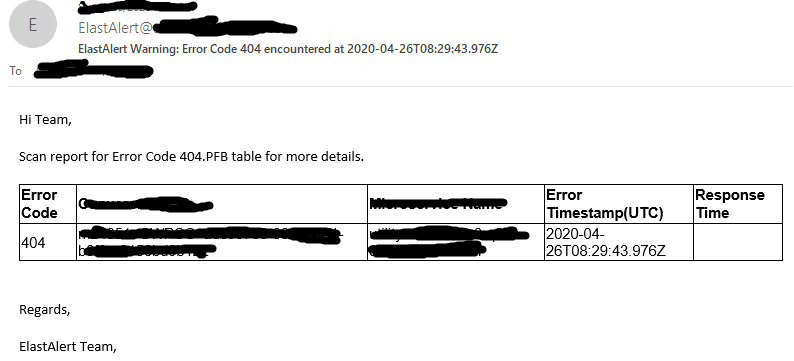
However, with the above approach, every time a match is encountered i am receiving an email alert. I am looking to send an aggregated alert in my case where matches are properly formatted in a table with salutation and signature, just like in snapshot above. I used summary_table_fields config but the output is misaligned and not very readable, also i am not able to add anything to alert email body. Kindly let me know what is that i am missing.
Thanks!
 rashmichoudhary07
on 26 Apr 2020
rashmichoudhary07
on 26 Apr 2020
@Qmando @Gee94 @sathishdsgithub
I have implemented aggregation. PFB the contents of my rule config file.
Alert when the rate of events exceeds a threshold
# (Optional)
# Elasticsearch host
# es_host: elasticsearch.example.com

# (Optional)
# Elasticsearch port
# es_port: 14900

# (OptionaL) Connect with SSL to Elasticsearch
#use_ssl: True

# (Optional) basic-auth username and password for Elasticsearch
#es_username: someusername
#es_password: somepassword

# (Required)
# Rule name, must be unique
name: Example frequency rule

# (Required)
# Type of alert.
# the frequency rule type alerts when num_events events occur with timeframe time
type: frequency

# (Required)
# Index to search, wildcard supported
index: elk_test2

# (Required, frequency specific)
# Alert when this many documents matching the query occur within a timeframe
num_events: 1

# (Required, frequency specific)
# num_events must occur within this amount of time to trigger an alert
timeframe:
  minutes: 120

aggregation:
  minutes: 5

#aggregation_key: 'fieldName1'

# (Required)
# A list of Elasticsearch filters used for find events
# These filters are joined with AND and nested in a filtered query
# For more info: http://www.elasticsearch.org/guide/en/elasticsearch/reference/current/query-dsl.html
filter:
- term:
    fieldName1: "404"

category: "Warning"

alert_subject: "ElastAlert {1}: Error Code {0} encountered at {2}"

alert_subject_args:
- fieldName1
- category
- "@timestamp"

alert_text_type: alert_text_only

alert_text: |
        <html>
        <body>
           <p style="text-align:left;">Hi Team,</p>
           <p>PFB table for more details.</p>
           <table style="font-family:arial, sans-serif;border-collapse:collapse;">
                <tr>
                 <th style="border:1px solid;text-align:left;">fieldName1</th>
                 <th style="border:1px solid;text-align:left;">fieldName2</th>
                 <th style="border:1px solid;text-align:left;">fieldName3</th>
                 <th style="border:1px solid;text-align:left;">Error Timestamp(UTC)</th>
                </tr>
                <tr>
                 <td style="border:1px solid;text-align:left;"> {} </td>
                 <td style="border:1px solid;text-align:left;"> {} </td>
                 <td style="border:1px solid;text-align:left;"> {} </td>
                 <td style="border:1px solid;text-align:left;"> {} </td>
                </tr>
           </table>
           <br/>
           <p style="text-align:left;">Regards,</p>
           <p style="text-align:left;">ElastAlert Team</p><br/>
        </body>
        </html>

alert_text_args: [fieldName1, fieldName2, fieldName3, "@timestamp"]

email_format: "html"

# (Required)
# The alert is use when a match is found
alert:
- "email"

# (required, email specific)
# a list of email addresses to send alerts to
email:
- "[email protected]"

#realert:
#  minutes: 0
However, the contents of alert body are now getting repeated for an aggregation time period.PFB snapshot for reference.
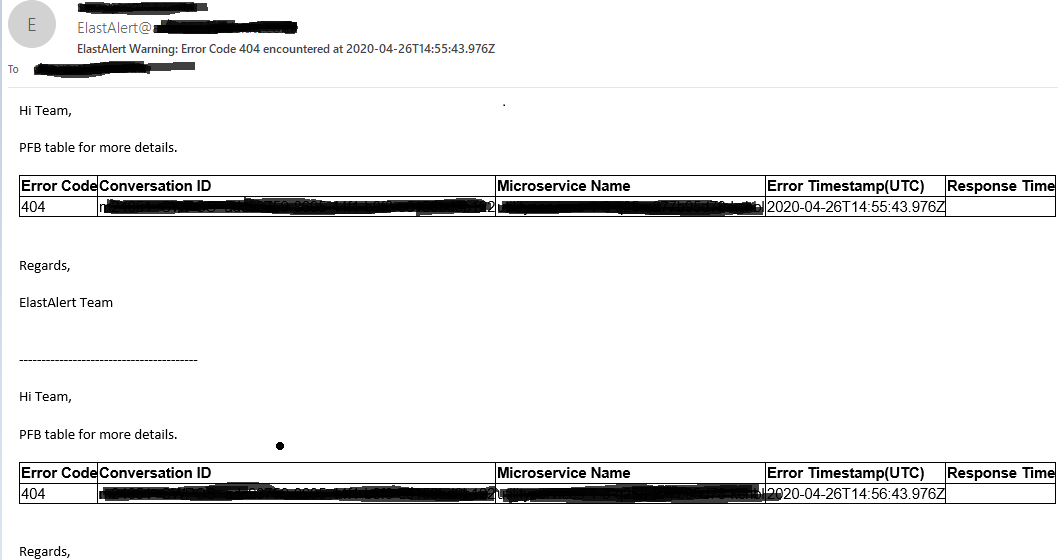
Is there any way to combine the aggregation results into one single table. I did check with summary_table_fields config but the output is misaligned and not very readable, also i am not able to add anything to alert email body. Please help!
rashmichoudhary07
on 26 Apr 2020
below is content of my alert_text config for reference:
alert_text: |
Hi Team,
PFB table for more details.
| fieldName1 | fieldName2 | fieldName3 | Error Timestamp(UTC) |
|---|---|---|---|
| {} | {} | {} | {} |
Regards,
ElastAlert Team
rashmichoudhary07
on 26 Apr 2020
Hi, unfortunately you can't easily do HTML formatting for aggregated alerts. You can generate a non-html table using summary_table_fields but this is limited to a very basic ascii table. You might be able to implement this using an enhancement but that requires writing your own code.
Qmando
on 27 Apr 2020
@Qmando
Thanks! ill check with the enhancement part if i am able to. Also does elastalert v0.2.4 support term aggregation or filter aggregation queries into rule files?
rashmichoudhary07
on 28 Apr 2020
@Qmando
Can we apply aggregation on filter results in elastalert like below elastic query:
GET /elk_test2/_search
{
"query": {
"bool": {
"must": {
"term": {
"log_json.response.statusCode": "404"
        }
    }
  }
},
 "aggs": {
  "uniq_convIds": {
    "terms": {
      "field": "log_json.transaction.conversationId.keyword",
      "size": 200
    }
  }
},
"size": 0
}
How to acheive this in rule file? This would be really helpful
rashmichoudhary07
on 28 Apr 2020
Just add aggregation_key: log_json.transaction.conversationId.keyword
Qmando
on 28 Apr 2020
Thanks @Qmando . This is helpful :)
rashmichoudhary07
on 30 Apr 2020
@paarth1995
Isn't the script you made useless?
And I think new questions should raise another issue.
 nsano-rururu
on 24 Mar 2021
nsano-rururu
on 24 Mar 2021
@nsano-rururu Heyyy!! Do you mean the query string i am searching for? That’s just an example.
I was hoping a bit more technical answer just so someone can explain how to render simple html with command attribute or through any other way since i am still learning. Also the issue was still open so decided to comment here. Thanks.
 paarth1995
on 24 Mar 2021
paarth1995
on 24 Mar 2021
@paarth1995
I thought that the contents of script.sh were strange rather than the rules.
I think it is better to include the contents of script.sh in the new issue. Note that few people answer issues because this project is not active.
nsano-rururu
on 24 Mar 2021
@nsano-rururu Thanks for the response nsano. I have created a new issue : https://github.com/Yelp/elastalert/issues/3156
paarth1995
on 24 Mar 2021
Related issues
 aromualdo
·
4Comments
aromualdo
·
4Comments
 wjk1982
·
3Comments
wjk1982
·
3Comments
 JeffAshton
·
3Comments
JeffAshton
·
3Comments
 tkumark
·
3Comments
tkumark
·
3Comments
 serialdoom
·
3Comments
serialdoom
·
3Comments