Docs: Memory management and best practices
Title
Fine-tune max-sql-memory best practice.
Description
Encountered getting Error: pq: windower-limited: memory budget exceeded: 112146104 bytes requested, 10240 currently allocated, 67108864 bytes in budget while running insert into fac_chrg select row_number() OVER () as fac_id,* from (select current_date(), random()::string, chrg_id from chrg_cd limit 7985445);
Outline
max-sql-memory describes how much RAM all SQL processors can take up on the whole cluster whereas sql.distsql.temp_storage.workmem is how much memory a single processor of a single query can use, so the former is “global” whereas the latter is “local”
There are couple other settings that describe how much memory joins and sorts can use before they are forced to spill to disk, but all other memory-intensive operations look at sql.distsql.temp_storage.workmem
cc https://cockroachlabs.slack.com/archives/C8HD41C82/p1575302414002600
potentially other issues to consolidate this:
Expected Audience
Developers and DBAs
 robert-s-lee
All 19 comments
@drewdeally @a-entin might be a worthwhile to write a blog on this. I can capture the info from YCBS and TPCC tests and start to gather some data points.
robert-s-lee
on 22 Jan 2020
ycsb perhaps not - no joins or query which use memory - not even sure on TPCC. I would think TPCH
 drewdeally
on 23 Jan 2020
drewdeally
on 23 Jan 2020
I need your expertise in investigating an explain query. It is necessary to understand whether this problem takes place?
The request is associated with error 532000 windower-limited: memory budget exceeded.
The graph was built from the message above.
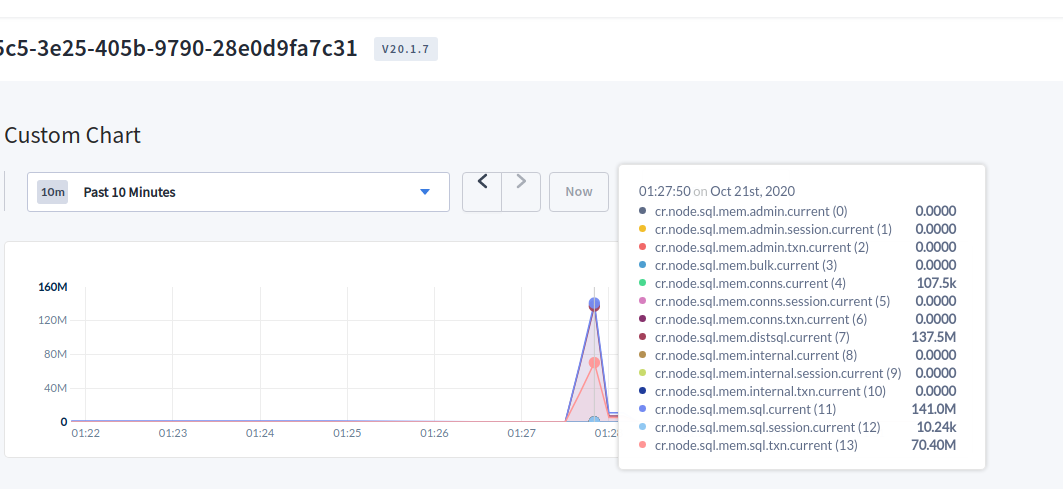
And how can the memory size for the window request be increased?
 intech
on 21 Oct 2020
intech
on 21 Oct 2020
We have a private cluster setting (i.e. not explicitly documented) sql.distsql.temp_storage.workmem that determines how much memory a single processor in the query can use before it must spill to disk or bail on the execution. By default it is 64MiB.
 yuzefovich
on 21 Oct 2020
yuzefovich
on 21 Oct 2020
@yuzefovich thanks!
Increasing to 100Mb solved the problem
SET CLUSTER SETTING sql.distsql.temp_storage.workmem = '100MB';
intech
on 22 Oct 2020
Is it possible to set this parameter by default somewhere? Or can it be configured only through a query?
intech
on 22 Oct 2020
Great to hear that it helped!
No, this cluster setting can only be changed via a query, but note that it is a "cluster setting" meaning that once set, it'll be that new value for all connections of the cluster.
yuzefovich
on 22 Oct 2020
@intech this can be verified by running show cluster setting sql.distsql.temp_storage.workmem;. The example below showing the difference between MB use to set and MiB used in show.
> SET CLUSTER SETTING sql.distsql.temp_storage.workmem = '100MB';
show cluster setting sql.distsql.temp_storage.workmem;
  sql.distsql.temp_storage.workmem
------------------------------------
  95 MiB


> SET CLUSTER SETTING sql.distsql.temp_storage.workmem = '100MiB';
SET CLUSTER SETTING

Time: 10.601ms

root@:26257/defaultdb> show cluster setting sql.distsql.temp_storage.workmem;
  sql.distsql.temp_storage.workmem
------------------------------------
  100 MiB
@robert-s-lee oh, good point!
intech
on 22 Oct 2020
@robert-s-lee tell me how the memory allocation in the window function will work:
- the required amount will be allocated depending on the ranges located on the node.
- the virtual table will be created on one of the nodes and the required memory limit will be needed only on this node.
- memory will be allocated on each node according to the virtual table
intech
on 22 Oct 2020
@intech here is some info. Keep in mind that we distribute the computation of the window function based on PARTITION BY clause (all rows belonging to the same partition must end up on the same node to be correctly processed, in general case), so if the query doesn't specify PARTITION BY, then all the computation is done on a single node (the gateway).
There are three big users of memory space when computing the window functions:
- we buffer up all the input data belonging to partitions that are assigned to the node, with no
PARTITION BYclause that will be all of the input data - we separate out those - possibly multiple - partitions on the node and compute window functions one partition at a time
- for every partition on the node we compute each window function and store the result of computation in memory.
Note that we don't emit any output until we have fully processed all window functions of all partitions on the node.
Going back to the discussion about the memory, we use disk-backed data containers for steps 1 and 2 (meaning that we can use temporary disk storage to store that data), but step 3 always keeps the result of computation of window functions in memory. It's likely that you're hitting a limit in that third step. Additionally, while looking through the code right now, I'm currently not sure whether we correctly fall back to disk in steps 1 and 2 in all of the cases (there might be a bug that would force us to mistakenly think we're still using the memory although we have spilled to disk and prevent new memory allocations for step 3 to occur even though they are within workmem limit), I'll need to double check that.
yuzefovich
on 22 Oct 2020
@yuzefovich Very detailed and helpful answer. Many thanks.
If there is new information, leave in this issue, please.
I have some questions about the operation of the window function, I noticed that indexes are not used and all data inside the window function itself is selected, although there is a where in the query and the result really comes filtered.
At the same time, I see that instead of using the where clause of 900k records, total records (2.7kk) are selected, and after that it filters.
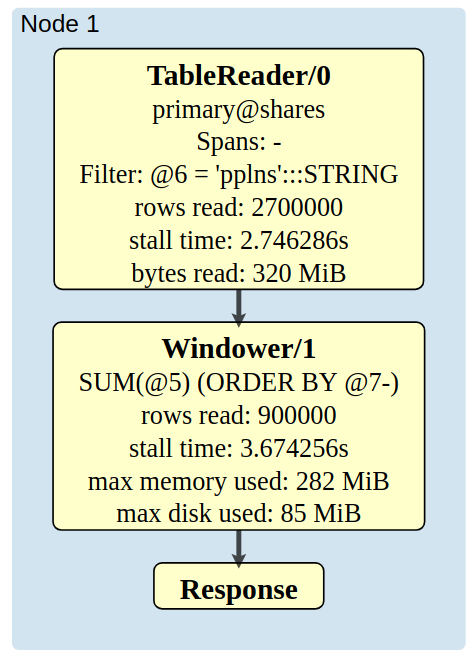
I tried to specify the index manually, then the request time increases several times, it selects 2 times. From the main index and specified by me and then combines from it.
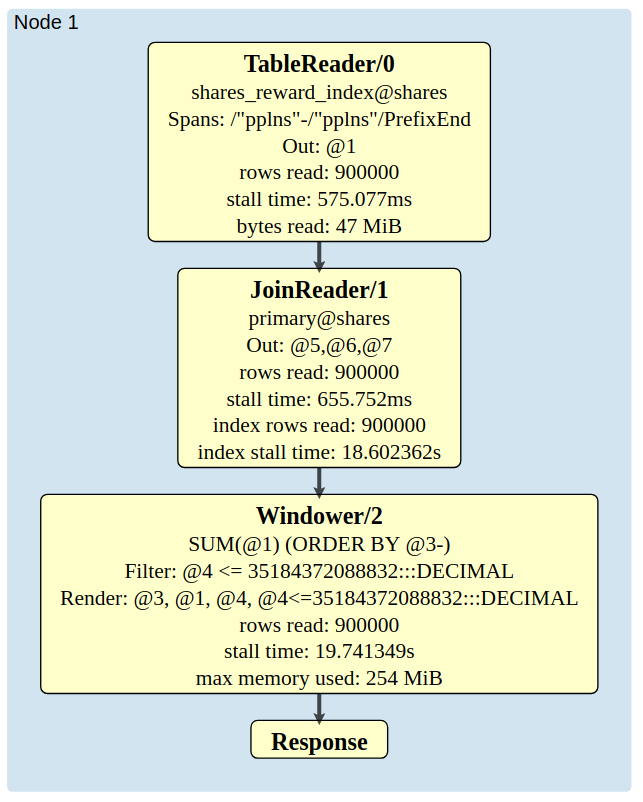
I don't understand why this is happening, and even more questions arise about the correctness of such behavior.
I purposely simplified the query to understand how the window function works
SELECT t.*, t.sum <= pow(2, 45)
from (
    SELECT s.created, s.difficulty, sum(s.difficulty) over (ORDER BY s.created DESC) as sum
    FROM shares s
    WHERE s.reward = 'pplns'
) t
where t.sum <= pow(2, 45)
DDL:
CREATE TABLE shares (
  uuid UUID NOT NULL DEFAULT gen_random_uuid(),
  difficulty INT8 NOT NULL,
  reward VARCHAR(10) NOT NULL,
  created TIMESTAMPTZ NOT NULL DEFAULT current_timestamp():::TIMESTAMPTZ,
  CONSTRAINT shares_pk PRIMARY KEY (uuid ASC),
  CONSTRAINT shares_rewards_fk FOREIGN KEY (reward) REFERENCES rewards(name) ON DELETE CASCADE ON UPDATE CASCADE,
  INDEX shares_auto_index_shares_users_fk ("user" ASC),
  INDEX shares_auto_index_shares_workers_fk (worker ASC),
  INDEX shares_auto_index_shares_blocks_fk (block ASC),
  INDEX shares_auto_index_shares_rewards_fk (reward ASC),
  INDEX shares_reward_index (reward ASC),
  INDEX shares_created_index (created ASC),
  FAMILY "primary" (uuid, difficulty, reward, created)
);
Windower processor itself doesn't read the data from disk at all - all scan operations are done by the TableReader processors, and it is up the optimizer to decide which index to use in order to scan all the required data (JoinReader also does scan operations).
In the first case, the optimizer chose to do a full table scan (on the primary index) with a filter on top, so that's why we see that 2.7m rows were read by the table reader but only 900k by the windower - other 1.8m were filtered out.
In the second case you forced the use of a secondary index, so now the optimizer used it for scanning, and the table reader scanned the desired 900k rows. However, that index doesn't contain all the columns that are needed to populate the end result (for window functions - arguments and ORDER BY clause - and for the final projection), so now we need to do a lookup join - from shares_reward_index we can only obtain reward and uuid columns, but we also need created and difficulty, so we are performing a lookup using uuid column into the primary index to get those. And regarding the running time, it appears that the optimizer correctly estimated that the second plan is less efficient and only the index hint forced it to use that.
Hope this makes sense.
yuzefovich
on 23 Oct 2020
@yuzefovich I can't remember the last time I received such prompt and high-quality support! You are best!
Based on your comment, I can make an index with the necessary storing(uuid, difficulty, created) fields and thereby reduce the number of readable records? Since this base is just a small test, in the original billions of records.
intech
on 23 Oct 2020
Yes, I believe if you make such an index, then that index should be used by the table reader and there will be no filtering needed. Glad I could help :)
yuzefovich
on 23 Oct 2020
@yuzefovich We have reduced the time several times! And this time the optimizer chose the correct index on its own
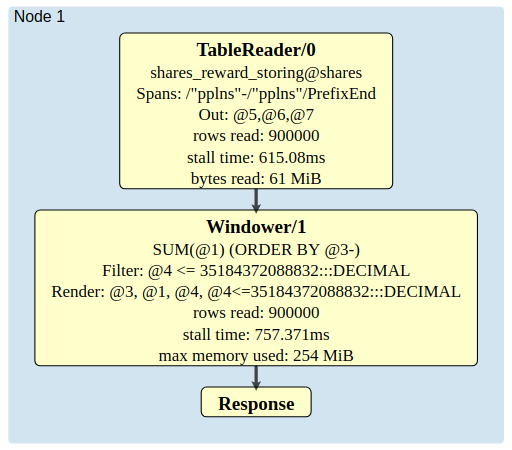
intech
on 23 Oct 2020
@drewdeally try SET CLUSTER SETTING sql.distsql.temp_storage.workmem = '100MB';
robert-s-lee
on 24 Dec 2020
@awoods187, @ianjevans, @ericharmeling, I think we need to think about a more holistic doc around memory management and best practices. I've renamed this issues accordingly, but if you feel this issue should remain more specific, please change back.
 jseldess
on 9 Mar 2021
jseldess
on 9 Mar 2021
Yes, I agree. It partners nicely with https://github.com/cockroachdb/docs/issues/7221 which we view as a p1 for this release.
 awoods187
on 10 Mar 2021
awoods187
on 10 Mar 2021
Related issues
jseldess
·
6Comments
 rmloveland
·
8Comments
jseldess
·
5Comments
rmloveland
·
8Comments
jseldess
·
5Comments
 sploiselle
·
3Comments
sploiselle
·
3Comments
 taroface
·
6Comments
taroface
·
6Comments
Most helpful comment
@yuzefovich We have reduced the time several times! And this time the optimizer chose the correct index on its own
