Dependency-cruiser: Issue: Very high memory usage on large projects
Hey there @sverweij 👋
This is mostly a notification of this issue I opened just now: https://github.com/webpack/enhanced-resolve/issues/229
Our usage of dependency-cruiser started running out of memory with the most recent versions.
I also used dependency cruiser on itself to do some memory profiling and it is somewhat representative of my use-case. According to chrome devtools, by the end of the run depcruise:report takes up about 270Mb (In my use-cases we're up to Gbs 😅 )
I started to track down what was taking up so much memory and it turns out it was the cached file system from enhanced-resolver.
I tried removing the cache and just using their filesystem. The memory usage went down but the perf impact was big. In my codebase without the cache depcruiser takes x3 the amount of time to finish.
I dug deeper and realised that even though you pass a duration of 4000 to CachedInputFileSystem, the cache is never cleared. This is because even though it supports sync calls, the mechanism that checks whether the duration has been exceeded only run asynchronously. So on the case of depcruiser, given that it runs completely synchronously, the clearing mechanism is never called throughout the duration of the command.
I hacked up a version of enhanced-resolver that synchronously clears the cache every at the end of sync calls if the duration is exceeded and I don't have memory issues anymore. The perf impact was relatively small, the command is only about 10s slower 🎉
So I opened this issue https://github.com/webpack/enhanced-resolve/issues/229 Hopefully, you'll only need to update the version of this lib 🤞
Thanks again for your work on this 👏
Expected Behavior
Current Behavior
Possible Solution
https://github.com/webpack/enhanced-resolve/issues/229
(Ideally, you/we won't have to rework everything to make async calls)
Steps to Reproduce (for bugs)
- Run
depcruise:reportwith--inspect-brk - Use Chrome devtools to get a heap snapshot before running and after its finished
- Most used up memory is coming from
CachedInputFileSystem
Context
depcruiser runs out of memory on my CI
Your Environment
 jomi-se
All 14 comments
hello again @jomi-se :-) Thanks for this detailed research and for raising the issue with enhanced-resolve 🙏 !
Dependency-cruiser does make a trade off of memory use against speed, but t.b.h. I wasn't aware the amounts were _that_ big. I'll see if it's possible to get that down (or make the trade-off configurable).
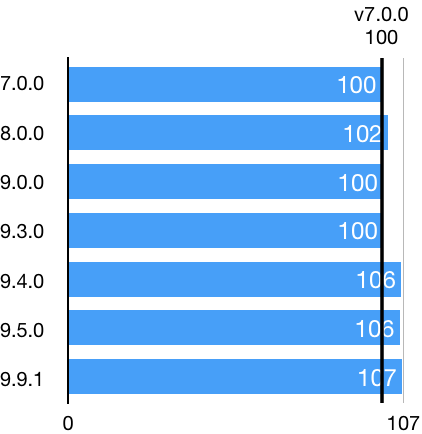
You also mention the out of memory problems started to occur with the more recent versions. That worries me a bit. I'll automate it on the CI if possible, so I can keep an eye on it and adapt when necessary. To check _how_ worried I should be I did a quick'n dirty comparison by running dc against itself with v7.0.0, v8.0.0, v9.0.0 and v9.9.1, and there _is_ indeed growth over time:
- There indeed _is_ an increase between dc versions (although that could partly be explained by an increase in the number of files cruised): ~410Mb for v7, gradually increasing to 470Mb for v9.9.1.
- I also ran v9.9.1 on itself on node 10, 12 and 14 and was surprised to learn the heap is 206Mb on node 10, 309Mb on node 12 and 468Mb (👀) on node 14 🤔
 sverweij
on 9 Jul 2020
sverweij
on 9 Jul 2020
@sverweij Thank you for also looking into this 🙏 I'm waiting to see if I get any reply from the maintainers of enhanced-resolve, if not I'll just propose a PR upfront 😅
There indeed is an increase between dc versions (although that could partly be explained by an increase in the number of files cruised): ~410Mb for v7, gradually increasing to 470Mb for v9.9.1.
If you wanted to verify that more precisely, you could have 2 local versions of the dependency-cruiser repo and call <first-clone>/bin/dependency-cruiser from inside the second target version. That way you can check the different versions of depcruiser to run but the target is constant.
A quick way to check memory consumption without using chrome devtools is (in OS X):
# from the root of the second dependency-cruiser repo clone
/usr/bin/time -l node ./<path-to-first-clone>/bin/dependency-cruise.js --output-type err-html --config -- src bin test configs types > dependency-violations2.html
The maximum resident set size will show the max total memory used by the node process. (In linux the version of the time command is different IIRC, I think the option to get similar outputs is -v)
jomi-se
on 10 Jul 2020
Thanks for that tip @jomi-se!
Measurements
I did some measurements against the same code base.
- 5 runs of each version of dependency-cruiser with node 14.5.0
(with a freshgit checkout vX.Y.Z && rm -rf node_modules && npm iand exactly the same dc invocation) - stuck the average of each of these runs in a table, took v7.0.0 as the baseline (100%) and stuck em in a bar graph:
This seems to indicate that version 9.4.0 introduced something that took 6% more memory. My hypothesis
is json5 - which was introduced in 9.4.0 for reading babel configs.
Research
Regardless, I've been looking into bringing the amount of memory used down- both the maximum and the amount at the end of a run. As it turns out, calling (enhanced resolve's) cached file system's purge() frees up memory.
I played with calling it every _n_ resolves, starting with _n = 10_ and the result is _very_ visible in the node debugger:
- during the run the js heap peaks at ~100Mb (vs 250Mb with no purge calls)
- at the end of the run the js heap is ~45Mb (vs 250Mb with no purge calls)
- it _is_ running slower, though (~1.3x)
I'll let a night's sleep pass over it and try with higher values of _n_ tomorrow, but it does look promising...
And: someone from the webpack team confirmed the memory leak you found 👍
sverweij
on 10 Jul 2020
Thanks for looking into this @sverweij !
I was about to open a PR for the issue in enhanced-resolve but it turns out the already merged a fix for it 🎉 🎉 https://github.com/webpack/enhanced-resolve/pull/230
No idea when it will be released though but I tested using their branch (the only minor change needed is that you have to pass node's fs module directly instead of using the old enhancedResolve.NodeJsInputFileSystem) and I get 2 very nice improvements:
- 74% decrease in max memory usage (from ~2.3Gb to 600Mb)
- 17% decrease in time to analyse my whole repository 🎉 🎉
So we get both a perf improvement and also a cache that is cleared internally without any tweaks on the client side 🎉 🎉
I think one can tweak the cache duration to find a balance between memory x cpu but I'm pretty happy with the result
jomi-se
on 15 Jul 2020
On my repo I can go as low as 1s for the cache duration before I start seeing any performance decreases, so that seems like pretty good news 🎉 🎉
jomi-se
on 15 Jul 2020
@sverweij Thinking about it, that cache duration setting is probably something worth being able to tweak on a per-project basis (especially for really big codebases). Would it be possible to make it configurable?
Btw, I think you're right in terms of not being a big increase on memory usage over time by dependency-cruiser. Our memory usage on my end was already high and it probably was just some recent changes on our side that made it go over the threshold.
jomi-se
on 15 Jul 2020
hi @jomi-se
- First of webpack/enhanced-resolve#230 looks like great news. I'm for sure going to play with it tonight. First measurements indicate a 30% performance boost. 🎉
- For max memory usage I see a similar value as you do - just wonder why(1) it's still that big (even with a timeout of 1000ms) and (2) why it stays allocated after the run (600Mb is better than 2.3Gb, but it's still a lot ...). I'll put a filesystem.purge() after extraction is done - that should bring the memory allocated after the run back to normal proportions. When running dc against itself still ~50Mb remains instead of the 111Mb without the purge call.
- Based on the results you get with the timeout value I'll re-assess the default with both smal (dc) and big-ish (react) projects. Based on what I've seen so far it's likely to become smaller (~1s) rather than larger.
- I'll definitely consider making the timeout configurable - either via the webpack config (by making the cached file system overridable) or in a separate option.
(and thanks for your elaborate research - it's very helpful!)
sverweij
on 15 Jul 2020
hi @jomi-se
- First of webpack/enhanced-resolve#230 looks like great news. I'm for sure going to play with it tonight. First measurements indicate a 30% performance boost. 🎉
Great news 🎉 🎉
- For max memory usage I see a similar value as you do - just wonder why(1) it's still that big (even with a timeout of 1000ms) and (2) why it stays allocated after the run (600Mb is better than 2.3Gb, but it's still a lot ...).
My thoughts on this are that it's mainly related to the internal cache being a time-based cache. The faster the machine it runs on, the more calls that can be fit into the set cache duration, so the more memory that ends up being taken up by the cache. So in theory, the amount of memory this kind of cache can take up is only bounded by the speed of machine it is being run on. From what I saw when I was investigating the memory issue, the resolver tries to find a lot of different files that don't necessarily exist for a single path (e.g. for './moduleA' it will try things like 'moduleA/index.js, then moduleA.js, then moduleA/package.json, etc). Each of the ones that return an error because they don't exists are also cached, so it adds up quickly.
Something like an LRU-cache (least-recently-used) would keep the memory bounded and also keep in cache the calls that end up being repeated the most.
I'll put a filesystem.purge() after extraction is done - that should bring the memory allocated after the run back to normal proportions. When running dc against itself still ~50Mb remains instead of the 111Mb without the purge call.
Indeed, if the resolver will not be called anymore after some point but dc still has some work to do, this can be a nice addition 👍
- Based on the results you get with the timeout value I'll re-assess the default with both smal (dc) and big-ish (react) projects. Based on what I've seen so far it's likely to become smaller (~1s) rather than larger.
- I'll definitely consider making the timeout configurable - either via the webpack config (by making the cached file system overridable) or in a separate option.
Gracias! 🙏
(and thanks for your elaborate research - it's very helpful!)
And thank you for your work on this <3
jomi-se
on 16 Jul 2020
If you're interested in doing some experimentation with what an LRU cache would look like you can check out the branch in this pull request https://github.com/jomi-se/enhanced-resolve/pull/1 (you can add it to your local dependencies by changing enhanced-resolve's version to:
"enhanced-resolve": "jomi-se/enhanced-resolve#lru-cached-filesystem"
It's interesting to change the cache_duration value passed (which now would mean "cache size") and checking the cache hits/misses on different projects (they are commented out in the branch).
jomi-se
on 16 Jul 2020
Thanks @jomi-se - I'll try it in the weekend. Theoretically an LRU could be beneficial for enhanced-resolve/ webpack as well, right? Still fast & memory usage that is predictable?
B.t.w. I've published
[email protected]that uses enhanced-resolve from its master branch (pinned to a commit) and does some additional clean ups. Against react it brings max js heap size use back from 1.5Gb to ~200Mb; at the end of the run it still uses ~44Mb + it's indeed faster (30s vs 45s ...)
sverweij
on 17 Jul 2020
@jomi-se there's a [email protected] out that uses ehr's latest beta release, and which incorporates a way to tweak the cache duration; see the linked PR for details.
sverweij
on 19 Jul 2020
@sverweij Thank you! We decided to go ahead and start using that beta on our CI.
Concerning one of the dilemmas: FWIW I don't think it's all that useful for this project to allow passing in all possible options for something like the underlying fs. It is useful as a way to manage memory consumption in this case, but more than that is also a door for complexity creep.
jomi-se
on 20 Jul 2020
Hi @jomi-se - the PR is merged and is now part of [email protected].
One thing to note: after running it against another reasonably large repo (5k modules/ 20k dependencies) there was a quite noticeable difference in running time between 1000ms and 4000ms. This might have been due to the corporate virus scanner running on that disk, but real life enough to put the default back to 4000ms.
I'm b.t.w. still interested in using your LRU-cache implementation, but haven't had time yet :-/
sverweij
on 27 Jul 2020
@sverweij Thanks for the heads-up! 👍
I'll take the config locally to get the best result. Thanks a lot for looking into this
jomi-se
on 3 Aug 2020
Related issues
 gaggle
·
4Comments
gaggle
·
4Comments
 Ivanca
·
4Comments
Ivanca
·
4Comments
 fabb
·
3Comments
fabb
·
3Comments
 atav32
·
5Comments
atav32
·
5Comments
 heurtemattes
·
10Comments
heurtemattes
·
10Comments
Most helpful comment
@jomi-se there's a
[email protected]out that uses ehr's latest beta release, and which incorporates a way to tweak the cache duration; see the linked PR for details.