Hi!
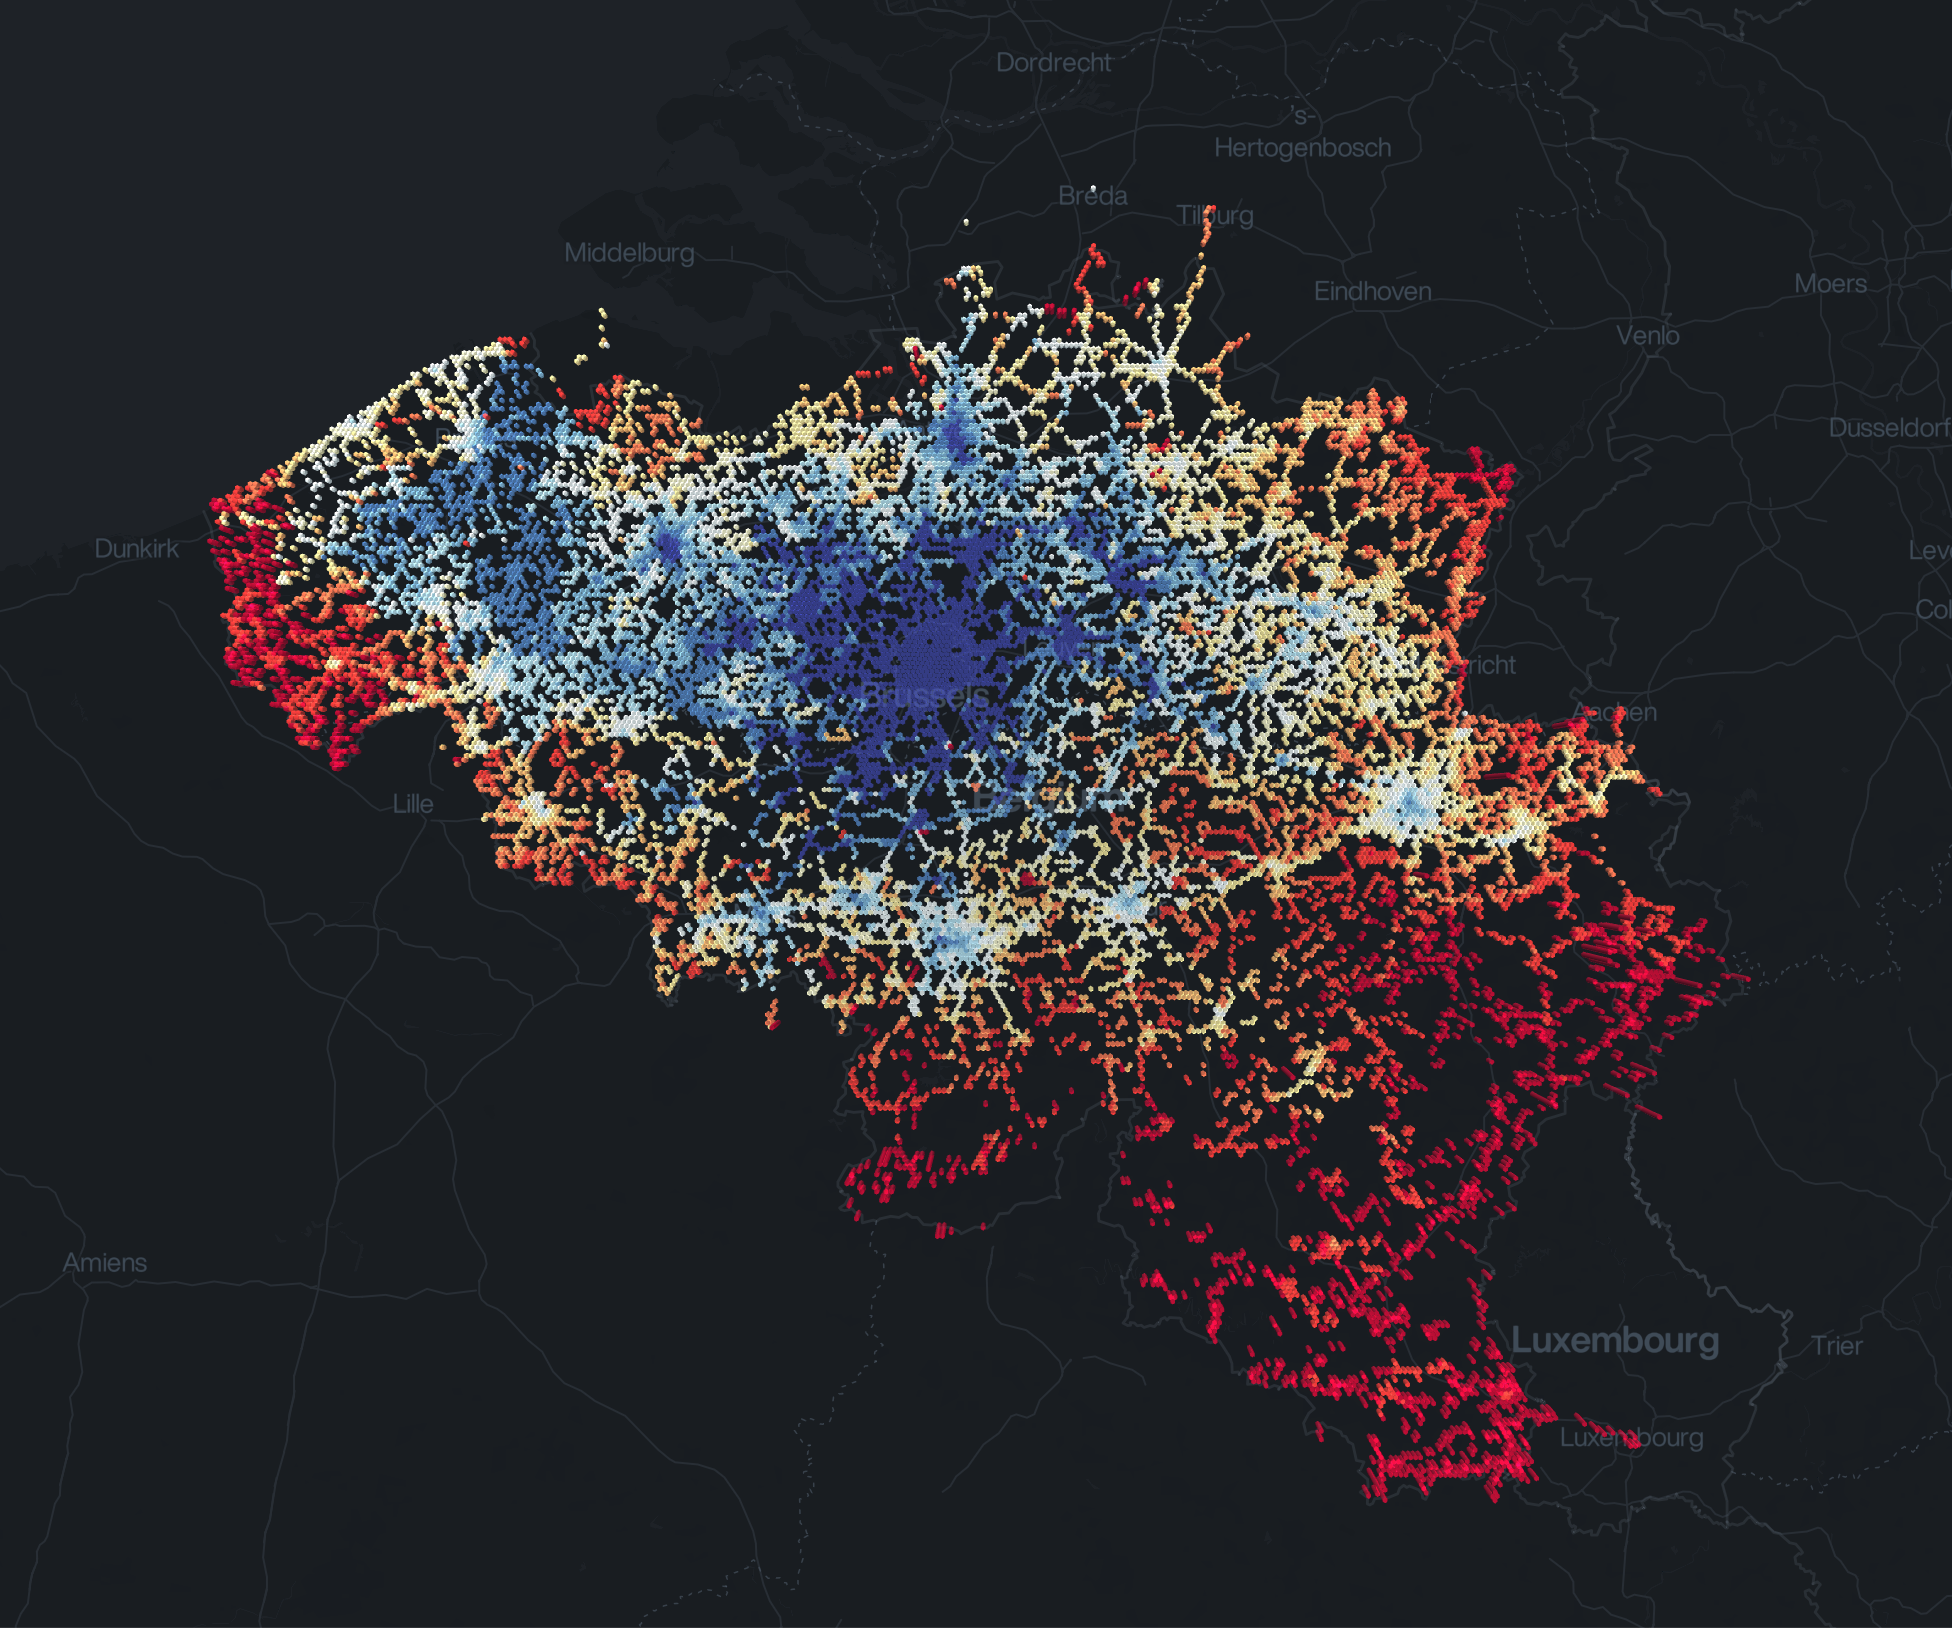
I've been trying to make a HexagonLayer reproducing a visualization I made in Kepler.
My dataviz looks like so:

Here's the result I managed to get in Deck:
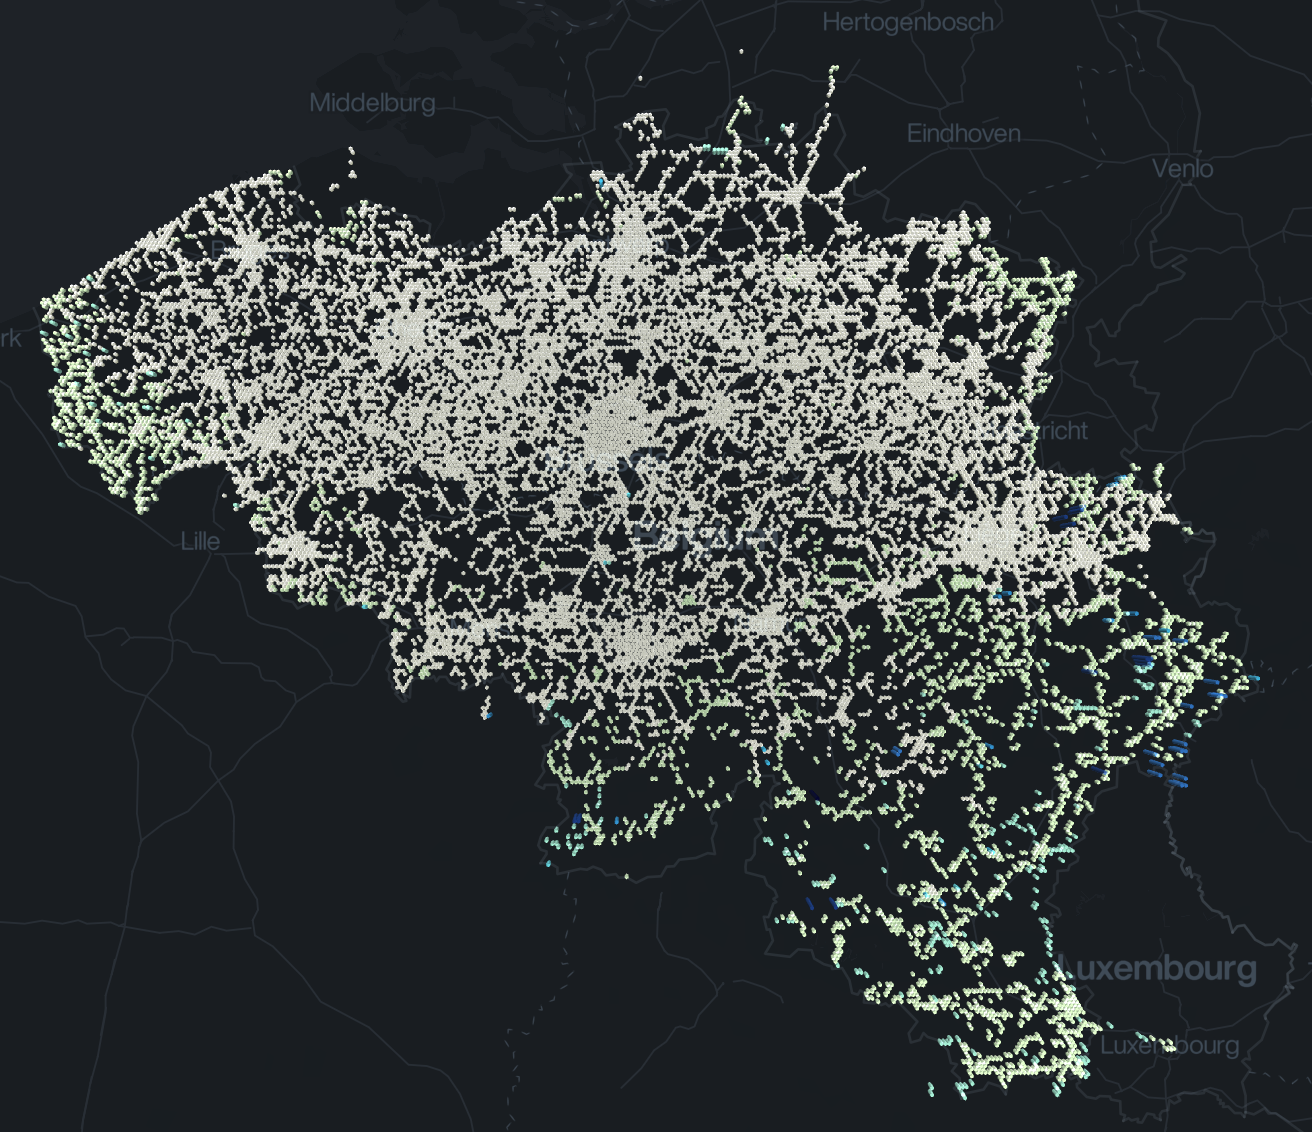
It seems I'm having an issue with getColorValue, since I only have a very small part that's colored, and it's the highest values I have. Here's my current layer setup:
getMean(pts, key) {
  const filtered = pts.filter(pt => Number.isFinite(pt.properties[key]));
  return filtered.length
    ? filtered.reduce((accu, curr) => accu + curr.properties[key], 0) / filtered.length
    : null;
}

getColorValue(points) {
  return getMean(points, 'duration');
}

new HexagonLayer({
  id: data.fromPoint.id,
  colorRange: [
    [255, 255, 217],
    [202, 234, 180],
    [143, 211, 186],
    [80, 186, 195],
    [43, 156, 193],
    [34, 126, 183],
    [34, 96, 169],
    [26, 70, 138],
    [17, 46, 109],
    [5, 25, 77],
    [0, 0, 39],
  ],
  data: data.scores.features,
  getPosition: d => d.geometry.coordinates,
  getColorValue: this.getColorValue,
})
The getColorValue function was taken from an example found in this repo and does seem to work according to logs. Well maybe not, I'm not sure haha
 mathieudelvaux
All 4 comments
@heshan0131
 Pessimistress
on 28 May 2019
Pessimistress
on 28 May 2019
Your getColorValue prop setting seems fine, it will return the mean value for all aggregated points.
Are you using same operation (Mean) for your original visualization? Also is the colorRange prop same in both?
Also , kepler.gl supports Quantile scaling by default and deck.gl uses Quantize by default and doesn't' support Quantile. We are working on adding this support to deck.gl.
 1chandu
on 28 May 2019
1chandu
on 28 May 2019
kepler.gl extended deck.gl hexagon layer to add support for Quantile color scale:
https://github.com/keplergl/kepler.gl/blob/master/src/deckgl-layers/hexagon-layer/enhanced-hexagon-layer.js
 heshan0131
on 28 May 2019
heshan0131
on 28 May 2019
Thank you so much for enlightening me, @heshan0131 & @1chandu! I implemented the Kepler.gl color scaling and managed to get exactly the right result in Deck.gl!
mathieudelvaux
on 2 Jun 2019
Related issues
 mayteio
·
3Comments
mayteio
·
3Comments
 pybokeh
·
3Comments
pybokeh
·
3Comments
 TareqAlqutami
·
3Comments
TareqAlqutami
·
3Comments
 ibesora
·
4Comments
ibesora
·
4Comments
 nagix
·
3Comments
nagix
·
3Comments