Datadog-agent: Custom metrics, metric value calculations and HPA target values
The example given here - https://github.com/DataDog/datadog-agent/blob/master/Dockerfiles/manifests/cluster-agent/hpa-example/hpa-manifest.yaml - has the following:
  metrics:
  - type: External
    external:
      metricName: nginx.net.request_per_s
      metricSelector:
        matchLabels:
          kube_container_name: nginx
      targetAverageValue: 9
Which I understand to mean:
Get the metric
nginx.net.request_per_s, filtered bykube_container_name=nginx. Divide this value by the current number of pods. Compare withtargetAverageValue, ie 9. Scale appropriately.
I think the step here that I don't fully understand is the "get the metric" bit, and in particular how this works for different types of metrics, and how these are aggregated from their sources.
Eg: for a "requests per second" metric (like nginx.net.request_per_s, a gauge), I would expect this to mean:
Add together the latest value of this metric from each source
But for a "number of requests" metric (like php_fpm.requests.accepted, a count), I would maybe expect/hope this to mean something like:
Add together the latest value of this metric from each source, subtract the value of this metric from x seconds ago, divide that difference by x.
That is, to convert a count into a rate. But is this what actually happens? I definitely don't want to scale number of pods on the total value of the count, and I want to understand the units of the the rate if it is rate-ifying it - is it always per second?
And further to this, how are other metric types handled?
It may well be that this is all or largely general StatsD behaviour rather than strictly Datadog behaviour, so I'm happy to be linked to a relevant bit of StatsD documentation, supposing Datadog matches this behaviour.
 plumdog
All 29 comments
Hello @plumdog,
Apologies for the delay in answering here, I missed this issue.
The way we designed the External Metrics Provider was based on metrics available in Datadog, to be as "user friendly" as possible.
Technically, anything that you see in Datadog can be used to autoscale your deployments.
Now, metrics have types as you eluded toand they also have metadata. For metrics that are collected by one of our integrations, you can see those types and metadata in our doc (or with more details in the integrations-core repo. For custom metrics, the types depend on the methods you use to submit the metrics.
Example:
nginx metrics: the official doc and the metadata doc
we can see that nginx.net.request_per_s represents requests per second. It is submitted as a rate. Note that it shows up as a gauge in the app, you can read more about that here:
- https://docs.datadoghq.com/developers/metrics/rates/
- https://docs.datadoghq.com/developers/metrics/#submission-types-and-datadog-in-app-types
As for the aggregation part, it indeed uses the same aggregation as the one in Datadog, so you can use avg, sum, max etc, on the cluster agent depending on what you want to achieve, the aggregation will occur over the scope you set (label selector).
While this might seem complicated, it boils down to:
- Selecting the metric you want to use and get the visual feedback into your account:

- Create the manifest that corresponds:
apiVersion: autoscaling/v2beta1
kind: HorizontalPodAutoscaler
metadata:
name: nginxext
spec:
minReplicas: 1
maxReplicas: 3
scaleTargetRef:
apiVersion: apps/v1
kind: Deployment
name: nginx
metrics:
- type: External
external:
metricName: nginx.net.request_per_s
metricSelector:
matchLabels:
app: puppet
targetValue: 2300
- The cluster agent will automatically (thanks to informers) pick up the HPA, process it and start getting the metrics from your account.
- Then, you can observe the value fed to Kubernetes:
➜ ~ kubectl describe hpa nginxext
Name: nginxext
Namespace: default
Labels: <none>
Annotations: kubectl.kubernetes.io/last-applied-configuration:
{"apiVersion":"autoscaling/v2beta1","kind":"HorizontalPodAutoscaler","metadata":{"annotations":{},"name":"nginxext","namespace":"default"}...
CreationTimestamp: Wed, 12 Dec 2018 12:00:10 -0500
Reference: Deployment/nginx
Metrics: ( current / target )
"nginx.net.request_per_s" (target value): 2589 / 2300
Min replicas: 1
Max replicas: 3
Deployment pods: 3 current / 3 desired
targetAverageValue and avg
You also mentioned the targetAverageValue option. As opposed to targetValue it means that Kubernetes will divide the value retrieved from the cluster agent by the number of replicas in the deployment you targeted.
The avg aggregator on the cluster agent though, is the regular space aggregator that averages over pods or availability zone or role, depending on your metric (more details here).
In a nutshell, using a metric that is averaged by pods in Datadog and use targetAverageValue might be redundant, but could make sense if other boxes are contributing to the metric (maybe outside of your Kubernetes cluster thus making the use of External relevant).
On custom metrics
To wrap this up, if you are using custom metrics / statsd metrics, the same rule applies, the cluster agent will expose the values you see in Datadog. As you need to submit the metrics with a certain method, this will set the type and from then on you can use the aggregator of your choice (in Datadog and in the cluster agent).
Let me know if I am missing your point, I really appreciate your feedback and I will work with the documentation team to try to make this more clear.
Best,
.C
 CharlyF
on 5 Jan 2019
CharlyF
on 5 Jan 2019
Thanks for the detailed answer @CharlyF, I do have a follow-up question.
I'm also bugged by the same issue and I'm having a hard time to figure out how to configure the HPA to work with Istio mesh metrics.
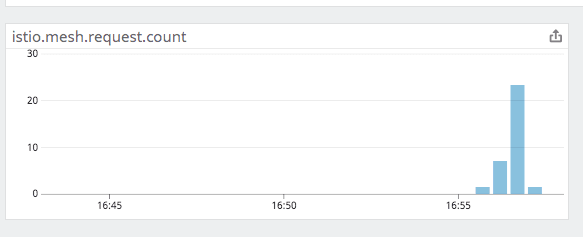
I have the datadog <> istio integration setup and working and would like to perform HPA based on the istio.mesh.request.count metric.
But this metric is only increasing over time and do not represent a rate. Here are 2 graphs for this metric, one with the per_second rate function applied:

How would you use the rated metric in HPA? Since the following does not seem to work:
- type: External
external:
metricName: per_second(istio.mesh.request.count)
metricSelector:
matchLabels:
destination_app: nginx
targetAverageValue: 5
Thanks
 gottfrois
on 27 Jun 2019
gottfrois
on 27 Jun 2019
Hey @gottfrois, thanks for sharing - indeed using the Datadog time aggregator per_second will not work as we add the space aggregator ( avg, sum etc) after parsing the HPA manifest.
We are working towards a more flexible way of specifying queries and will be more than happy to keep you posted as we make progress. (cc @xlucas)
In the interim, the short term solution is to update the integration to submit this value as a rate instead of a monotonic count.
Could you file an issue to add this metric on the integrations-core repo by any chance ? The team should be able to assess if this metric should/can be added.
Best,
.C
CharlyF
on 27 Jun 2019
@CharlyF looks like there is an annotation called send_monotonic_counter:true|false which control this somehow https://github.com/DataDog/integrations-core/issues/3725
I'll give it a try.
gottfrois
on 2 Jul 2019
Setting send_monotonic_counter: true into the istio instance configuration sends the metrics as a rate
I'm going to test if this value can then be used for HPA
gottfrois
on 2 Jul 2019
I confirm that using this new metric work as expected in HPA and I was able to auto-scale based on the rate of istio.mesh.request.count
gottfrois
on 2 Jul 2019
Thanks for letting us know @gottfrois !
I will leave this issue opened for the time being, but will close as soon as we release the fix.
Best,
.C
CharlyF
on 3 Jul 2019
Hi, @gottfrois, @CharlyF
I have one more questing as I want to understand why not all the datadog metrics are being processed by datadog-cluster-agent
I have AKS 1.13.5 with configured datadog-cluster-nodes and datadog-cluster-agent. Also, I've configured hpa using the following articles:
- https://www.datadoghq.com/blog/autoscale-kubernetes-datadog/
- https://github.com/DataDog/datadog-agent/blob/master/docs/cluster-agent/CUSTOM_METRICS_SERVER.md
When I use kubernetes metrics from datadog, such as kubernetes.cpu.usage.total or kubernetes.memory.usage it works for me with the following example config:
````yaml
apiVersion: autoscaling/v2beta1
kind: HorizontalPodAutoscaler
metadata:
name: myapp-autoscaler
spec:
minReplicas: 1
maxReplicas: 3
scaleTargetRef:
apiVersion: apps/v1
kind: Deployment
name: myapp
metrics:
- type: External
external:
metricName: kubernetes.cpu.usage.total
metricSelector:
matchLabels:
environment: d11
targetAverageValue: 70
````
But, when I am trying to use Datadog metrics from azure (for example: azure.servicebus_namespaces.count_of_active_messages_in_a_queue_topic. or azure.vm.network_out_total, etc.) it's not works for me.
In this case my HorizontalPodAutoscaler returns the following error:
````
Type Status Reason Message
---- ------ ------ -------
AbleToScale True SucceededGetScale the HPA controller was able to get the target's current scale
ScalingActive False FailedGetExternalMetric the HPA was unable to compute the replica count: unable to get external metric default/azure.servicebus_namespaces.count_of_active_messages_in_a_queue_topic./&LabelSelector{MatchLabels:map[string]string{environment: d11,},MatchExpressions:[],}: no metrics returned from external metrics API
Type Reason Age From Message
---- ------ ---- ---- -------
Warning FailedComputeMetricsReplicas 10m (x12 over 13m) horizontal-pod-autoscaler failed to get external metric azure.servicebus_namespaces.count_of_active_messages_in_a_queue_topic.: unable to get external metric default/azure.servicebus_namespaces.count_of_active_messages_in_a_queue_topic./&LabelSelector{MatchLabels:map[string]string{environment: d11,},MatchExpressions:[],}: no metrics returned from external metrics API
Warning FailedGetExternalMetric 3m22s (x41 over 13m) horizontal-pod-autoscaler unable to get external metric default/azure.servicebus_namespaces.count_of_active_messages_in_a_queue_topic./&LabelSelector{MatchLabels:map[string]string{environment: d11,},MatchExpressions:[],}: no metrics returned from external metrics API
````
On the other hand datadog-cluster-agent status shows the metric available, but not valid:
    External Metrics
    ----------------
      Total: 1
      Valid: 0
      hpa:
      - name: myapp-autoscaler
      - namespace: default
      - uid: bc27de70-9e76-11e9-8f50-4a2d4a468e74
      labels:
      - environment: d11
      metricName: azure.servicebus_namespaces.count_of_active_messages_in_a_queue_topic.
      ts: 1.562257888e+09
      valid: false
      value: 283.3
What am I doing wrong?
 shopskyi
on 4 Jul 2019
shopskyi
on 4 Jul 2019
Hey @shopskyi, thanks for your question.
It is likely that the issue is tied to the granularity of your metrics - Indeed, while metrics such as kubernetes.cpu.usage.total or kubernetes.memory.usage are collected by the agent at a 15 seconds interval, the cloud provider ones (such as aws or azure or gcp) are crawled less frequently.
One should expect a delay when using those metrics, as explained in this article.
The cluster agent will only be exposing metrics to the HPA Controller that are "fresh" this is simply so that if there is a delay in the pipeline, your workloads are not autoscaled unexpectedly.
This threshold can be configured however, using: DD_EXTERNAL_METRICS_PROVIDER_BUCKET_SIZE.
Setting this value to 1500 should help here as the size of the bucket queried by the cluster agent will contain values so that you can configure your HPAs.
It is important to keep in mind that using crawler based metrics will result in delays in your autoscaling pipeline.
Let us know if you still have issues, we would be happy to further investigate.
Best,
.C
CharlyF
on 8 Jul 2019
@CharlyF Thanks for answer, but seems like it's not a working solution to have 1500 seconds (25 minutes) delay before auto-scaling. What is the minimum value for DD_EXTERNAL_METRICS_PROVIDER_BUCKET_SIZE to support external Datadog (Azure) metrics?
shopskyi
on 15 Jul 2019
@shopskyi the parameter DD_EXTERNAL_METRICS_PROVIDER_BUCKET_SIZE allows the Datadog Cluster Agent to request a larger bucket of data, so it does not affect the delay per se.
The only source of delay is from the Azure integration (explained in the article I shared in my previous message). You could theoretically decrease it to 600, but 1500 has proven to work correctly for users leveraging aws/gcp/azure metrics.
CharlyF
on 15 Jul 2019
Thanks for your fast answer, but it seems like doesn't work for me (with DD_EXTERNAL_METRICS_PROVIDER_BUCKET_SIZE:1500). I've opened the ticket https://help.datadoghq.com/hc/en-us/requests/236643
shopskyi
on 15 Jul 2019
Ah, okay I'm sorry to hear that.
I'll sync with the team!
CharlyF
on 15 Jul 2019
@CharlyF looks like there is an annotation called
send_monotonic_counter:true|falsewhich control this somehow DataDog/integrations-core#3725I'll give it a try.
That only applies to Istio however right? I don't see how that would solve the issue using nginx.net.request_per_s.
 andysnowden
on 22 Jul 2019
andysnowden
on 22 Jul 2019
👋 This specific option is for the monotonic count indeed (always growing) but as the metric nginx.net.request_per_s is a rate there is no need to apply an option to not use an ever increasing value. (I am linking to the code as I just noticed that the doc indicates that this is a gauge, I told the docs team so we can fix it).
The way we designed the External Metrics Provider is to have it as transparent as possible - So the value you see when graphing a metric in Datadog is the value that will be used to autoscale (note: the last value). By default we use avg as a space aggregator (across the sources of the metric) but this can be configured (configuration is applied to all metrics however).
CharlyF
on 22 Jul 2019
Thanks @CharlyF ,
The way we designed the External Metrics Provider is to have it as transparent as possible - So the value you see when graphing a metric in Datadog is the value that will be used to autoscale (note: the last value). By default we use avg as a space aggregator (across the sources of the metric) but this can be configured (configuration is applied to all metrics however).
Can you link where in the doc you can configure the global default? The majority of my custom metrics need to use sum. It would be nice in the future if we could configure it on a per-metric basic. Perhaps with a custom annotation or something, is there a existing ticket/issue for that functionality?
andysnowden
on 22 Jul 2019
Of course, it's DD_EXTERNAL_METRICS_AGGREGATOR you can set it to sum as per the config here, but listed here in the doc.
I completely agree with you on the per metrics basis. We could not introduce it at first as the metric_name supported by HPAs does not support : but we are currently working on an operator to extend the HPA controller.
If you are interested feel free to shoot me an email [email protected], so we can keep you updated on this project!
CharlyF
on 23 Jul 2019
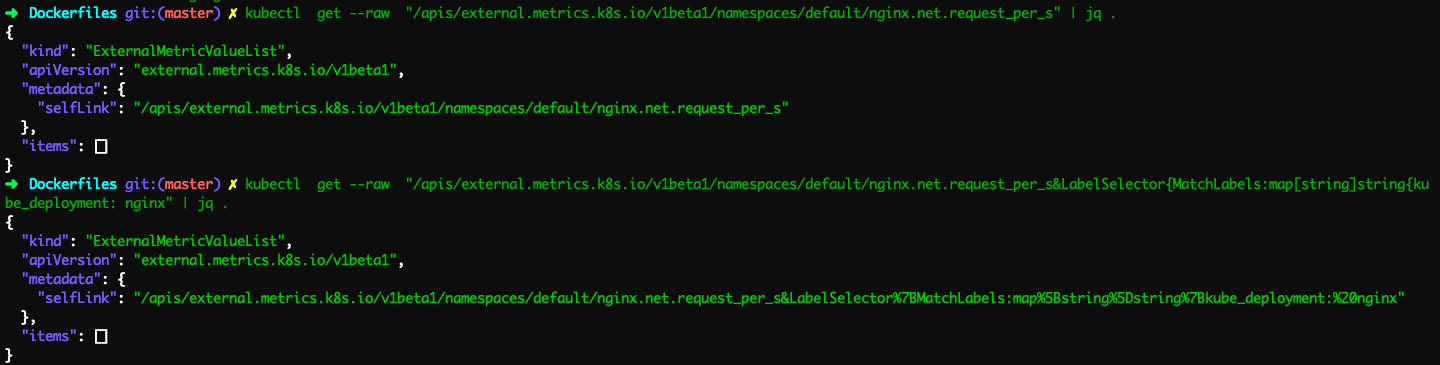
Hi @CharlyF I ma following your blog: https://www.datadoghq.com/blog/autoscale-kubernetes-datadog/ and trying the same on GKE setup. I am able to see all the metric on DD dashboards but the HPA is not working. Getting the following error:
➜ Dockerfiles git:(master) ✗ kubectl describe hpa nginxext
Name: nginxext
Namespace: default
Labels:
Annotations: kubectl.kubernetes.io/last-applied-configuration:
{"apiVersion":"autoscaling/v2beta1","kind":"HorizontalPodAutoscaler","metadata":{"annotations":{},"name":"nginxext","namespace":"default"}...
CreationTimestamp: Fri, 30 Aug 2019 15:35:31 +0700
Reference: Deployment/nginx
Metrics: ( current / target )
"nginx.net.request_per_s" (target average value):
Min replicas: 1
Max replicas: 3
Deployment pods: 1 current / 0 desired
Conditions:
Type Status Reason Message
---- ------ ------ -------
AbleToScale True SucceededGetScale the HPA controller was able to get the target's current scale
ScalingActive False FailedGetExternalMetric the HPA was unable to compute the replica count: unable to get external metric default/nginx.net.request_per_s/&LabelSelector{MatchLabels:map[string]string{kube_deployment: nginx,},MatchExpressions:[],}: no metrics returned from external metrics API
Events:
Type Reason Age From Message
---- ------ ---- ---- -------
Warning FailedComputeMetricsReplicas 28m (x12 over 31m) horizontal-pod-autoscaler failed to get nginx.net.request_per_s external metric: unable to get external metric default/nginx.net.request_per_s/&LabelSelector{MatchLabels:map[string]string{kube_container_name: nginx,},MatchExpressions:[],}: no metrics returned from external metrics API
Warning FailedGetExternalMetric 67s (x121 over 31m) horizontal-pod-autoscaler unable to get external metric default/nginx.net.request_per_s/&LabelSelector{MatchLabels:map[string]string{kube_container_name: nginx,},MatchExpressions:[],}: no metrics returned from external metrics API
But the same metric is available on the DD dashboard

So is this because of the support for same in GKE or it is something else?
The external metric value :
Also, the datadog-cluster-agent status shows none external metric:

 sagarpatil23192
on 30 Aug 2019
sagarpatil23192
on 30 Aug 2019
Hey @sagarpatil23192 thanks for sharing.
I think this might be different than the issue raised here, but we need to further investigate.
Could you open a ticket with our solution team ?
Thanks!
.C
CharlyF
on 3 Sep 2019
@CharlyF Thanks for the helpful responses, I was very lost on how to achieve this! I too would be interested in per metric aggregation. Would there be any interest in allowing the metric name to be something like sum(my_metric), avg(my_metric) or even avg(my_metric:my_label)? Even as an interim solution?
Whatever solution you come up with I would be interested in it :D
 olib963
on 21 Oct 2019
olib963
on 21 Oct 2019
@olib963 - Thanks for sharing!
We have backlogged work for this indeed, we are doing our best to make it available as soon as possible.
cc: @cohenyair
CharlyF
on 22 Oct 2019
I am running a setup where i need to use a mix of aggregators depending on which metric I use. So being able to specify the aggregator directly on the HPA manifest would be a massive help.
 ajolinklog
on 2 Dec 2019
ajolinklog
on 2 Dec 2019
We are also facing the same issue so could you please provide any help.
 kushalgangan
on 24 Jan 2020
kushalgangan
on 24 Jan 2020
Ah, okay I'm sorry to hear that.
I'll sync with the team!
@CharlyF I know this was a while ago, but do you recall what the issue was? I'm running into a similar issue with Azure metrics. Everything seems to be fine, DD_EXTERNAL_METRICS_PROVIDER_BUCKET_SIZE is set to 1500, but the cluster agent still reports that the metric is invalid.
 logicfox
on 1 May 2020
logicfox
on 1 May 2020
👋 seizing the opportunity to share an update on the support of any metric format, we have a PoC and are working on migration paths.
As for the issue, do you have a ticket opened @logicfox ? It would help us look into the metrics and get some logs from your cluster agent to pinpoint what is wrong.
Azure metrics being collected through our cloud crawlers, they will be delayed (which is solved with a larger DD_EXTERNAL_METRICS_PROVIDER_BUCKET_SIZE indeed). But it could be something else.
Best,
.C
CharlyF
on 1 May 2020
@CharlyF I sent out a flare to support. They suggested an additional environment variable to set: DD_EXTERNAL_METRICS_PROVIDER_MAX_AGE to 1500. I was able to get the metrics server to work after setting both env vars.
Also, I'm using Datadog in the EU, so I had to set DATADOG_HOST in addition. I didn't find this documented anywhere except here: https://github.com/DataDog/datadog-agent/blob/master/test/e2e/argo-workflows/cluster-agent.yaml#L189
logicfox
on 4 May 2020
Yes right - DD_EXTERNAL_METRICS_PROVIDER_MAX_AGE also needs to be bumped. This is because we use this value to identify what could be a stale value. Thanks for sharing here.
As for DATADOG_HOST, it was brought up to my attention that the documentation is lacking indeed. We will fix that asap.
Best,
.C
CharlyF
on 5 May 2020
Hello @CharlyF I was able to setup DCA to use external metrics in our GKE cluster. The question I have is, how we can use a standard APM metric like trace.http.request.hits as a rate here? Following is a sample HPA setup I have. I tried finding a dedicated metric for rate. I couldn't find anything apart from functions like per_sec() and modifiers like as_rate().
apiVersion: autoscaling/v2beta1
kind: HorizontalPodAutoscaler
metadata:
  name: my-service-hpa
spec:
  minReplicas: 2
  maxReplicas: 10
  scaleTargetRef:
    apiVersion: apps/v1
    kind: Deployment
    name: my-service
  metrics:
    - type: External
      external:
        metricName: trace.http.request.hits
        metricSelector:
          matchLabels:
            env: uat
            service: my-service
        targetAverageValue: 2500m
 udinnet
on 18 Jun 2020
udinnet
on 18 Jun 2020
👋 That would fall in the same category here indeed, the "extra" function can't be applied just yet but our new feature should allow you to do that.
Also, while I do my best to keep GH issues updated, feel free to open a record with our solutions team so we can track who has requested it and we can keep you posted as we make progress.
CharlyF
on 19 Jun 2020
Related issues
 dignajar
·
3Comments
dignajar
·
3Comments
 nimeshksingh
·
4Comments
nimeshksingh
·
4Comments
 pvalsecc
·
5Comments
pvalsecc
·
5Comments
 oussemos
·
5Comments
oussemos
·
5Comments
 spender0
·
4Comments
spender0
·
4Comments
Most helpful comment
Hi, @gottfrois, @CharlyF
I have one more questing as I want to understand why not all the datadog metrics are being processed by
datadog-cluster-agentI have AKS 1.13.5 with configured
datadog-cluster-nodesanddatadog-cluster-agent. Also, I've configured hpa using the following articles:When I use kubernetes metrics from datadog, such as
kubernetes.cpu.usage.totalorkubernetes.memory.usageit works for me with the following example config:````yaml
apiVersion: autoscaling/v2beta1
kind: HorizontalPodAutoscaler
metadata:
name: myapp-autoscaler
spec:
minReplicas: 1
maxReplicas: 3
scaleTargetRef:
apiVersion: apps/v1
kind: Deployment
name: myapp
metrics:
external:
metricName: kubernetes.cpu.usage.total
metricSelector:
matchLabels:
environment: d11
targetAverageValue: 70
````
But, when I am trying to use Datadog metrics from azure (for example:
azure.servicebus_namespaces.count_of_active_messages_in_a_queue_topic.orazure.vm.network_out_total, etc.) it's not works for me.In this case my
HorizontalPodAutoscalerreturns the following error:````
Type Status Reason Message
---- ------ ------ -------
AbleToScale True SucceededGetScale the HPA controller was able to get the target's current scale
ScalingActive False FailedGetExternalMetric the HPA was unable to compute the replica count: unable to get external metric default/azure.servicebus_namespaces.count_of_active_messages_in_a_queue_topic./&LabelSelector{MatchLabels:map[string]string{environment: d11,},MatchExpressions:[],}: no metrics returned from external metrics API
Type Reason Age From Message
---- ------ ---- ---- -------
Warning FailedComputeMetricsReplicas 10m (x12 over 13m) horizontal-pod-autoscaler failed to get external metric azure.servicebus_namespaces.count_of_active_messages_in_a_queue_topic.: unable to get external metric default/azure.servicebus_namespaces.count_of_active_messages_in_a_queue_topic./&LabelSelector{MatchLabels:map[string]string{environment: d11,},MatchExpressions:[],}: no metrics returned from external metrics API
Warning FailedGetExternalMetric 3m22s (x41 over 13m) horizontal-pod-autoscaler unable to get external metric default/azure.servicebus_namespaces.count_of_active_messages_in_a_queue_topic./&LabelSelector{MatchLabels:map[string]string{environment: d11,},MatchExpressions:[],}: no metrics returned from external metrics API
````
On the other hand
datadog-cluster-agent statusshows the metric available, but not valid:External Metrics ---------------- Total: 1 Valid: 0 hpa: - name: myapp-autoscaler - namespace: default - uid: bc27de70-9e76-11e9-8f50-4a2d4a468e74 labels: - environment: d11 metricName: azure.servicebus_namespaces.count_of_active_messages_in_a_queue_topic. ts: 1.562257888e+09 valid: false value: 283.3What am I doing wrong?