Datadog-agent: DD_TAGS, DD_DOCKER_LABELS_AS_TAGS and Datadog Agent Logs
I would have thought that setting DD_TAGS or enabling DD_DOCKER_LABELS_AS_TAGS would add the labels to the Log Explorer tags for us to use and sort our logs with. Is this intended behaviour or are we doing something wrong?
Thanks in advance!
 segersniels
All 22 comments
Hello @segersniels,
Using those variables should indeed add those tags to both your metrics and logs.
So if this does not work, there is probably something to be looked into.
Would you mind sharing some more details about what you did so we can replicate?
For instance:
- Is the agent already running when you set the environment variables
DD_TAGSorDD_DOCKER_LABELS_AS_TAGS? - What value do you set for the environment variable?
- Is the agent running on the host or as a container?
- Are the metrics for the corresponding container properly tagged with the new values?
- Would you mind sharing the result of the
statuscommand of the agent?
Thanks a lot.
 NBParis
on 8 Oct 2018
NBParis
on 8 Oct 2018
Thanks for the fast response @NBParis ,
- The agent is running as an ECS container.
{ "name": "DD_TAGS", "value": "environment:${environment} project:${project} region:${region}" }{ "name": "DD_DOCKER_LABELS_AS_TAGS", "value": "true" }
==============
Agent (v6.5.2)
==============

  Status date: 2018-10-08 14:33:54.096273 UTC
  Pid: 351
  Python Version: 2.7.15
  Logs:
  Check Runners: 4
  Log Level: info

  Paths
  =====
    Config File: /etc/datadog-agent/datadog.yaml
    conf.d: /etc/datadog-agent/conf.d
    checks.d: /etc/datadog-agent/checks.d

  Clocks
  ======
    NTP offset: 110µs
    System UTC time: 2018-10-08 14:33:54.096273 UTC

  Host Info
  =========
    bootTime: 2018-09-28 07:01:51.000000 UTC
    kernelVersion: 4.14.67-66.56.amzn1.x86_64
    os: linux
    platform: debian
    platformFamily: debian
    platformVersion: buster/sid
    procs: 73
    uptime: 245h33m6s
    virtualizationRole: guest
    virtualizationSystem: xen

  Hostnames
  =========
    ec2-hostname: ip-10-4-2-218.eu-west-1.compute.internal
    hostname: i-0cf22cc300dabf51a
    instance-id: i-0cf22cc300dabf51a
    socket-fqdn: 6a77fc5a8182
    socket-hostname: 6a77fc5a8182
    hostname provider: aws
    unused hostname providers:
      configuration/environment: hostname is empty
      gce: unable to retrieve hostname from GCE: status code 404 trying to GET http://169.254.169.254/computeMetadata/v1/instance/hostname

=========
Collector
=========

  Running Checks
  ==============

    cpu
    ---
        Instance ID: cpu [OK]
        Total Runs: 475
        Metric Samples: 6, Total: 2,844
        Events: 0, Total: 0
        Service Checks: 0, Total: 0
        Average Execution Time : 0s


    disk (1.3.0)
    ------------
        Instance ID: disk:e5dffb8bef24336f [OK]
        Total Runs: 476
        Metric Samples: 156, Total: 74,256
        Events: 0, Total: 0
        Service Checks: 0, Total: 0
        Average Execution Time : 61ms


    docker
    ------
        Instance ID: docker [OK]
        Total Runs: 475
        Metric Samples: 403, Total: 192,443
        Events: 0, Total: 17
        Service Checks: 1, Total: 475
        Average Execution Time : 33ms


    elastic (1.7.1)
    ---------------
        Instance ID: elastic:34f5409c995e455c [OK]
        Total Runs: 476
        Metric Samples: 175, Total: 83,300
        Events: 0, Total: 1
        Service Checks: 2, Total: 952
        Average Execution Time : 24ms

        Instance ID: elastic:89924994ba2a0c2b [OK]
        Total Runs: 476
        Metric Samples: 170, Total: 80,920
        Events: 0, Total: 1
        Service Checks: 2, Total: 952
        Average Execution Time : 18ms


    file_handle
    -----------
        Instance ID: file_handle [OK]
        Total Runs: 476
        Metric Samples: 5, Total: 2,380
        Events: 0, Total: 0
        Service Checks: 0, Total: 0
        Average Execution Time : 0s


    io
    --
        Instance ID: io [OK]
        Total Runs: 475
        Metric Samples: 52, Total: 24,664
        Events: 0, Total: 0
        Service Checks: 0, Total: 0
        Average Execution Time : 0s


    load
    ----
        Instance ID: load [OK]
        Total Runs: 476
        Metric Samples: 6, Total: 2,856
        Events: 0, Total: 0
        Service Checks: 0, Total: 0
        Average Execution Time : 0s


    memory
    ------
        Instance ID: memory [OK]
        Total Runs: 476
        Metric Samples: 17, Total: 8,092
        Events: 0, Total: 0
        Service Checks: 0, Total: 0
        Average Execution Time : 0s


    network (1.6.1)
    ---------------
        Instance ID: network:2a218184ebe03606 [OK]
        Total Runs: 476
        Metric Samples: 20, Total: 9,520
        Events: 0, Total: 0
        Service Checks: 0, Total: 0
        Average Execution Time : 0s


    ntp
    ---
        Instance ID: ntp:b4579e02d1981c12 [OK]
        Total Runs: 476
        Metric Samples: 1, Total: 476
        Events: 0, Total: 0
        Service Checks: 1, Total: 476
        Average Execution Time : 0s


    uptime
    ------
        Instance ID: uptime [OK]
        Total Runs: 476
        Metric Samples: 1, Total: 476
        Events: 0, Total: 0
        Service Checks: 0, Total: 0
        Average Execution Time : 0s

========
JMXFetch
========

  Initialized checks
  ==================
    no checks

  Failed checks
  =============
    no checks

=========
Forwarder
=========

  CheckRunsV1: 475
  Dropped: 0
  DroppedOnInput: 0
  Errors: 0
  Events: 0
  HostMetadata: 0
  IntakeV1: 49
  Metadata: 0
  Requeued: 0
  Retried: 0
  RetryQueueSize: 0
  Series: 0
  ServiceChecks: 0
  SketchSeries: 0
  Success: 999
  TimeseriesV1: 475

  API Keys status
  ===============
    API key ending in 25784 for endpoint https://app.datadoghq.com: API Key valid

==========
Logs Agent
==========

  container_collect_all
  ---------------------
    Type: docker
    Status: Error: read unix @->/var/run/docker.sock: use of closed network connection
    Inputs: 6e92a415cfe9be8f191ad3749e3c0e03de4aed734632c10598aaacb841cf26dd 6379c8e49f684e7d6e69607765cc933ec35bb08194d0d469b64fe8c3a14a9567 65abfb732c02c4974506876c82bbc646e2d62eb70d4a87316c106182471d54ba e06390d4e13d3fb96e76eaedb2a9f59971d843186dd1cda65f6269630219cb6b 80a5360d2086fef996c37995a641436893c11239e1262744d4eaf2c56170c04c f8d7928f9e6ad2fb34fd221a63070fcef88bc433ce615779a4e1c281de0d1ac7 50ea658b23857ab4209413ba1bb2b1bb48a7c3b16ac9e514264f0a044690b82d 18689028c592d4775647ec73a98c1ac7fa2a3626e193e4271497f5d86333d08b c84b12ca73462f6fe1eeb8dfb083a547bb4a16601b456ef5274d77a7a3a11569 b5dd9b223491f4954de159fbfd33d5c6e99f2d6cec46ecbf598195b712ccb026 aab755a767fe8711b3701e215e4779611177500988d2edb14b5e13320d7e6a8c 451a43e8abed4d0bce2a9666d000d5e4b5ab9c871a99c0561887bff64e1dc2dd 378f0bf2eb5358dd65b4386473ae967a5a1c1a5d47cab62c00f819024bc0aa53 02cc15f3b16c3b777d4bea63559e721899d5a328a19fdf07897a4ecbbe95ec75 9979425e08012f109e9c7b5b1d0842ef20e0e3d0ef5ae5ddbc4011741c96ccd8 342cca04adee8a504b4ff9fc72ef351a8f903973646be34588f9c52a27160c65 077a00d69197f551b1d65cf96c45ebcdf9e72802ffc4b5f0e9c1af7d04f69dc2 7f21b10329f03af2e7e8816841b5a95691447d94be25a11b447683905f049d1e 9531f779241c1867f568a9079fff54988ecb02e1c161c52110cd20b17833dd5a

=========
DogStatsD
=========

  Checks Metric Sample: 492,708
  Event: 20
  Events Flushed: 20
  Number Of Flushes: 475
  Series Flushed: 426,256
  Service Check: 8,096
  Service Checks Flushed: 8,557
  Dogstatsd Metric Sample: 1,901
fwiw - the same container is also visible in the "live containers" , and there all labels are visibile. just not in the log console
 jedi4ever
on 8 Oct 2018
jedi4ever
on 8 Oct 2018
not sure if this relevant - running the agent in debug:
 (tagger.go:79 in Init) | starting the tagging system
 (tagger.go:151 in tryCollectors) | docker tag collector successfully started
| (tagger.go:149 in tryCollectors) | ecs_fargate tag collector cannot start: Failed to connect to task metadata API, ECS tagging will not work
 (tagger.go:151 in tryCollectors) | ecs tag collector successfully started
.. I think DD_COLLECT_LABELS_AS_TAGS can't be just yes , but needs to be a comma separated var
https://github.com/DataDog/docker-dd-agent
jedi4ever
on 8 Oct 2018
well what do you know some containers get the tags , others don't. And the difference as far I can see is: those who don't spit out json get the labels, others don't. not sure this is really the difference ...
So it seems the labels get added if the ATTRIBUTES are empty.
My suspicion is that the default docker pipeline "eats" the labels somewhere during json parsing
jedi4ever
on 8 Oct 2018
.. I think
DD_COLLECT_LABELS_AS_TAGScan't be just yes , but needs to be a comma separated var
https://github.com/DataDog/docker-dd-agent
It seems that this was the case indeed, tried adjusting true to the correct JSON environment variable it normally needs and seems to have fixed the issue.
{
    "name": "DD_DOCKER_LABELS_AS_TAGS",
    "value": "{\"environment\":\"environment\", \"project\":\"project\"}"
}
This now displays the labels as tags in the Log Explorer. A shame that DD_TAGS still isn't working but at least we're getting our tags showing up now 🎉
segersniels
on 9 Oct 2018
Thanks a lot @jedi4ever and glad to know that your issue is now fixed @segersniels.
Regarding DD_TAGS, I double checked internally and it looks properly setup.
To help us further investigate, would it be possible to send a flare to [email protected] and reference this issue so we can investigate why this environment variable is not correctly taken into account?
NBParis
on 9 Oct 2018
@NBParis The flare has been sent 📦
segersniels
on 9 Oct 2018
Perfect, thanks.
I'll sync with the support team to make sure they also update this issue with their findings.
NBParis
on 9 Oct 2018
Is there any update on the DD_TAGS issue? I am also finding this environmental variable is not working and the tags are not being extracted, as they were in v5 of the agent.
I am in contact with DD support but it would also be good to get an update straight from the developers of the agent.
I have sent debug logs for the tagger module to DD support in a ticket, they contain various IP addresses so I don't want to post here.
 danjamesmay
on 27 Nov 2018
danjamesmay
on 27 Nov 2018
Hello @danjamesmay, would you have the id of your support case?
That will help us to correlate with all the information you already provided there.
NBParis
on 27 Nov 2018
Absolutely, it’s 181423.
Please let me know if there is any additional information I can provide to help you debug.
On 27 Nov 2018, at 19:07, Nils notifications@github.com wrote:
Hello @danjamesmay, would you have the id of your support case?
That will help us to correlate with all the information you already provided there.
—
You are receiving this because you were mentioned.
Reply to this email directly, view it on GitHub, or mute the thread.
danjamesmay
on 27 Nov 2018
Is there any update to this issue? I have been advised to use DD_DOCKER_LABELS_AS_TAGS instead, which is not ideal.
Will you support DD_TAGS again?
danjamesmay
on 5 Dec 2018
Hey all,
Apologies for the delay on this - I double checked and DD_TAGS works as expected on my end. For logs, metrics and overall metadata.
To note, I checked on GKE not on ECS (this should not matter but for the sake of the investigation, I'd rather share my conf).
I think the DD_DOCKER_LABELS_AS_TAGS issue was addressed, let me know if this still causes issues.
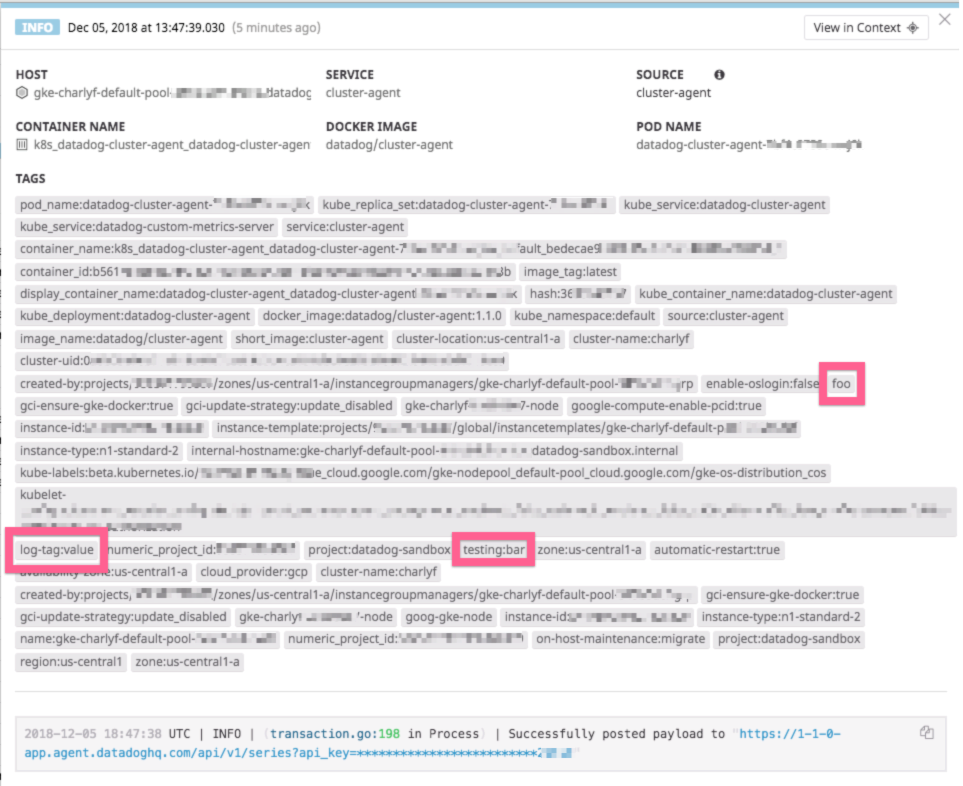
As for the DD_TAGS I deployed with:
DD_TAGS=log-tag:value foo testing:bar in the env var of my deployment and we can see those in the metadata of my host:

And looking at the logs:
And finally in my metrics:
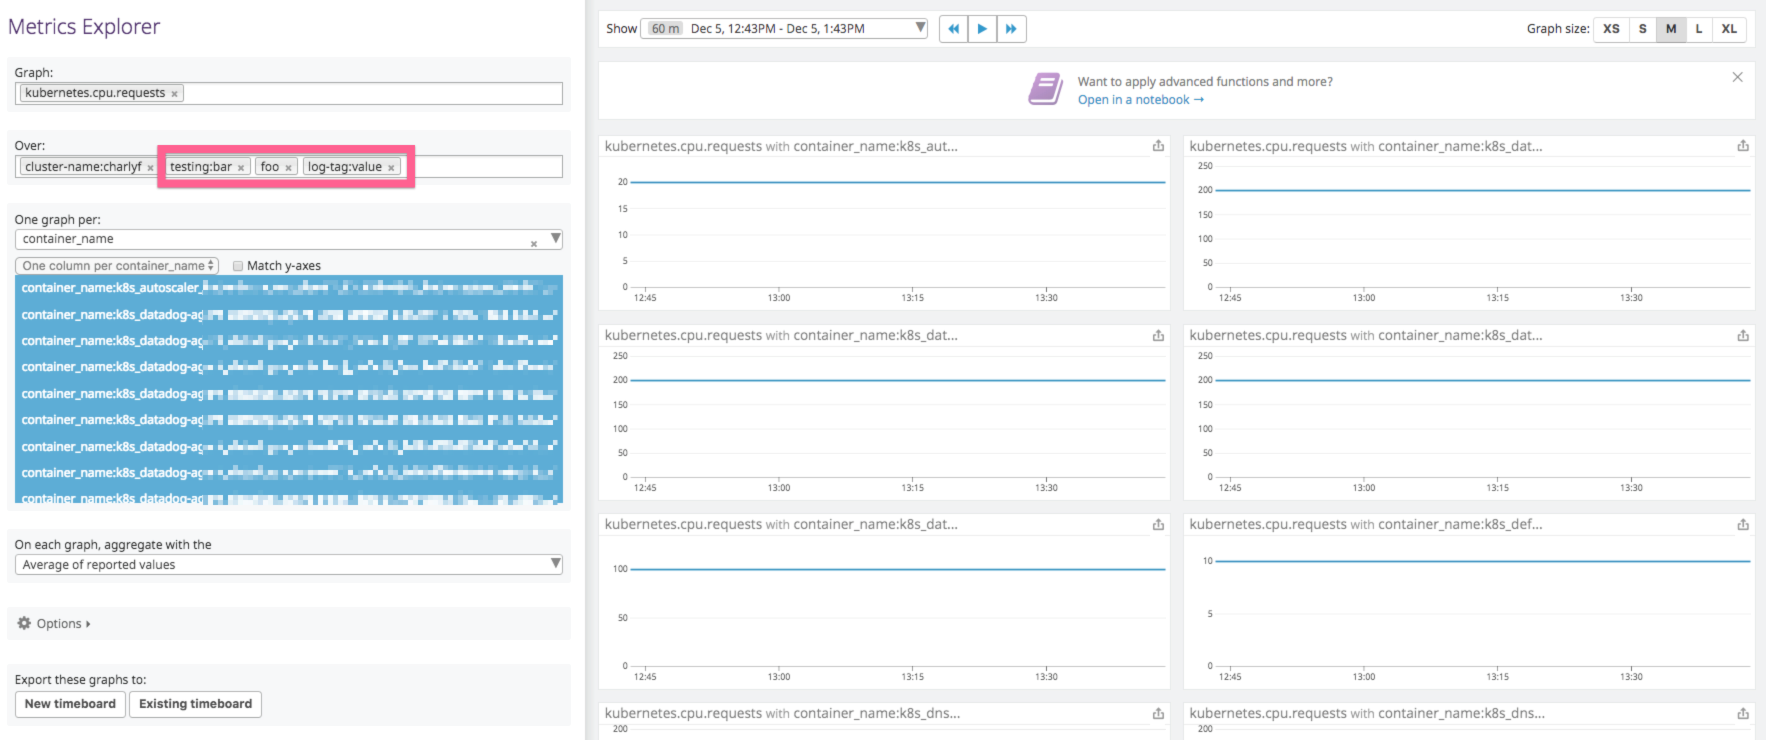
Could you confirm if you are using the DD_TAGS with spaces between the key:value (or key) ?
Looking at the initial message:
{ "name": "DD_TAGS", "value": "environment:${environment} project:${project} region:${region}" }
besides environment project and regions are already collected, it'd be great if you could share your conf so I can better investigate.
Best,
.C
 CharlyF
on 5 Dec 2018
CharlyF
on 5 Dec 2018
I can also confirm DD_DOCKER_LABELS_AS_TAGS also works for me:
"ContainerDefinitions": [
<my_app>:
                        "DockerLabels": {
                            "app": "my_app",
                            "env": "uat"
                        },
<datadog>:
                        "Environment": [
                            {
                                "Name": "DD_DOCKER_LABELS_AS_TAGS",
                                "Value": "{\"app\":\"app\", \"env\":\"env\"}"
                            }, ...
The host tags are now appearing in the container page, and on my metrics.
DD_TAGS still do not work with the latest agent for me. Specifying the key:value list in a space-separated string.
EDIT: Also there is a minor bug, this is my YAML, which gets converted to the JSON above:
- Name: 'DD_DOCKER_LABELS_AS_TAGS'
  Value: '{"app":"app", "env":"env"}'
It's not ideal to have to write a json string in the yaml
danjamesmay
on 9 Jan 2019
Just to help summarize for anyone who might still be confused as I certainly was, the DD_TAGS and DD_DOCKER_LABELS_AS_TAGS use very different notation. Unfortunately they have two different doc pages with examples for each, https://docs.datadoghq.com/agent/docker/#environment-variables. and https://docs.datadoghq.com/tagging/assigning_tags/?tab=go#environment-variables respectively. To summarize, the DD_TAGS simply needs to be a space-separated list, where the DD_DOCKER_LABELS_AS_TAGS needs to be comma-separated and encapsulated in a curly brace.
Also, if anyone is trying to start the dd agent container via docker run command and are trying to pass these environment variables as runtime parameters, note that you should encapsulate your entire parameter with single quotes so that the spaces and double quotes are enclosed. I also found that I needed to remove the single quotes encapsulating the curly brace block.
My docker run params for example:
-e 'DD_TAGS=com.here.clustername:dcos-dev project:dcos dcos-license-usage node-type:agent'
-e 'DD_DOCKER_LABELS_AS_TAGS={"com.here.marathon_app_id":"com.here.marathon_app_id","com.here.environment":"com.here.environment","com.here.role":"com.here.role","com.here.dc":"com.here.dc","com.here.app_id":"com.here.app_id"}'
 dwasikow
on 4 Apr 2019
dwasikow
on 4 Apr 2019
Thanks @dwasikow for the summary!
We will update the doc accordingly as soon as possible to reflect the correct setup for docker run and docker compose.
Closing the issue.
 Simwar
on 4 Apr 2019
Simwar
on 4 Apr 2019
@CharlyF Sorry for reviving this issue but I see the same behavior as @jedi4ever described in the comment above.
We don't use DD_DOCKER_LABELS_AS_TAGS at all and our DD_TAGS=k8s-cluster:xxx aws-account:yyy. The tags are correctly shown on the host:
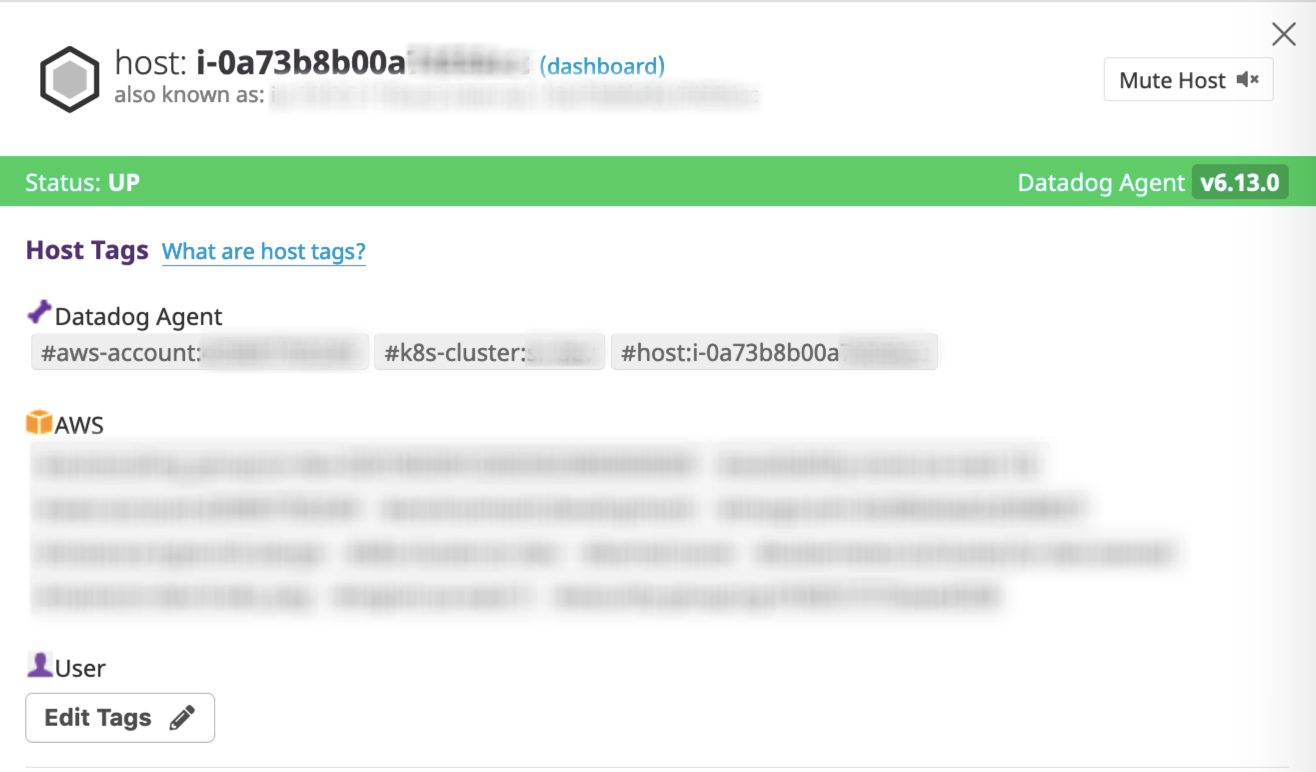
If the log entry doesn't have attributes, the host tags applied correctly:
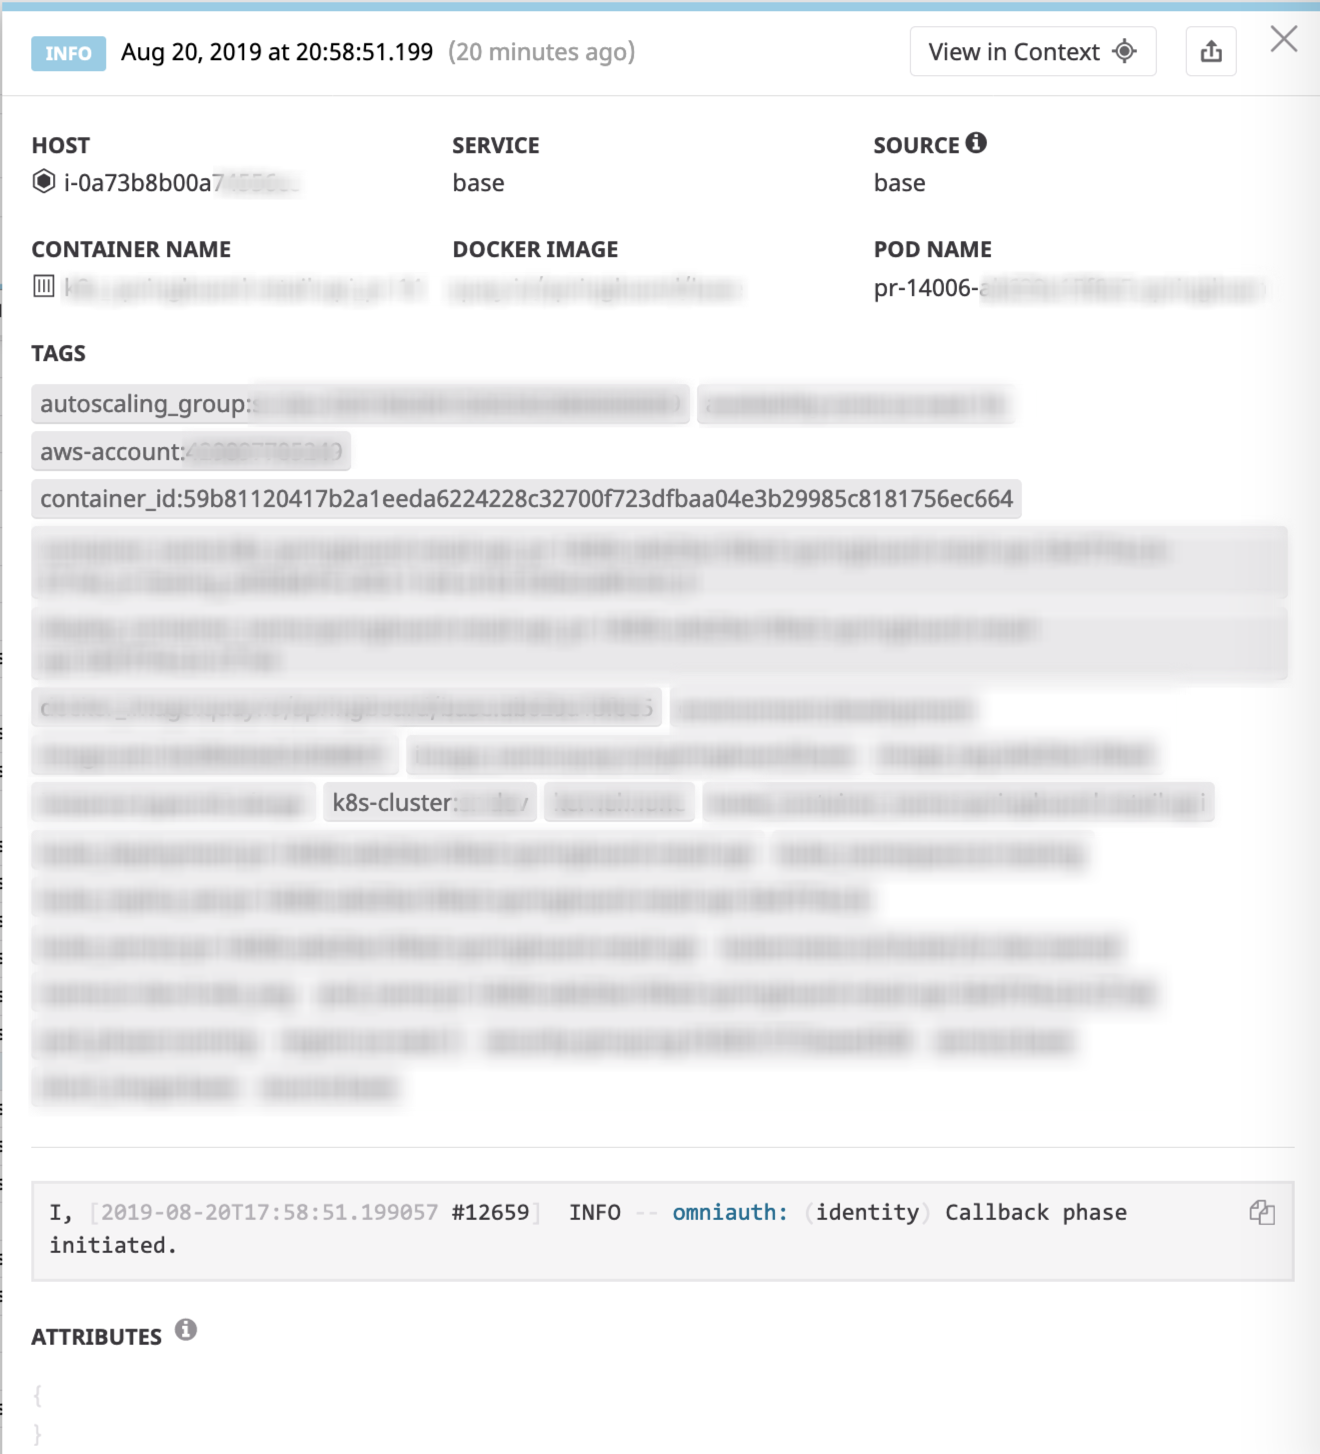
The very next log entry coming from the same container (notice container_id) doesn't have k8s-cluster and aws-account tags:
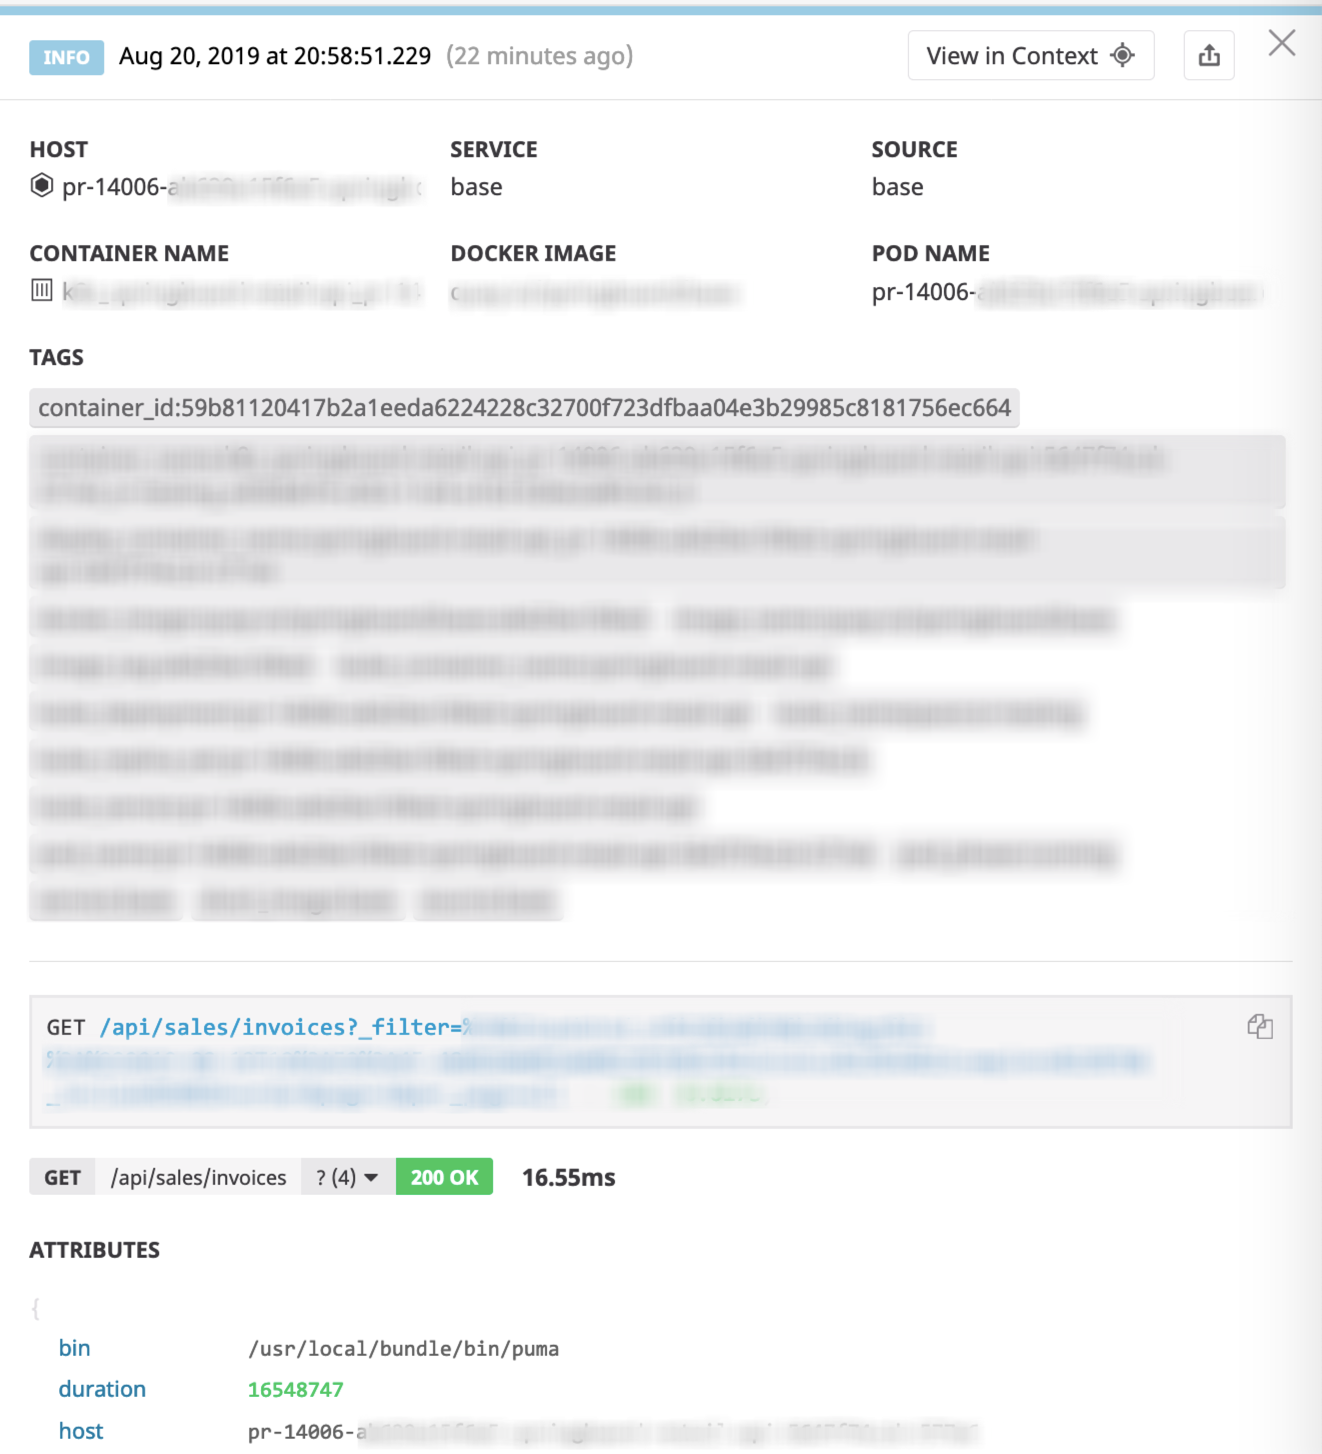
It seems that the host is parsed from the attributes and that prevents DD_TAGS from being applied.
 mironov
on 20 Aug 2019
mironov
on 20 Aug 2019
That's a question for @NBParis but I think he's out this week. Could you reach out to support instead @mironov ? You can find contact info here.
 hkaj
on 21 Aug 2019
hkaj
on 21 Aug 2019
Hey @mironov / @hkaj
Actually I have the answer to this.
The agent doesn't send the host tags along the logs. Datadog joins them in the backend thanks to the hostname set in the logs.
This is why, if the hostname is coming from the log in the JSON attribute host and if it doens't match with what we have in our backend (the name in the infralist for instance), the host tags won't be attached to the log.
You will have to change this attribute called host in your logs, as the tag mapping happens before the attribute remapping. You cannot change the name in a pipeline.
Let me know if you have further questions!
Simon
Simwar
on 21 Aug 2019
@Simwar Thank you for the explanation. As you suggested, we changed the host attribute, and that fixed the issue for us.
mironov
on 28 Aug 2019
Related issues
 Rowern
·
33Comments
Rowern
·
33Comments
 plumdog
·
14Comments
plumdog
·
14Comments
 macat
·
17Comments
macat
·
17Comments
 matt-canty-dragon
·
13Comments
plumdog
·
29Comments
matt-canty-dragon
·
13Comments
plumdog
·
29Comments