Dashboard: CPU Usage and Memory Usage graphs issue
Environment
Dashboard: v2.0.1+0.g5b83803
Google Chrome: 83.0.4103.97 (Official Build) (64-bit)
Steps to reproduce
Open the Dashboard in Chrome, set the viewport to an horizontal size in this interval: 1711px to 1725px
Observed result
The CPU Usage and Memory Usage getting crazy.
Easy way to show it https://www.youtube.com/watch?v=7OhzK_w4u4Q
Expected result
Static graph
 pierluigilenoci
All 10 comments
Duplicate of #5118, #5102, #5050
/close
 floreks
on 5 Jun 2020
floreks
on 5 Jun 2020
@floreks: Closing this issue.
In response to this:
Duplicate of #5118, #5102, #5050
/close
Instructions for interacting with me using PR comments are available here. If you have questions or suggestions related to my behavior, please file an issue against the kubernetes/test-infra repository.
 k8s-ci-robot
on 5 Jun 2020
k8s-ci-robot
on 5 Jun 2020
@floreks sorry for that... I tried to search for an open ticket on this issue but I was not able to find it. Now I understood why. They are all closed. 😅
pierluigilenoci
on 5 Jun 2020
No worries, I remember most issues so I can quickly triage them :slightly_smiling_face:
floreks
on 5 Jun 2020
Also duplicate of https://github.com/kubernetes/dashboard/issues/5101, https://github.com/kubernetes/dashboard/issues/5106
This seems like a fairly widespread problem. 😆
I'm sorry I helped make noise.
pierluigilenoci
on 5 Jun 2020
Unfortunately, yes. Maybe this will influence chart library maintainers to look at this problem sooner.
floreks
on 5 Jun 2020
I checked on ngx-charts repo. They have a already couple of open issues (https://github.com/swimlane/ngx-charts/issues/349 and https://github.com/swimlane/ngx-charts/issues/971) for this, the older one since April 2017.
I see little hope in a short resolution. 😞
Personal remark: considering that the project has the last commit of almost two months ago and bugs of this kind are ignored perhaps it is not the best framework for the needs of the Dashboard. Fortunately, the intervals in which the problem is generated are limited but... 😢
pierluigilenoci
on 5 Jun 2020
We have already tried 3 different chart libraries before this one and it seems to be the easiest to use and most stable, despite this one issue.
floreks
on 5 Jun 2020
Ok, I tried to ping those who seem to be the most involved contributors in the library, let's see what happens.
Just for fun... sometimes this library creates some artifacts in the drawing, actually inventing time travel... 🤣
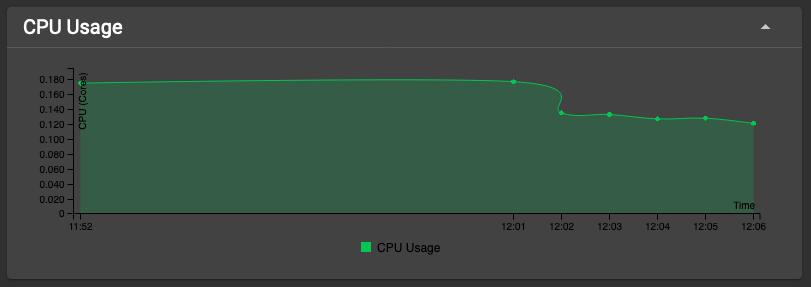
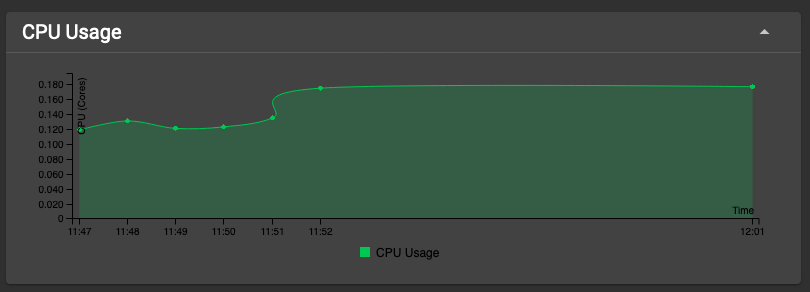
pierluigilenoci
on 5 Jun 2020
Seems like you have tweaked metrics scraper to scrape metrics more frequently or metrics scraper failed to gather metrics for few minutes. The approximation function used by the ngx to draw the line is not prepared for that I guess.
floreks
on 5 Jun 2020
Related issues
 zcalusic
·
32Comments
zcalusic
·
32Comments
 saschagrunert
·
30Comments
saschagrunert
·
30Comments
 saikatgithub
·
34Comments
saikatgithub
·
34Comments
 Masber
·
44Comments
Masber
·
44Comments
 cnwalker
·
32Comments
cnwalker
·
32Comments