Darktable: Parallel thumbnail generation
Generating thumbnails for an import of 8000 photos is incredibly slow and appears to be single-threaded, even when running darktable-generate-cache manually.
It would be really helpful if I could run darktable-generate-cache across all the cores in my CPU to process thumbnails that much faster.
 bigntallmike
All 30 comments
Have you tried tuning the option "number of background threads" as described here?
https://darktable.gitlab.io/doc/en/core_options_cpu.html
Related: A default of 2 seems a little bit conservative for 2020... is this documentation accurate? If it is accurate could the default code to be changed to number-of-cores/2 or something?
 ghost
on 30 Jun 2020
ghost
on 30 Jun 2020
Thumnail generation performance depends mainly on settings in (git master) "darktable preferences->lighttable", "don't use embedded preview" and "high quality thumb processing ...".
As thumbs processing uses the currently development status of all images it uses the processing pipeline. This is multithreaded all over!
 jenshannoschwalm
on 1 Jul 2020
jenshannoschwalm
on 1 Jul 2020
My 'number of background threads' is set to 8 and I have OpenCL as well. Its 45 minutes to generate a full set of thumbnails from the command-line and unresponsively slow to do it in darktable.
"Don't use embedded preview JPEG" is off.
"Megabytes for thumbnail cache" is 2048.
bigntallmike
on 1 Jul 2020
Is this closed because thumbnail generation is working for you properly across cores now? If so what did you change to get it working please?
ghost
on 2 Jul 2020
I closed it because it seems that others believe this works properly and I'm investigating my own problem with it more thoroughly, as well as cloning the source to look at darktable-generate-cache.
bigntallmike
on 2 Jul 2020
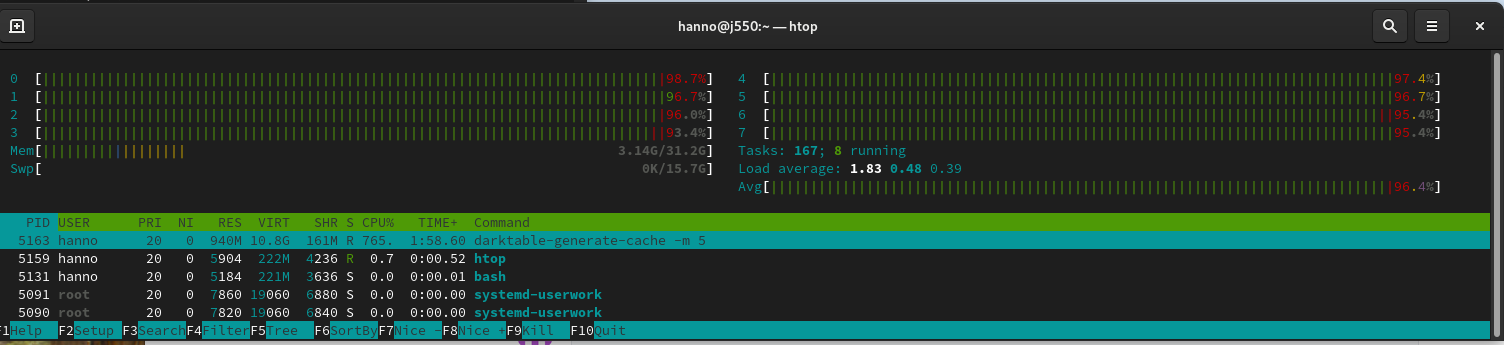
Well, darktable-generate-cache is not threading on top level at all, you could of course do that. But - will this really help performance wise? It may be so for some situations but as i mentioned the pipeline makes heavy use of threading already so you will likely have a very high cpu load. Have you looked on cpu usage with a tool like top/htop or alike? There is not much room for improvement ...
The best way to achieve faster thumbs atm is to increase "high quality thumb processing ...", if this is set to something bigger than what you ask for this will render the reduced-size thumb and not full-pipeline and later shrink the image. Slightly less quality though.
jenshannoschwalm
on 2 Jul 2020
Wait what? So background generation in dt itself is tunably multi-threaded, but the seperate tool for cache generation is single-threaded? Is there no common code across these?
ghost
on 2 Jul 2020
@jenshannoschwalm I've created a patch to fork each 'job' in generate_thumbnail_cache into a pool of N jobs and I'm testing it now. I'll sleep on it before I share it though. I still need to fix a sqlite error #5.
bigntallmike
on 3 Jul 2020
@bigntallmike In your mail you mentioned 8 cores/16threads and 15 of them idle. Are you running a linux system? Compiled yourself? gomp activated?
It should be like
jenshannoschwalm
on 3 Jul 2020
@jenshannoschwalm I'm using the 3.0.2 RPM distributed through the opensuse hosted repo:
compile options:
bit depth is 64 bit
normal build
SSE2 optimized codepath enabled
OpenMP support enabled
OpenCL support enabled
Lua support enabled, API version 5.0.2
Colord support enabled
gPhoto2 support enabled
GraphicsMagick support enabled
OpenEXR support enabled
And no, it does not use more than ~120% CPU time while running darktable-generate-cache (taken after 60 images processed):
bigntallmike
on 3 Jul 2020
Be advised that if OpenCL is enabled, then GPU is more likely to be the limiting factor, not CPU.
 parafin
on 3 Jul 2020
parafin
on 3 Jul 2020
I can't be of help right now, stuck at work. What you find is not OK for me, i would suggest to compile from current git master if you can do that. I have seen what you see now with incorrect compile time options a while ago on fedora... No idea how süße does this...
jenshannoschwalm
on 3 Jul 2020
Right, could be tested by using amaze as that is strictly cpu and on my system keeps cpu "working".
jenshannoschwalm
on 3 Jul 2020
BTW, dedicated graphics card? Otherwise opencl might be bad!
jenshannoschwalm
on 3 Jul 2020
Yes, I have an RTX 2060 and OpenCL works great in for instance ffmpeg, but darktable-generate-cache isn't showing up on nvtop as a consumer during the regeneration of the cache.
bigntallmike
on 3 Jul 2020
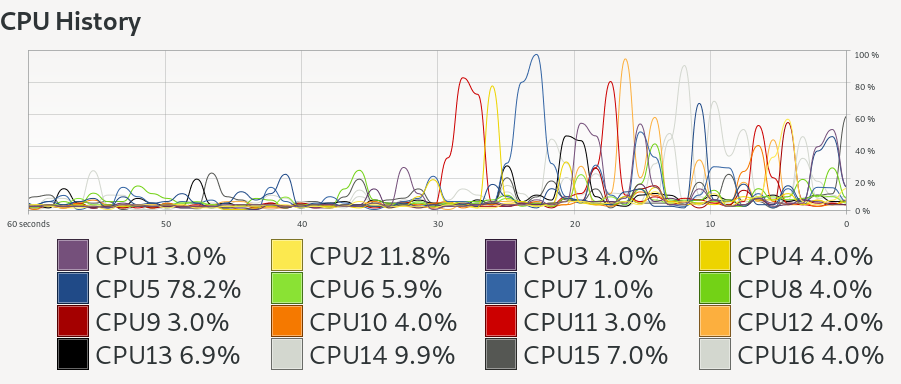
Rebuilt master from source, darktable-generate-cache is using peak 190% CPU in glances which is slightly better than single threaded but not much.
Actual individual CPU usage is almost exactly the same visual as posted above (one peak at a time, never more than one).
bigntallmike
on 3 Jul 2020
I was not aware of nvtop, just installed. While generating thumbnail cache i get here on my much slower i7700/P2000 system
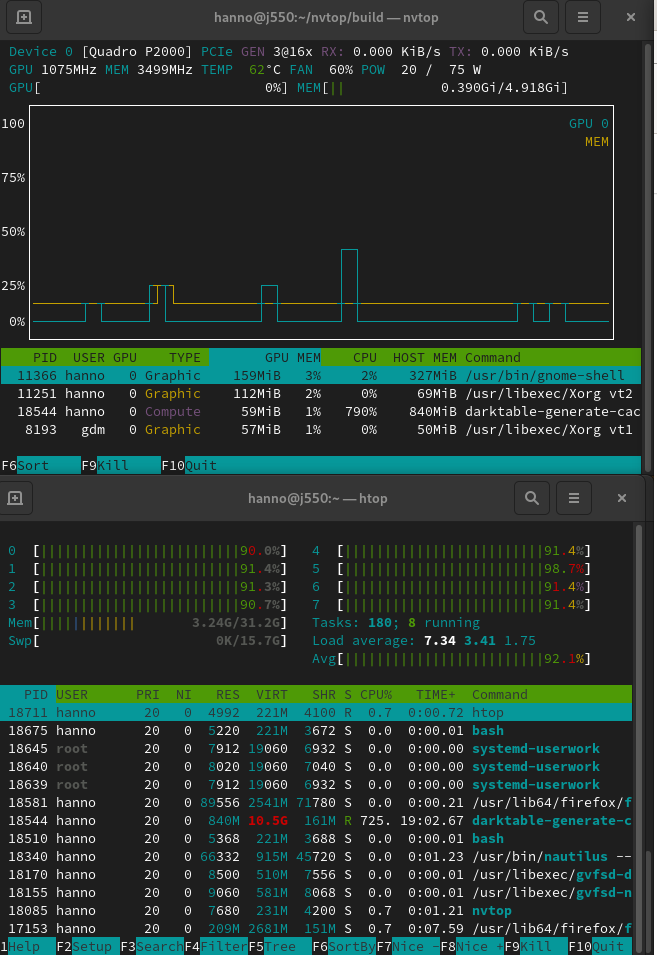
which seem plausible & correct for me. Atm i have no idea what might be wrongly configured on your system.
jenshannoschwalm
on 4 Jul 2020
@bigntallmike, did you get any further?
One more question, does darktable -d opencl -d perf -d dev give further hints?
jenshannoschwalm
on 5 Jul 2020
I don't see anything "interesting" per se. A number of entries like this that seem to mean its doing what it thinks its doing:
```6.773121 [opencl_profiling] profiling device 0 ('GeForce RTX 2060'):
6.773125 [opencl_profiling] spent 0.0149 seconds in [Write Image (from host to device)]
6.773129 [opencl_profiling] spent 0.0008 seconds in rawprepare_1f
6.773132 [opencl_profiling] spent 0.0008 seconds in whitebalance_1f
6.773135 [opencl_profiling] spent 0.0008 seconds in highlights_1f_clip
6.773137 [opencl_profiling] spent 0.0020 seconds in clip_and_zoom_demosaic_half_size
6.773140 [opencl_profiling] spent 0.0000 seconds in denoiseprofile_precondition_v2
6.773143 [opencl_profiling] spent 0.0000 seconds in denoiseprofile_init
6.773145 [opencl_profiling] spent 0.0003 seconds in denoiseprofile_dist
6.773148 [opencl_profiling] spent 0.0003 seconds in denoiseprofile_horiz
6.773150 [opencl_profiling] spent 0.0005 seconds in denoiseprofile_vert
6.773153 [opencl_profiling] spent 0.0003 seconds in denoiseprofile_accu
6.773155 [opencl_profiling] spent 0.0000 seconds in denoiseprofile_finish_v2
6.773158 [opencl_profiling] spent 0.0001 seconds in [Copy Image (on device)]
6.773160 [opencl_profiling] spent 0.0000 seconds in colorin_unbound
6.773162 [opencl_profiling] spent 0.0000 seconds in colorspaces_transform_lab_to_rgb_matrix
6.773165 [opencl_profiling] spent 0.0001 seconds in basecurve_lut
6.773167 [opencl_profiling] spent 0.0001 seconds in colorspaces_transform_rgb_matrix_to_lab
6.773170 [opencl_profiling] spent 0.0000 seconds in colorout
6.773172 [opencl_profiling] spent 0.0002 seconds in [Read Image (from device to host)]
6.773175 [opencl_profiling] spent 0.0212 seconds totally in command queue (with 0 events missing)
6.773187 [dev_process_thumbnail] pixel pipeline processing took 0.098 secs (0.272 CPU)
But of course those command-line arguments aren't available on `darktable-generate-cache` but timstamping the output shows you how slowly its going:
```Jul 06 16:15:25.975393 image 282/8280 (3.41%) (id:282)
Jul 06 16:15:26.774088 image 283/8280 (3.42%) (id:283)
Jul 06 16:15:27.592056 image 284/8280 (3.43%) (id:284)
Jul 06 16:15:28.546438 image 285/8280 (3.44%) (id:286)
Jul 06 16:15:29.362978 image 286/8280 (3.45%) (id:288)
Jul 06 16:15:30.203268 image 287/8280 (3.47%) (id:290)
Jul 06 16:15:30.938341 image 288/8280 (3.48%) (id:292)
Jul 06 16:15:31.698704 image 289/8280 (3.49%) (id:294)
Jul 06 16:15:32.467425 image 290/8280 (3.50%) (id:296)
Jul 06 16:15:33.271293 image 291/8280 (3.51%) (id:298)
You are not aware of the --core option like darktable-generate-cache --core -d opencl -d perf -d dev ?
jenshannoschwalm
on 7 Jul 2020
You are not aware of the --core option like
darktable-generate-cache --core -d opencl -d perf -d dev?
No, actually, but it also doesn't show anything after the images begin being processed.
I get a lot of the normal opencl_init data at the top:
[opencl_init] device 0: GeForce RTX 2060
     GLOBAL_MEM_SIZE:          5934MB
     MAX_WORK_GROUP_SIZE:      1024
     MAX_WORK_ITEM_DIMENSIONS: 3
     MAX_WORK_ITEM_SIZES:      [ 1024 1024 64 ]
     DRIVER_VERSION:           440.100
     DEVICE_VERSION:           OpenCL 1.2 CUDA
Then it compiles each .cl program and gives BUILD STATUS: 0, successfully loads all the modules, and then after creating cache directory ... it just gives me the normal image n/M (x%) (id:n) status updates with no other debugging information in between.
bigntallmike
on 10 Jul 2020
maybe because your thumbnails are up to date - so nothing is reprocessed
 MStraeten
on 12 Jul 2020
MStraeten
on 12 Jul 2020
Actually recently I also noticed, generate-cache got wwwaaaaayyyyy slower (by factor 4 or so) than let's say two or three month ago. Actually around the time the option -m8 got introduced or shortly after, it got extremely slow.
On IRC somebody said, there is WIP, hence I kept silent....
Maybe time to bisect...
 AxelG-DE
on 12 Jul 2020
AxelG-DE
on 12 Jul 2020
maybe because your thumbnails are up to date - so nothing is reprocessed
I'm purposely deleting the cache folder between my tests to make sure its regenerating everything, if that was to me. In the mean time I'm basically treating on-disk thumbnails as non-functional and using memory only.
bigntallmike
on 13 Jul 2020
... and then after creating cache directory ... it just gives me the normal image n/M (x%) (id:n) status updates with no other debugging information in between
This is really weird. If you do darktable-generate-cache -m 5 --core -d opencl -d perf -d dev you should really see something like this while processing the images.
3,562310 [dev] took 0,307 secs (0,259 CPU) to load the image.
3,598618 [export] creating pixelpipe took 0,030 secs (0,139 CPU)
3,598655 [pixelpipe_process] [thumbnail] using device 0
pixelpipe cacheline 0 used 0 by 18446744073709551615
pixelpipe cacheline 1 used 0 by 18446744073709551615
cache hit rate so far: -nan
3,604705 [dev_pixelpipe] took 0,006 secs (0,011 CPU) initing base buffer [thumbnail]
3,609145 [dev_pixelpipe] took 0,004 secs (0,031 CPU) processed `raw black/white point' on GPU, blended on GPU [thumbnail]
3,611540 [dev_pixelpipe] took 0,002 secs (0,019 CPU) processed `white balance' on GPU, blended on GPU [thumbnail]
3,613713 [dev_pixelpipe] took 0,002 secs (0,015 CPU) processed `highlight reconstruction' on GPU, blended on GPU [thumbnail]
3,780784 [dev_pixelpipe] took 0,167 secs (1,154 CPU) processed `demosaic' on CPU, blended on CPU [thumbnail]
3,790936 [dev_pixelpipe] took 0,010 secs (0,058 CPU) processed `lens correction' on GPU, blended on GPU [thumbnail]
3,798921 [dev_pixelpipe] took 0,008 secs (0,005 CPU) processed `crop and rotate' on GPU, blended on GPU [thumbnail]
3,803351 [dev_pixelpipe] took 0,004 secs (0,001 CPU) processed `exposure' on GPU, blended on GPU [thumbnail]
3,809381 [dev_pixelpipe] took 0,006 secs (0,004 CPU) processed `input color profile' on GPU, blended on GPU [thumbnail]
image colorspace transform Lab-->RGB took 0,005 secs (0,035 CPU) [filmicrgb ]
5,366851 [dev_pixelpipe] took 1,557 secs (11,643 CPU) processed `filmic rgb' on CPU, blended on CPU [thumbnail]
image colorspace transform RGB-->Lab took 0,003 secs (0,013 GPU) [colorout ]
5,385953 [dev_pixelpipe] took 0,019 secs (0,081 CPU) processed `output color profile' on GPU, blended on GPU [thumbnail]
5,410921 [dev_pixelpipe] took 0,025 secs (0,129 CPU) processed `display encoding' on CPU, blended on CPU [thumbnail]
5,410942 [opencl_profiling] profiling device 0 ('Quadro P2000'):
5,410949 [opencl_profiling] spent  0,0146 seconds in [Write Image (from host to device)]
5,410958 [opencl_profiling] spent  0,0008 seconds in rawprepare_1f
5,410965 [opencl_profiling] spent  0,0008 seconds in whitebalance_1f
5,410974 [opencl_profiling] spent  0,0008 seconds in highlights_1f_clip
5,410979 [opencl_profiling] spent  0,0253 seconds in [Read Image (from device to host)]
5,410985 [opencl_profiling] spent  0,0024 seconds in [Copy Image (on device)]
5,410993 [opencl_profiling] spent  0,0047 seconds in clip_rotate_lanczos3
5,410999 [opencl_profiling] spent  0,0013 seconds in exposure
5,411005 [opencl_profiling] spent  0,0018 seconds in colorin_unbound
5,411015 [opencl_profiling] spent  0,0013 seconds in colorspaces_transform_rgb_matrix_to_lab
5,411021 [opencl_profiling] spent  0,0033 seconds in colorout
5,411027 [opencl_profiling] spent  0,0572 seconds totally in command queue (with 0 events missing)
5,411038 [dev_process_thumbnail] pixel pipeline processing took 1,812 secs (13,155 CPU)
BTW @aurelienpierre filmic_rgb is by far the biggest cpu-consumer. In source i see a cl process path and the kernels seem to be fine. But piece->process_cl_ready = FALSE; so we always run this module on cpu?
jenshannoschwalm
on 13 Jul 2020
Yep it’s not yet ported to opencl (at least v4, so,the kernels seems to be for v3)
MStraeten
on 13 Jul 2020
Yeah, that's the main performance "issue" i have, it might be also what @AxelG-DE was referring to.
I am way more concerned about what @bigntallmike described earlier in this report (although there are missing details so results might be confusng)
1) Only one cpu core seems to be active, should not be true if filmic4 is used
2) No cl processing report ... can't understand that really
jenshannoschwalm
on 13 Jul 2020
@jenshannoschwalm with that cmd line (and ts for consistent timestamping of the last part):
``Jul 14 00:00:49.106418 0.021624 [opencl_init] opencl related configuration options:
Jul 14 00:00:49.106501 0.021633 [opencl_init]
Jul 14 00:00:49.106514 0.021635 [opencl_init] opencl: 1
Jul 14 00:00:49.106524 0.021636 [opencl_init] opencl_scheduling_profile: 'very fast GPU'
Jul 14 00:00:49.106535 0.021637 [opencl_init] opencl_library: ''
Jul 14 00:00:49.106546 0.021640 [opencl_init] opencl_memory_requirement: 768
Jul 14 00:00:49.106557 0.021641 [opencl_init] opencl_memory_headroom: 400
Jul 14 00:00:49.106568 0.021642 [opencl_init] opencl_device_priority: '*/!0,*/*/*'
Jul 14 00:00:49.106578 0.021644 [opencl_init] opencl_mandatory_timeout: 200
Jul 14 00:00:49.106589 0.021645 [opencl_init] opencl_size_roundup: 16
Jul 14 00:00:49.106599 0.021646 [opencl_init] opencl_async_pixelpipe: 0
Jul 14 00:00:49.106609 0.021647 [opencl_init] opencl_synch_cache: active module
Jul 14 00:00:49.106619 0.021648 [opencl_init] opencl_number_event_handles: 25
Jul 14 00:00:49.106629 0.021649 [opencl_init] opencl_micro_nap: 1000
Jul 14 00:00:49.106639 0.021651 [opencl_init] opencl_use_pinned_memory: 0
Jul 14 00:00:49.106649 0.021652 [opencl_init] opencl_use_cpu_devices: 0
Jul 14 00:00:49.106659 0.021653 [opencl_init] opencl_avoid_atomics: 0
Jul 14 00:00:49.106668 0.021653 [opencl_init]
Jul 14 00:00:49.106746 0.021974 [opencl_init] found opencl runtime library 'libOpenCL'
Jul 14 00:00:49.106766 0.021997 [opencl_init] opencl library 'libOpenCL' found on your system and loaded
Jul 14 00:00:49.111621 0.026844 [opencl_init] found 1 platform
Jul 14 00:00:49.111640 0.026855 [opencl_init] found 1 device
Jul 14 00:00:49.111896 0.027126 [opencl_init] device 0GeForce RTX 2060' has sm_20 support.
Jul 14 00:00:49.112114 0.027345 [opencl_init] device 0 GeForce RTX 2060' supports image sizes of 32768 x 32768
Jul 14 00:00:49.112127 0.027348 [opencl_init] device 0GeForce RTX 2060' allows GPU memory allocations of up to 1483MB
Jul 14 00:00:49.340938 [opencl_init] device 0: GeForce RTX 2060
Jul 14 00:00:49.340995 GLOBAL_MEM_SIZE: 5934MB
Jul 14 00:00:49.341005 MAX_WORK_GROUP_SIZE: 1024
Jul 14 00:00:49.341015 MAX_WORK_ITEM_DIMENSIONS: 3
Jul 14 00:00:49.341024 MAX_WORK_ITEM_SIZES: [ 1024 1024 64 ]
Jul 14 00:00:49.341033 DRIVER_VERSION: 440.100
Jul 14 00:00:49.341042 DEVICE_VERSION: OpenCL 1.2 CUDA
Jul 14 00:00:49.341053 0.256141 [opencl_init] options for OpenCL compiler: -w -DNVIDIA_SM_20=1 -DNVIDIA=1 -I"/usr/share/darktable/kernels"
Jul 14 00:00:49.341065 0.256227 [opencl_init] compiling program `demosaic_ppg.cl' ..
Jul 14 00:00:49.341136 0.256363 [opencl_load_program] loaded cached binary program from file '/home/mike/.cache/darktable/cached_kernels_for_GeForceRTX2060_440100/demosaic_ppg.cl.bin' MD5: '2993261b9c0b8b7e11cee8d46b737ca6'
Jul 14 00:00:49.341149 0.256368 [opencl_load_program] successfully loaded program from '/usr/share/darktable/kernels/demosaic_ppg.cl' MD5: '2993261b9c0b8b7e11cee8d46b737ca6'
Jul 14 00:00:49.342842 0.258067 [opencl_build_program] successfully built program
Jul 14 00:00:49.342854 0.258074 [opencl_build_program] BUILD STATUS: 0
...
Jul 14 00:00:52.398125 3.313353 [opencl_create_kernel] successfully loaded kernel rgbcurve' (232) for device 0
Jul 14 00:00:52.678403 3.592940 [opencl_create_kernel] successfully loaded kernelrgblevels' (233) for device 0
Jul 14 00:00:52.679190 creating complete lighttable thumbnail cache
Jul 14 00:00:52.679221 creating cache directories
Jul 14 00:00:52.679238 creating cache directory '/home/mike/.cache/darktable/mipmaps-7ff51140548923c4807bae7f801339f82dd39ee0.d/0'
Jul 14 00:00:52.679257 creating cache directory '/home/mike/.cache/darktable/mipmaps-7ff51140548923c4807bae7f801339f82dd39ee0.d/1'
Jul 14 00:00:52.679274 creating cache directory '/home/mike/.cache/darktable/mipmaps-7ff51140548923c4807bae7f801339f82dd39ee0.d/2'
Jul 14 00:00:52.679291 creating cache directory '/home/mike/.cache/darktable/mipmaps-7ff51140548923c4807bae7f801339f82dd39ee0.d/3'
Jul 14 00:00:52.679307 creating cache directory '/home/mike/.cache/darktable/mipmaps-7ff51140548923c4807bae7f801339f82dd39ee0.d/4'
Jul 14 00:00:52.679324 creating cache directory '/home/mike/.cache/darktable/mipmaps-7ff51140548923c4807bae7f801339f82dd39ee0.d/5'
Jul 14 00:00:52.679907 image 1/8432 (0.01%) (id:1)
Jul 14 00:00:54.027445 image 2/8432 (0.02%) (id:2)
Jul 14 00:00:54.787898 image 3/8432 (0.04%) (id:3)
Jul 14 00:00:56.127167 image 4/8432 (0.05%) (id:4)
Jul 14 00:00:56.900209 image 5/8432 (0.06%) (id:5)
Jul 14 00:00:58.089831 image 6/8432 (0.07%) (id:6)
Jul 14 00:00:58.821024 image 7/8432 (0.08%) (id:7)
Jul 14 00:00:59.983059 image 8/8432 (0.09%) (id:8)
Jul 14 00:01:00.786474 image 9/8432 (0.11%) (id:9)
Jul 14 00:01:02.042905 image 10/8432 (0.12%) (id:10)
```
bigntallmike
on 14 Jul 2020
This issue did not get any activity in the past 30 days and will be closed in 365 days if no update occurs. Please check if the master branch has fixed it and report again or close the issue.
![github-actions[bot] picture](https://avatars2.githubusercontent.com/in/15368?v=4&s=40) github-actions[bot]
on 14 Aug 2020
github-actions[bot]
on 14 Aug 2020
@bigntallmike Hi, are you still around? On master there have been a number of PRs that might have improved the situation for you. Could you test again if you find the time?
jenshannoschwalm
on 28 Sep 2020
Related issues
 dim162
·
3Comments
dim162
·
3Comments
 jade-nl
·
3Comments
AxelG-DE
·
5Comments
jade-nl
·
3Comments
AxelG-DE
·
5Comments
 trougnouf
·
5Comments
trougnouf
·
5Comments
 ChristopherRogers1991
·
6Comments
ChristopherRogers1991
·
6Comments