Application version
4.5.0
Platform
iMac 5k, 2015, 4ghz i7, 48g ram
AMD Radeon R9 M395
Printer
Ender 3, marlin 2.0.5 - was set to remote with octopi plugin
Reproduction steps
open it
load stl (xyzCalibration_cube.stl)
slice
print
wait (shrug to exact, but log started at 10:36am --> now at ~5pm)
Screenshot(s)

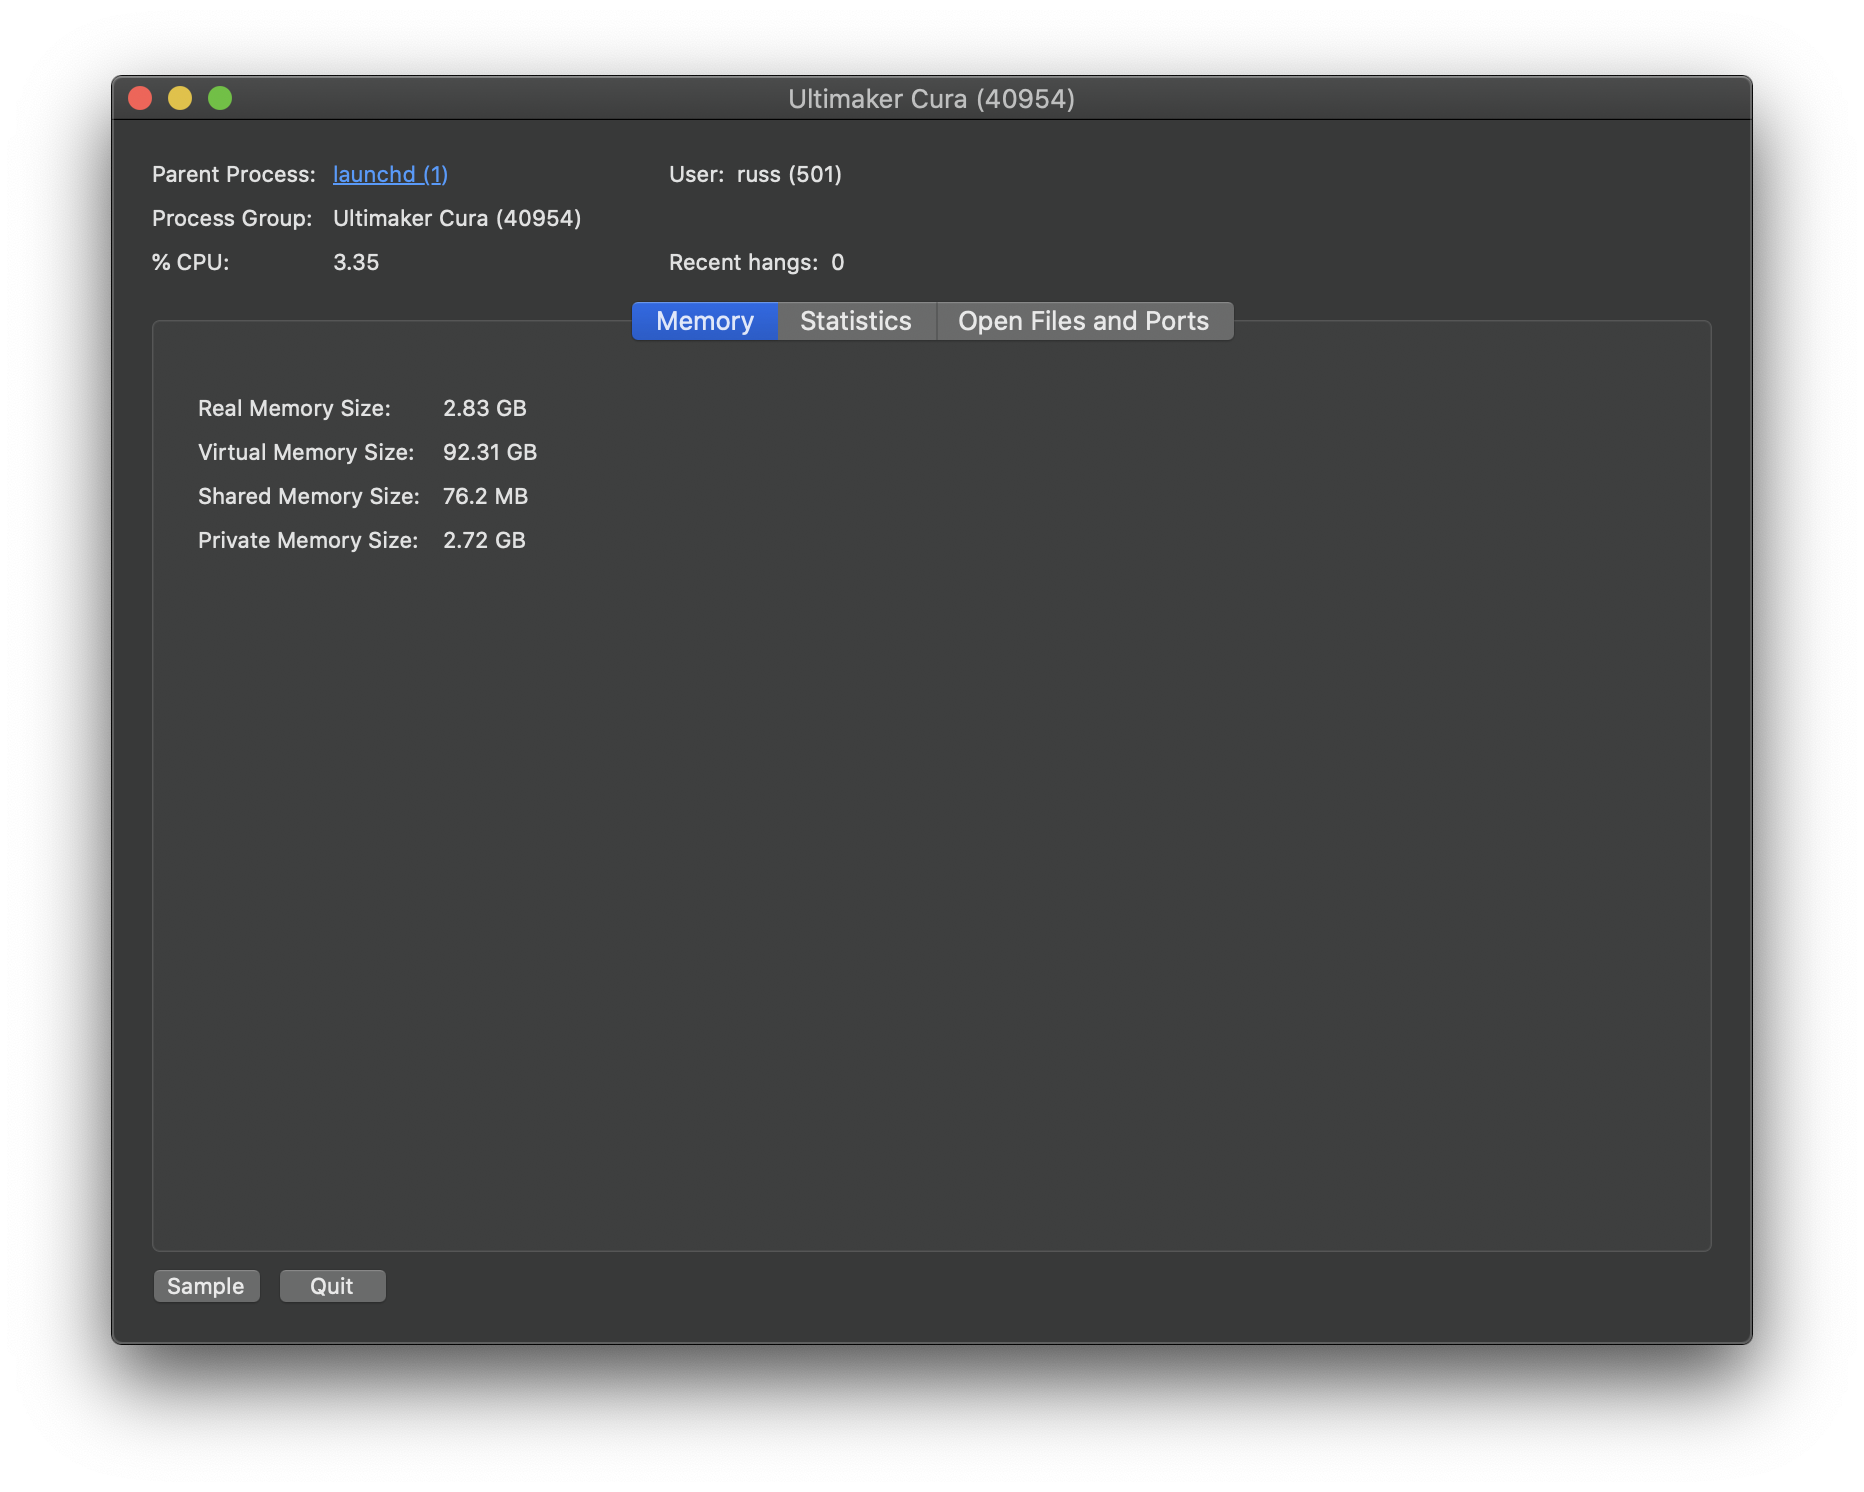

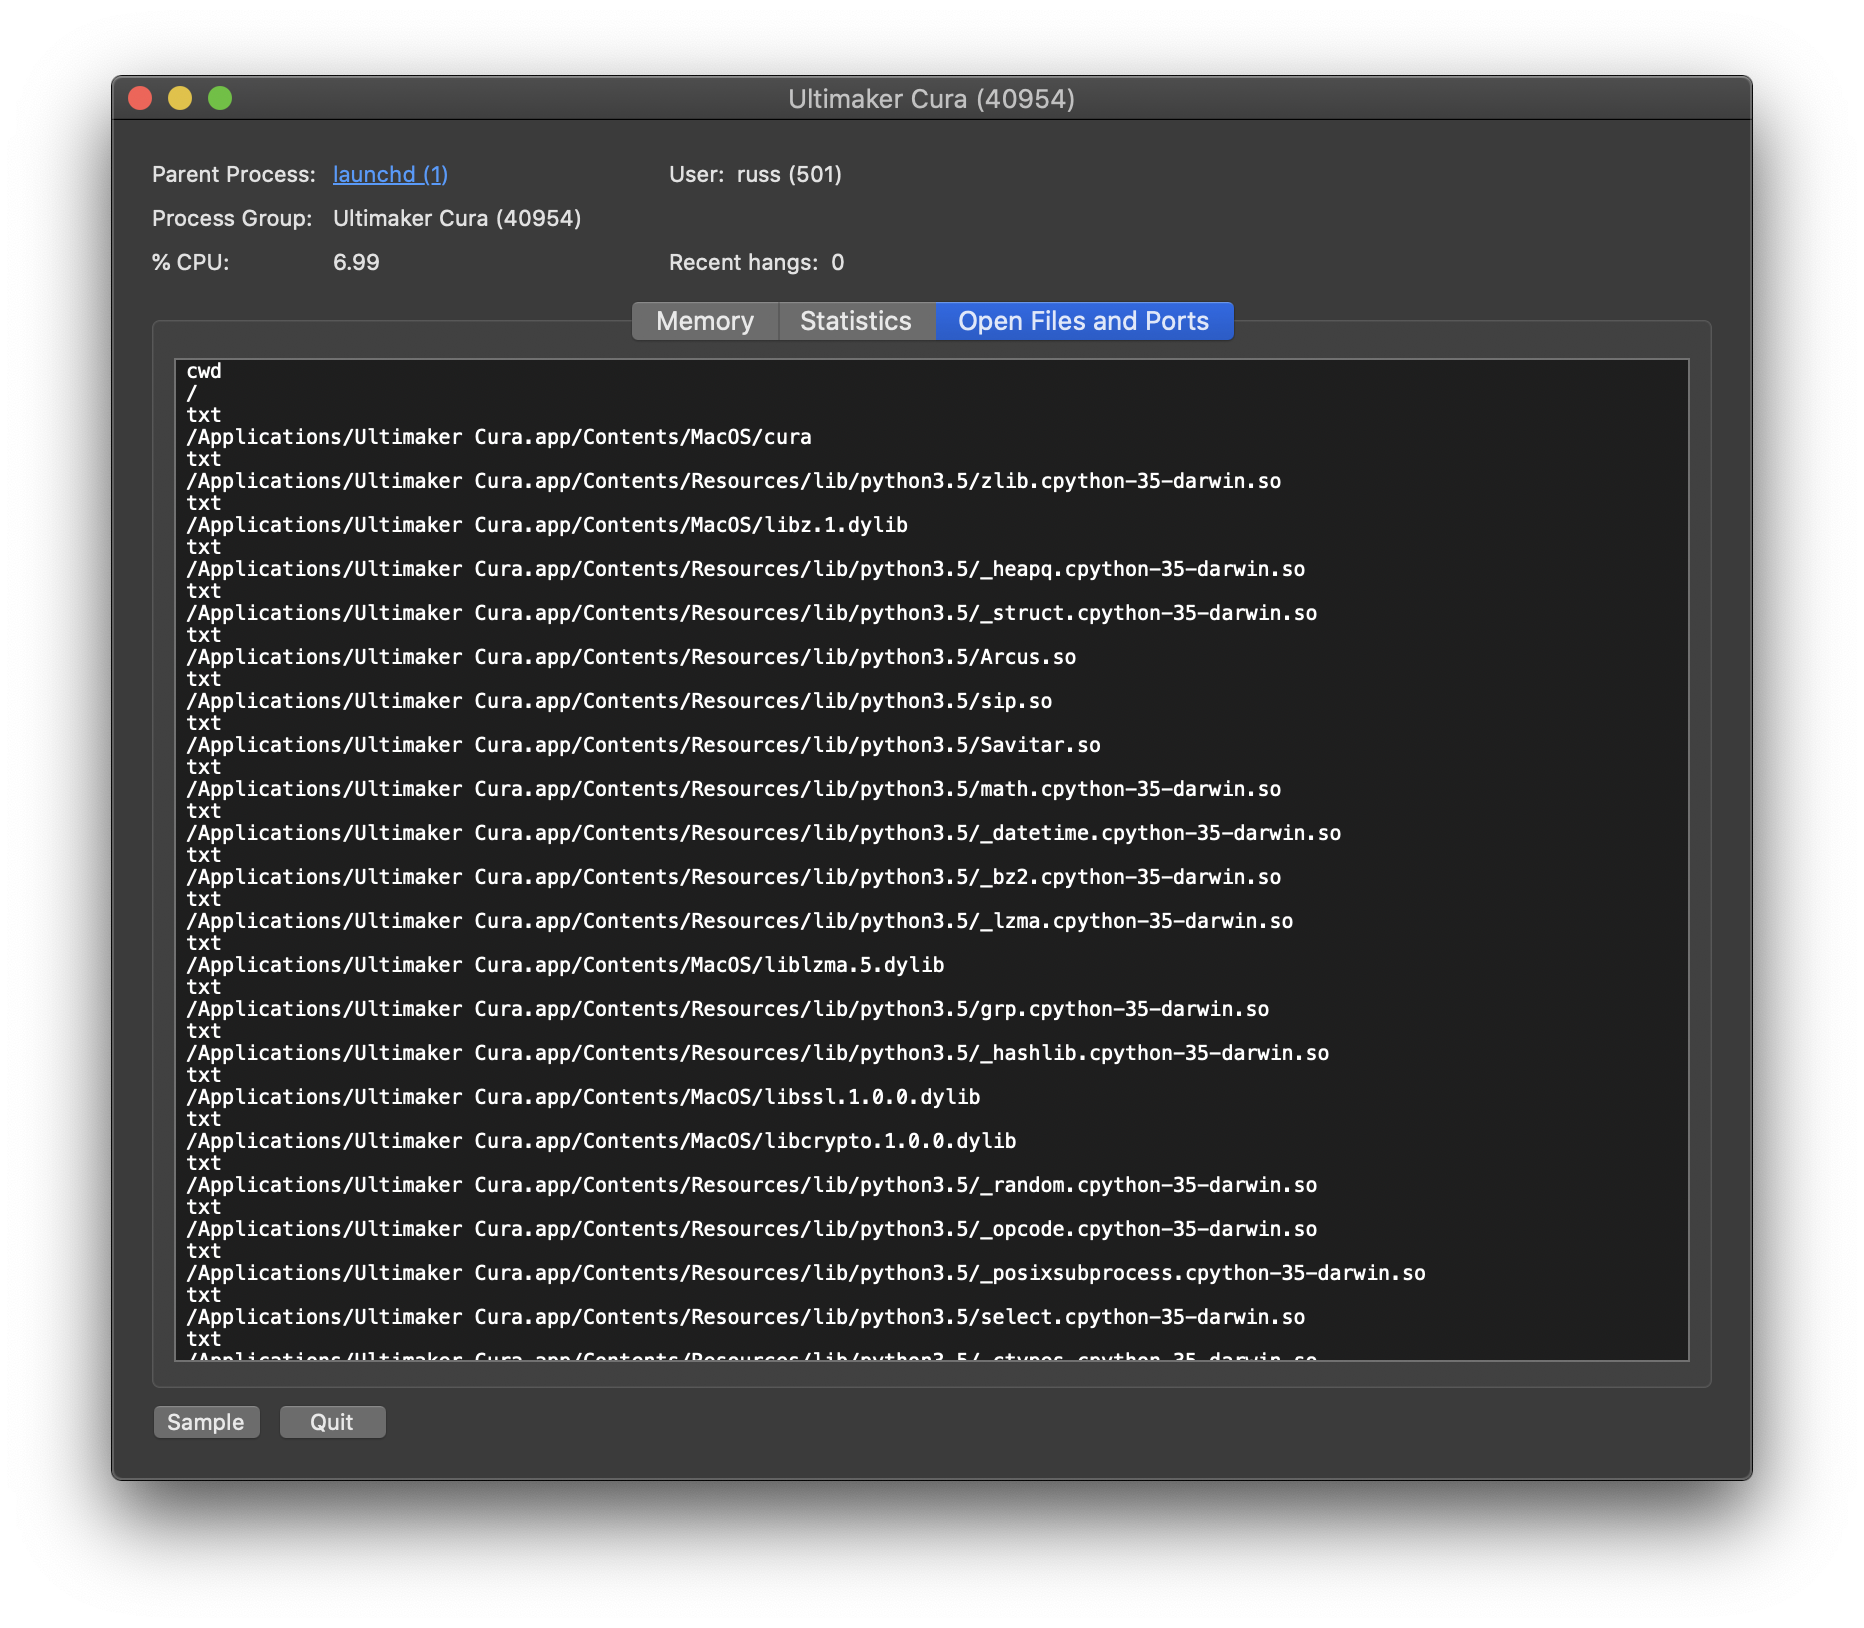
(all content: https://gist.github.com/ukd1/474618ada441056995907d969bbf7ddd)

Actual results
11g + of ram used
Expected results
a reasonable amount of ram used...?
Project file
https://www.thingiverse.com/thing:1278865 is the cube I used
Log file
https://gist.github.com/ukd1/c4262257271eaa282247f7edfe0d9100
Additional information
/shrug
 ukd1
ukd1
All 4 comments
We (or rather, @evtrados) ran your reproduction steps: Starting Cura (it was around 11:00 at the time), loading a model file, slicing, then waiting. It's 18:00 now and it's using about 300MB still. We're not seeing any excessive memory usage.
What we are not able to test is to print with an Ender 5 using OctoPrint. We don't have any OctoPrint printer here. Perhaps the problem is localised to this plug-in. We've had before that the Ultimaker wifi-printing plug-in was having a memory leak in the camera feed.
 Ghostkeeper
on 18 Mar 2020
Ghostkeeper
on 18 Mar 2020
@ukd1, it helps if you could try if you can reproduce this in a couple of variations
- does it also happen if you keep Cura open without printing?
- does it also happen if you don't have the OctoPrint instance running?
- does it also happen if you add another printer to Cura that is not connected to OctoPrint?
Also, did you have Cura open on the Monitor tab for most of the time, or on the Prepare tab as in your screenshot?
 fieldOfView
on 19 Mar 2020
fieldOfView
on 19 Mar 2020
If I could, I would add a "Status: Needs info" label
fieldOfView
on 23 Mar 2020
@fieldOfView closing, as I don't have any more info
ukd1
on 6 Apr 2020
Related issues
 mubarak111nsu
·
3Comments
mubarak111nsu
·
3Comments
 Liger0
·
3Comments
Liger0
·
3Comments
 JRRN
·
3Comments
JRRN
·
3Comments
 timherrm
·
3Comments
timherrm
·
3Comments
 rudowinger
·
3Comments
rudowinger
·
3Comments