There seems to be a memory leak in one of the Cura menu calls, all I did was click on the Settings main menu and the application froze as the memory usage went all the way up to 8.xx GiB, before completing some odd calculation and then slowly ramping back down to 6xx MiB. I don't believe it is slicing-related as I have auto-slicing disabled (Cura 2.5 beta).
 mqudsi
All 35 comments
mqudsi
on 1 Apr 2017
Autch. 80 mb logs.
I do see some issues with auto calculated values causing a lot of overhead, but that's about it.
 nallath
on 3 Apr 2017
nallath
on 3 Apr 2017
The logs show a division by 0 error towards the end:
2017-04-01 12:54:33,246 - DEBUG - UM.Logger.logException [74]: Exception: An exception occurred in inherit function =0 if infill_sparse_density == 100 else math.ceil(round(top_thickness / resolveOrValue('layer_height'), 4))
2017-04-01 12:54:33,247 - DEBUG - UM.Logger.logException [78]: Traceback (most recent call last):
2017-04-01 12:54:33,248 - DEBUG - UM.Logger.logException [78]:   File "D:/2.5/build/inst/lib/python3.5/site-packages/UM\Settings\SettingFunction.py", line 71, in __call__
2017-04-01 12:54:33,249 - DEBUG - UM.Logger.logException [78]:   File "<UM.Settings.SettingFunction (0x1f983ca64a8) =0 if infill_sparse_density == 100 else math.ceil(round(top_thickness / resolveOrValue('layer_height'), 4)) >", line 1, in <module>
2017-04-01 12:54:33,250 - DEBUG - UM.Logger.logException [78]: ZeroDivisionError: float division by zero
Apparently layer height was set to 0.
For the rest I don't see much that could indicate a memory leak. Not that we put memory usage in the logs.
Could it be the log file itself?
 Ghostkeeper
on 3 Apr 2017
Ghostkeeper
on 3 Apr 2017
The division by zero is because of the other bug I filed where Cura loses focus in the middle of a change to an edit box (so 0.06^H8 becomes 0 then I need to re-select the edit box and add the 8); it's not related to the bug I think.
I left Cura 2.5 running a job and came back to find my machine mostly unresponsive and Cura crashed. Windows told me my system was low on memory and everything was paged to the disk (this is with 32GiB of RAM). I routinely see Cura 2.5 at more than 10GiB of RAM now, but I'm not sure how to go about tracking this. I don't think it's a menu issue either, I think that was a red herring. Didn't have any issues with 2.4, fwiw.
mqudsi
on 3 Apr 2017
Hmm, so it's either something we introduced in 2.5 or the log.
Since apparently Cura keeps growing over time rather than taking that 10GiB at the beginning, the log file seems ruled out.
Perhaps the new layer view is a candidate then, since it's comparatively close to hardware. You could try setting layer view to compatibility mode (it's in the preferences).
Another candidate could be the way in which we load 3MF files now, or perhaps even the print monitor.
I haven't seen any of these issues by the way. I regularly leave Cura open all day at work.
Ghostkeeper
on 4 Apr 2017
I don't know if it's the same issue as the one I initially reported, but I'm able to reliably induce a memory leak in Cura 2.5b by dragging-and-dropping a 3mf file to Cura, deleting the model, and repeating. Each time Cura.exe's memory usage goes up by anywhere from 250 to 400 MiB. (that's after the load is complete; during the load process an additional ~800MiB of memory are reserved then released.)
mqudsi
on 4 Apr 2017
Hmm, indeed it does reproduce when loading 3MF files, so perhaps libSavitar has a memory leak somewhere.
Ghostkeeper
on 5 Apr 2017
I'm honestly not too worried about this particular leak, it seems like your standard one-time allocation without free type of bug. However, if I've earned your trust enough for you to take an unverified report at face value, my primary concern is a memory leak that is happening somewhere in a loop that can crash Cura and bring down the system with it as memory allocations bubble up into the tens of gigabytes rather rapidly, which is what my original report concerned. I was printing a 3MF file at the time, so perhaps it is related to that (created via Cura via the "save as project" feature, though I doubt that matters).
I imagine once opened the contents of STL and 3MF files are treated identically? Or is there any 3MF-specific code that isn't isolated to file open/save?
mqudsi
on 5 Apr 2017
Once the code is opened it's indeed treated exactly the same. 3MF can do certain things that STL can't (like grouped objects and the like) but I don't imagine that would make such a difference.
The print monitor view is quite memory heavy due to the video stream. The mjpeg streamer of Qt was broken, so a rather nasty way of streaming the images is used instead.
nallath
on 6 Apr 2017
I'm pretty sure that I had left Cura on the print monitor tab. I'm not talking about heavy memory usage but a memory leak, though - do you think there could be one with the jpeg streaming method? I kept an eye on it for the last few prints (same build), but didn't see any ballooning memory usage.. so I'm wondering if there are any corner cases where the print monitor streams differently or something.
mqudsi
on 6 Apr 2017
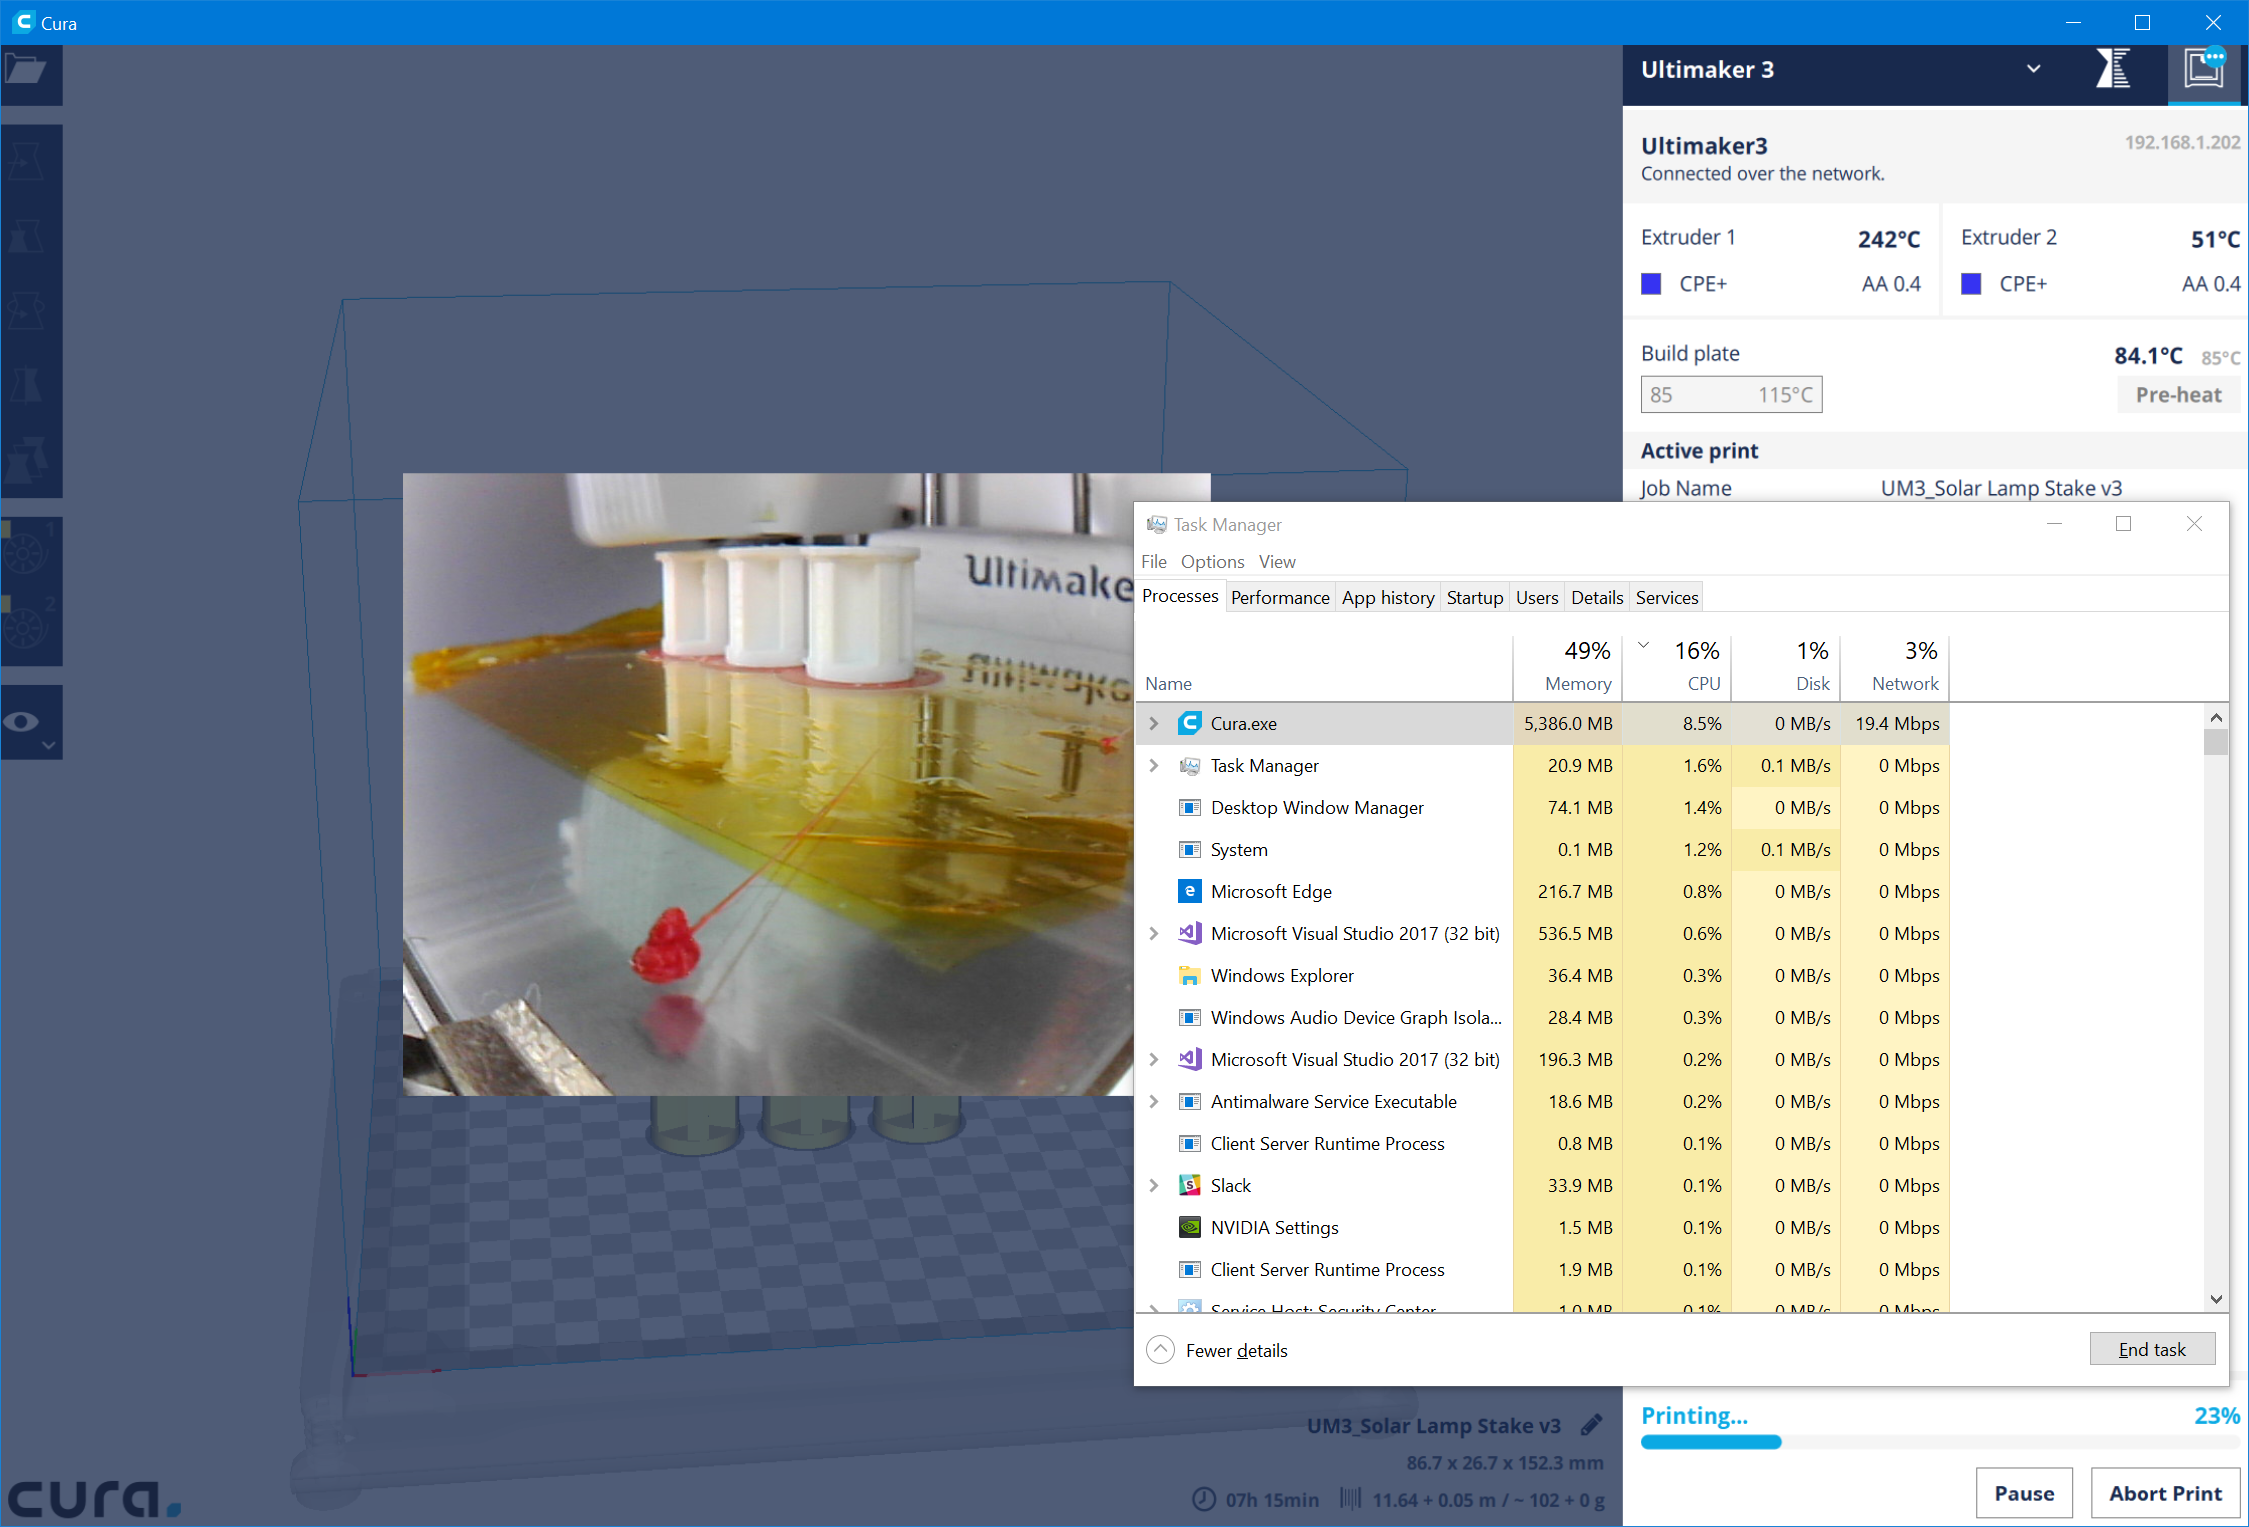
On the print monitor tab, Cura.exe going up around 0.5MiB each second. Currently at 4.7GiB, no memory collections happening:

Could the mjpeg stills be accumulating in resident memory?
mqudsi
on 7 Apr 2017
Could be. Python should use reference counting to garbage collect.
nallath
on 7 Apr 2017
Not on the video stream. That's all Qt as far as I know.
Ghostkeeper
on 7 Apr 2017
This was perhaps the most straightforward case for me. I dragged-and-dropped a simple STL and immediately hit "prepare" then "print" (no fiddling with anything, no 3mf), and then stayed on the print monitor page thereafter. A couple of hours later, Cura was at 22GiB.

I am not a pythonista, are binary string buffers in Python immutable objects and does this code fragment below trigger a future collection of all data up to stream_buffer_end_index + 2?
self._stream_buffer = self._stream_buffer[stream_buffer_end_index + 2:]
Because if not, I don't see the stream buffer being cleared/freed anywhere, only appended to.
mqudsi
on 16 Apr 2017
The python syntax actually cuts (stream_buffer_end_index + 2) bytes from the beginning (the : at the end means "untill the end of the string, as it omits the end index).
 fieldOfView
on 16 Apr 2017
fieldOfView
on 16 Apr 2017
Thanks. (like Matlab)
mqudsi
on 16 Apr 2017
The Python "slice" copies all data and puts it in a new list, so I'd expect the above code to allocate a new list to put the remainder of the bytes in, and then free the old list.
Ghostkeeper
on 18 Apr 2017
If you don't print anything but just stay on the monitor page, does it accumulate memory then?
I'm gonna test that over lunch (but I am on Linux).
Edit: It stayed at 390MB throughout the hour. It's not reproducing.
Ghostkeeper
on 18 Apr 2017
I just printed without a leak either, but Cura was in the background. Maybe it only happens if it's in the foreground?
I spent several hours yesterday figuring out how to run Cura in a debugger. It's curious, even when the main thread is paused for debugging the memory usage was ballooning. Perhaps the background network listener?
mqudsi
on 19 Apr 2017
If the application is paused in the debugger, none of its threads should be running unless the debugger is doing really odd things. Have you checked whether it is the frontend or CuraEngine that is eating memory?
 awhiemstra
on 20 Apr 2017
awhiemstra
on 20 Apr 2017
Is there a way to check while the application is running if the frontend or the engine is taking up the memory?
mqudsi
on 20 Apr 2017
Here's something interesting: running in the debugger with the UM3 network plugin active and watching the printer jpeg stream, there was no memory leak (I could see bytes being allocated and freed). But as soon as I accepted the pending permissions request on the UM3, the memory leak began on the client.
mqudsi
on 20 Apr 2017
(I did a small "happy dance" because that suggests the issue is not in my mjpg hack/code)
fieldOfView
on 20 Apr 2017
I think I may have tracked it down. @fieldOfView I'm afraid I was a little hasty in my previous analysis. Upgrading to Beta 2 cleaned things up a lot, and I think I finally have something solid.
It seems that at some point the mjpeg stream is not what cura expects it to be and the memory balloons. When the memory leak happens, the camera feed image is frozen (not updating). Based off the code, I see that we keep appending to the mjpeg buffer until a valid start and end frame are detected, at which point the picture is updated. If, for some reason, the expected jpeg sequence isn't found, the appends will go on indefinitely and memory usage will balloon. I'm not sure why the start/end markers are not being found (I also don't know enough about Python to say that's actually what's happening - perhaps it's something else such as the thread that handles the network received callback crashing and not processing any more callbacks, while the QT network stream continues to receive data?).
This is a list of allocations in the program:
cura allocations.csv.txt
mqudsi
on 3 May 2017
Nevermind, yet again. 18GB but the camera stream is still going strong.
mqudsi
on 4 May 2017
It's an emotional rollercoaster!
fieldOfView
on 4 May 2017
Just as an fyi, still in 2.6 beta. 🤷♂️
mqudsi
on 11 Jun 2017
See #2380
fieldOfView
on 4 Sep 2017
The memory leak in the camera image is fixed now.
Ghostkeeper
on 4 Dec 2017
Oops, but the leak in loading 3MF files isn't. But our project manager just removed this issue from the planning for being older than 12 weeks.
Ghostkeeper
on 4 Dec 2017
I would hate to look under the carpet at UM HQ...
fieldOfView
on 4 Dec 2017
Deferred because of inactivity
 jackha
on 18 Jul 2018
jackha
on 18 Jul 2018
I just launched Cura 3.5.1 on macOS 10.14.1 on my laptop and opened up two stl files, then multiplied both objects (so that there were two of each), let them slice, and then hit the print button. Because I have the octoprint plugin installed, the resulting gcode was sent directly to my printer and the streaming video of the print was displayed in Cura's 'monitor' tab. About 15 minutes later, macOS informed me that I needed to force quit some applications as I'd run out of system memory. I took a screenshot. Spoiler-alert (and in case the image hosting ever goes away), 23.32GB.
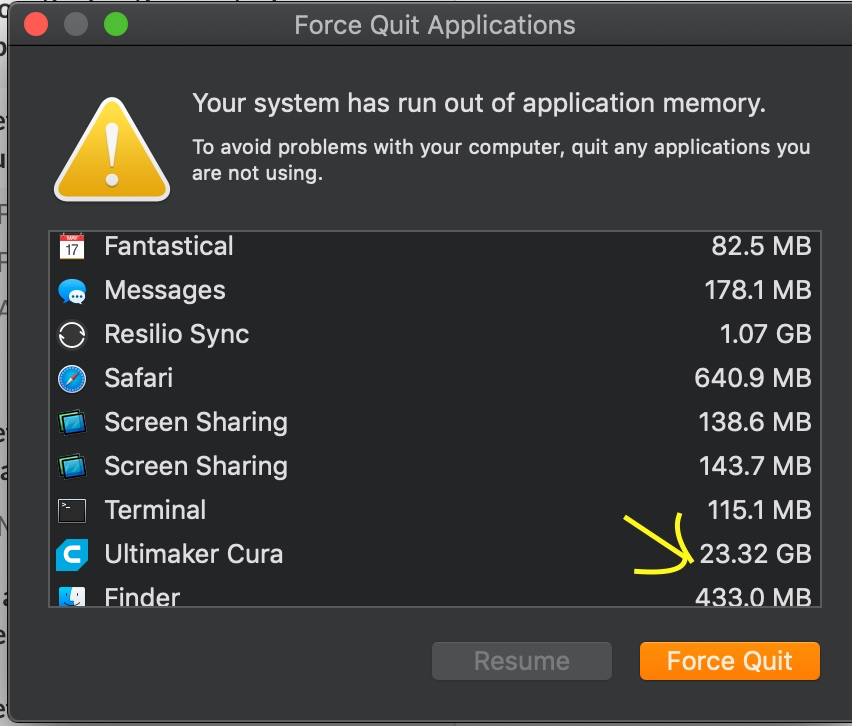
Unfortunately, in order to actually do anything on my computer I had to force quit Cura, so I couldn't dive further in order to try and determine what part of it was eating all that memory. I'm also not likely knowledgeable enough to easily figure that out without assistance as I've never touched Python.
I'm guessing that the exact STL files and the settings I used for the slicing might not be part of the problem. But just in case they're of use, I've put the STL files here. I'd upload a .3mf file, but I had to force-quit Cura and thus wouldn't be able to make one from the exact workspace that led to the problem. I could retrace my steps and make one if it would be of use.
 czyz
on 19 Oct 2018
czyz
on 19 Oct 2018
@czyz The issue you are replying to is about Cura 2.5. Your problem seems to be a new (and unrelated) problem with Cura 3.5. See https://github.com/Ultimaker/Cura/issues/4626
fieldOfView
on 22 Oct 2018
As we're 2 major versions further now, I doubt that this issue is still valid / a thing, so I'm closing this.
nallath
on 4 Apr 2019
Related issues
 jellewie
·
3Comments
jellewie
·
3Comments
 timherrm
·
3Comments
timherrm
·
3Comments
 dstulken
·
3Comments
dstulken
·
3Comments
 JRRN
·
3Comments
JRRN
·
3Comments
 DamianSepczuk
·
3Comments
DamianSepczuk
·
3Comments
Most helpful comment
I would hate to look under the carpet at UM HQ...