Covid19india-react: Adding a Yesterday stats button
Hi, I'd like to recommend a yesterday statistics button, which shows stats of yesterday statewise/district wise.
kinda similar to https://www.worldometers.info/coronavirus/
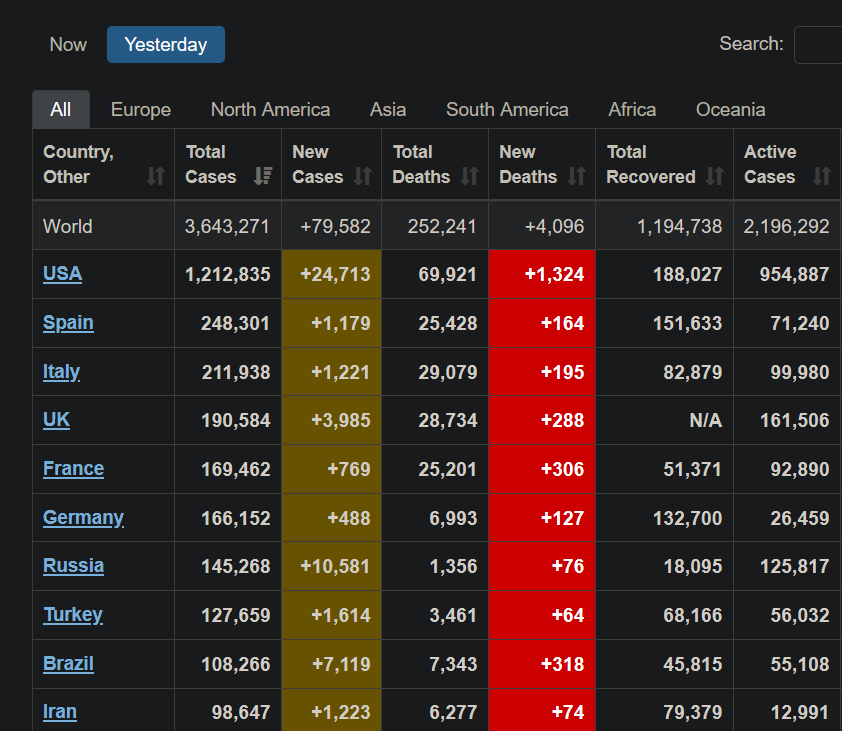
Loving the website, amazing work, keep it up! Hopefully I can contribute, learning react/express myself. :)
 ShivS01
All 13 comments
I was in the middle of the opening this issue but just saw it appeared already. Good Work. Hopefully, this issue gonna reviewed soon.
 vipul1999
on 5 May 2020
vipul1999
on 5 May 2020
+1
I was going to open this feature request.
 pratikgupta123
on 5 May 2020
pratikgupta123
on 5 May 2020
Since we already have a delta per district/state, what's the advantage of this yesterday's data?
 bee-rickey
on 5 May 2020
bee-rickey
on 5 May 2020
Since we already have a delta per district/state, what's the advantage of this yesterday's data?
The graphs are good, but with the yesterday's button, one could simply see the numbers in the same list on the home screen. Just saves time and keeps stuff clutter free who don't want to go too deep into stats.
Though it's not necessary, but I think it's a convenient feature to have.
ShivS01
on 5 May 2020
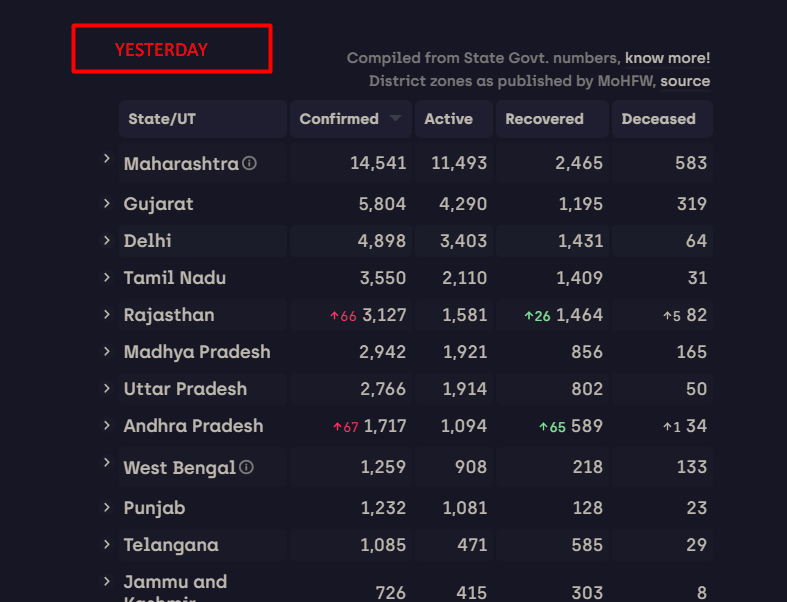
Like if a person clicks the button, the counters beside the state/district attributes render yesterday's data.
It gives a good idea if you see yesterday's data as it summarizes the whole day's data, rather than today's data which is updated dynamically.
Yesterday's data is static, gives more idea of the growth in short and concise way I think, so that is why it's probably a good idea to have one.
ShivS01
on 5 May 2020
Adding to @ShivS01 's point.
A Yesterday button will provide a way to see the District wise numbers for yesterday which is not present in the state page.
pratikgupta123
on 6 May 2020
@bee-rickey
Hoping that this feature will be added soon.
pratikgupta123
on 14 May 2020
@pratikgupta123 I’m not convinced. We already have the delta arrow per district. We have delta arrow per state. How does showing yesterday’s number help? Example, UP has more than 70 districts. If we provide a toggle to yesterday’s numbers you’ll see 70*3 data points. Will keep this open and request other mods to weigh in. @sudevschiz @jeremyphilemon
bee-rickey
on 14 May 2020
It is nice to see yesterday's delta. It gives a static point of reference. And some people might find it useful to compare deltas of similarly affected states.
E.g. If I were to compare Maharashtra & Tamil Nadu's rate of recovery, it will be more convenient to compare yesterday's delta, because cases for the same day don't get reported at the same frequency. Now, you can go to individual state and check their detailed graphs, but checking for yesterday's delta quickly might be helpful for comparing 3-4 states.
Another example: If I missed checking the dashboard yesterday night, and want to check the final deltas for yesterday the next morning I wake up.
Let me know if I can help on this. I'm a JS developer, and can work on this over the weekend.
cc @bee-rickey @sudevschiz @jeremyphilemon
 ayush000
on 29 May 2020
ayush000
on 29 May 2020
Closed by #2009 after introducing the timeline :)
 jeremyphilemon
on 1 Jun 2020
jeremyphilemon
on 1 Jun 2020
@jeremyphilemon the timeline feature is awesome!
Just one observation, the state number change as I move in the timeline but the district number change only when I hover over them or the state map. Is this intended behaviour? or should they change automatically too?
pratikgupta123
on 2 Jun 2020
Amazing work!
ayush000
on 2 Jun 2020
Closed by #2009 after introducing the timeline :)
Cool feature.
Is the feature only for the landing page and not available to state pages?
ShivS01
on 2 Jun 2020
Related issues
 DashmeetArt
·
5Comments
jeremyphilemon
·
6Comments
DashmeetArt
·
5Comments
jeremyphilemon
·
6Comments
 iDhruv22
·
6Comments
iDhruv22
·
6Comments
 Cryptonex7
·
6Comments
Cryptonex7
·
6Comments
 abbhhiisseek
·
5Comments
abbhhiisseek
·
5Comments
Most helpful comment
It is nice to see yesterday's delta. It gives a static point of reference. And some people might find it useful to compare deltas of similarly affected states.
E.g. If I were to compare Maharashtra & Tamil Nadu's rate of recovery, it will be more convenient to compare yesterday's delta, because cases for the same day don't get reported at the same frequency. Now, you can go to individual state and check their detailed graphs, but checking for yesterday's delta quickly might be helpful for comparing 3-4 states.
Another example: If I missed checking the dashboard yesterday night, and want to check the final deltas for yesterday the next morning I wake up.
Let me know if I can help on this. I'm a JS developer, and can work on this over the weekend.
cc @bee-rickey @sudevschiz @jeremyphilemon