Covid19india-react: daily active cases gone negative in timeseries graph
Describe the bug
Suppose no. of active cases decreases from day X to day Y. That means there is no addition to no. of active cases for day Y. So my point is : should we show negative value or zero in the daily active cases timeseries graph for day Y.
To Reproduce
Steps to reproduce the behavior:
- Go to the state page of Tamil Nadu
- Scroll down to timeseries graphs for Tamil Nadu
- Choose daily button
- Notice the active graph
_Note : There are other states too with such scenario._
Expected behavior
Should we show negative values or zero ?
Screenshots
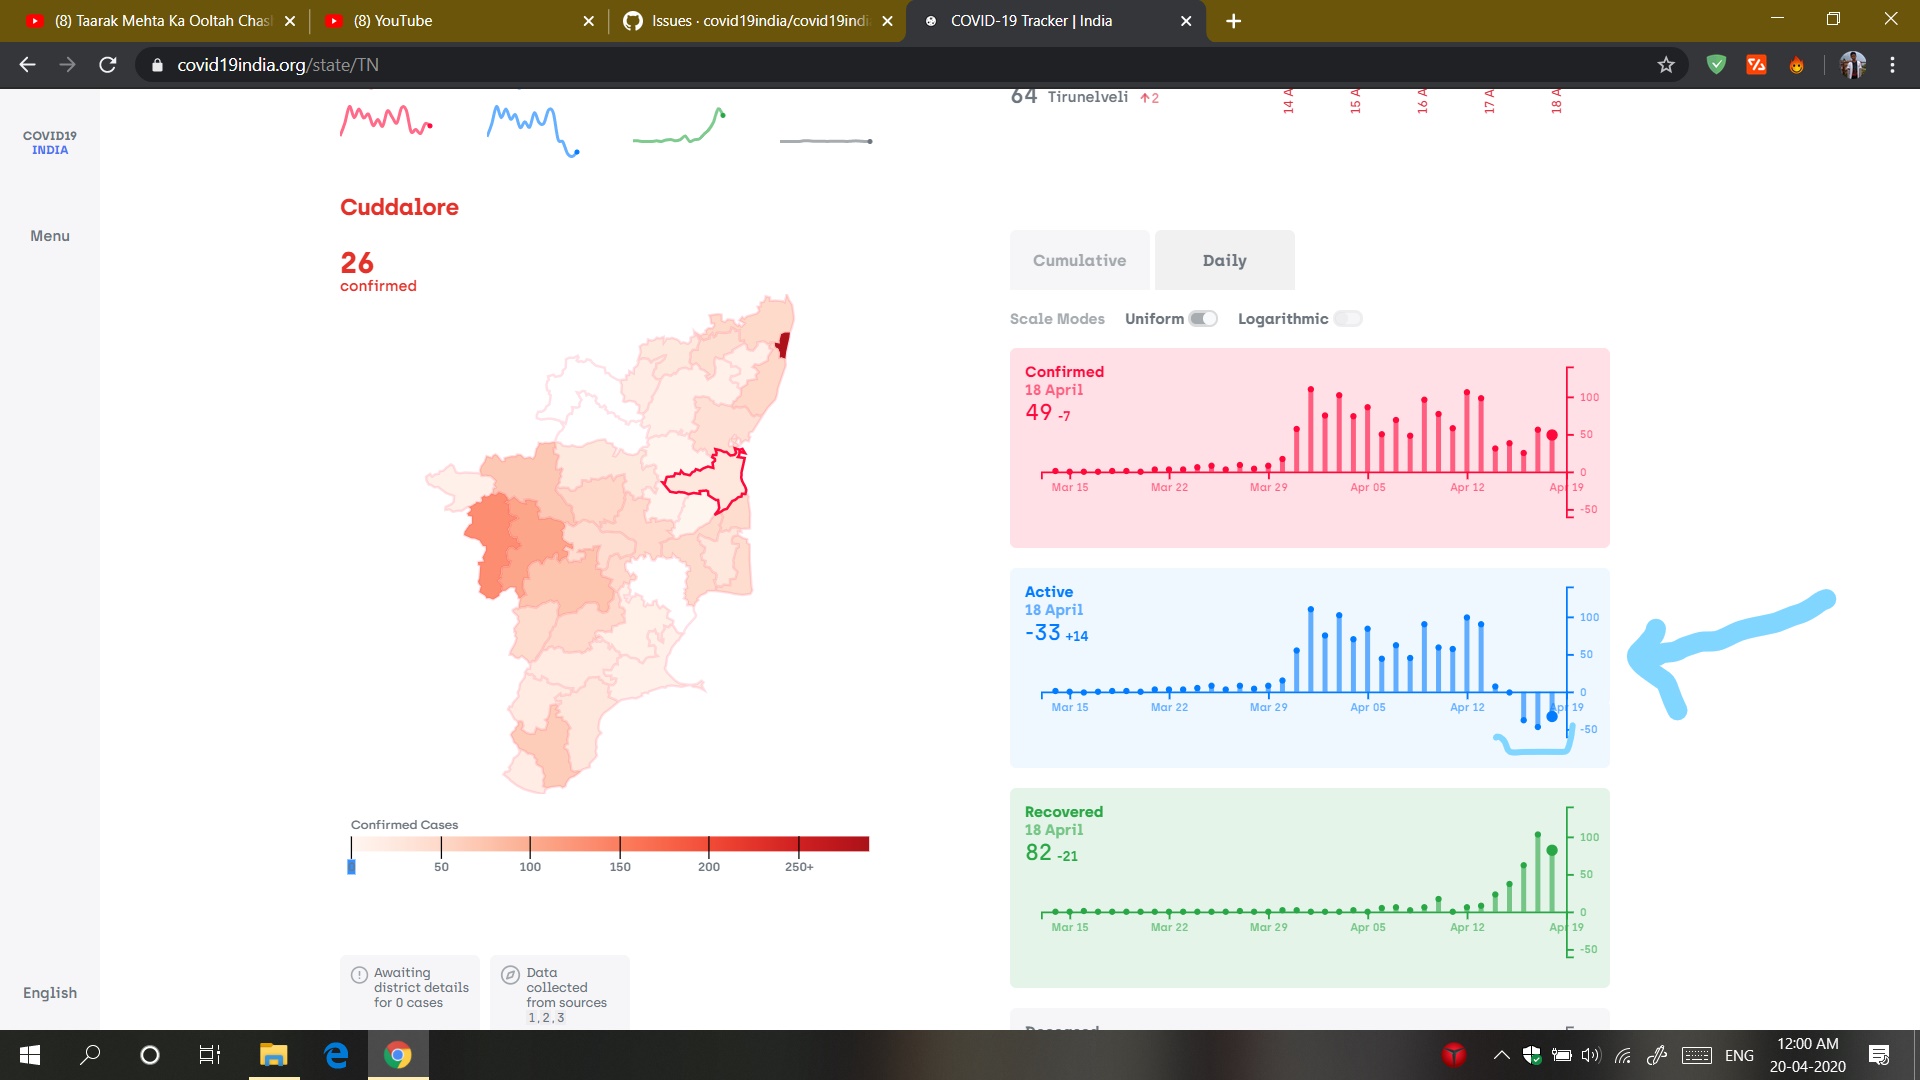
**Addional Context
Normally the cumulative graph of confirmed, recovered and deceased cases will always be increasing except active cases. So such case will only happen in active cases.
 nayakrahul
All 13 comments
You can assign it to me if you feel it to be relevant.
nayakrahul
on 19 Apr 2020
What's the point of showing zero instead of negative values for change in active cases?
 shuklaayush
on 20 Apr 2020
shuklaayush
on 20 Apr 2020
I agree with @shuklaayush. There is no point showing 0 in place of negative.
I feel the daily active case has no significance, active cases should always be cumulative therefore the active case chart from daily should be removed .
 Abhinav-Mani
on 20 Apr 2020
Abhinav-Mani
on 20 Apr 2020
I agree with @Abhinav-Mani . Daily active cases chart doesn't make any sense.
Let me explain with an example
On day 1, person A, B and C are confirmed positive and on day 2, person D and E are confirmed positive but A dies and B recovers. So for day 1, daily active cases is 3. And for day 2, daily active cases is 0 (by formula: confirmed - recovered - deceased) but actually there are 2 active cases added in day 2.
nayakrahul
on 20 Apr 2020
I don't see what the confusion is. Active represents the number of people alive who have the virus right now. Thus, it captures the extent of the spread at this point in time. In your example, there were 3 such people on day 1, and on day 2, it remained at 3. Hence, the delta is 0. It makes perfect sense in my opinion.
shuklaayush
on 20 Apr 2020
@shuklaayush in current version many states are showing -ve active cases. So if a state X shows -10 active case for 19 April 2020. Does this have any significance ? Or what does it mean?
Abhinav-Mani
on 20 Apr 2020
It means that the number of Active Covid-19 cases decreased by 10 on that day. This could be either because people recovered or because they died.
The daily graphs don't represent "active cases for 19 April 2020". Rather, they represent the change in the total Active cases on 19 April 2020.
shuklaayush
on 20 Apr 2020
In daily chart for confirmed cases, it shows the no. of confirmed persons in a day which is equal to the delta itself (cumulative for current day - cumulative for previous day). Same for recovered and deceased. But for daily active cases, it is just the delta or how much the total number of cases has increased or decreased by.
nayakrahul
on 20 Apr 2020
Yes, exactly.
Please close this thread if there's no further confusion.
shuklaayush
on 20 Apr 2020
@shuklaayush @nayakrahul I still think this is confusing. I think others also think in the same way (presumably so many issues are getting created because of that). My suggestion is to change the title of the chart from "Active" to "Change in active cases" when the "Daily" tab is selected.
 jaibatrik
on 4 May 2020
jaibatrik
on 4 May 2020
@shuklaayush @nayakrahul I still think this is confusing. I think others also think in the same way (presumably, so many issues are getting created because of that). My suggestion is to change the title of the chart from "Active" to "Change in active cases" when the "Daily" tab is selected.
Actually, all the daily charts are change in _ cases only.
nayakrahul
on 4 May 2020
Yeah, just that in case of "Active", it's a bit confusing with those negative numbers; which is why I was suggesting verbosity.
If you observe, the "Active" does not sit well in the daily category - it is the only metric that can go negative there. It does not really belong there.
jaibatrik
on 4 May 2020
Adding a note using tooltip might be useful here.
nayakrahul
on 4 May 2020
Related issues
 Cryptonex7
·
6Comments
Cryptonex7
·
6Comments
 Vaibhav2812
·
4Comments
Vaibhav2812
·
4Comments
 mohammedrehan275
·
6Comments
mohammedrehan275
·
6Comments
 DashmeetArt
·
5Comments
DashmeetArt
·
5Comments
 SumanthKongani
·
6Comments
SumanthKongani
·
6Comments
Most helpful comment
It means that the number of Active Covid-19 cases decreased by 10 on that day. This could be either because people recovered or because they died.
The daily graphs don't represent "active cases for 19 April 2020". Rather, they represent the change in the total Active cases on 19 April 2020.