Covid19india-react: Idea: Integrate the globe visualization
Is your feature request related to a problem? Please describe.
Currently, covid19india doesn't depict the seriousness of the problem in a visual manner which should be easy to understand by an average joe. Exponential graphs are not much relatable to a wider audience especially with rural areas or non-mathematical minds, etc.
Describe the solution you'd like
I would like to integrate another open-source project with the same objective.
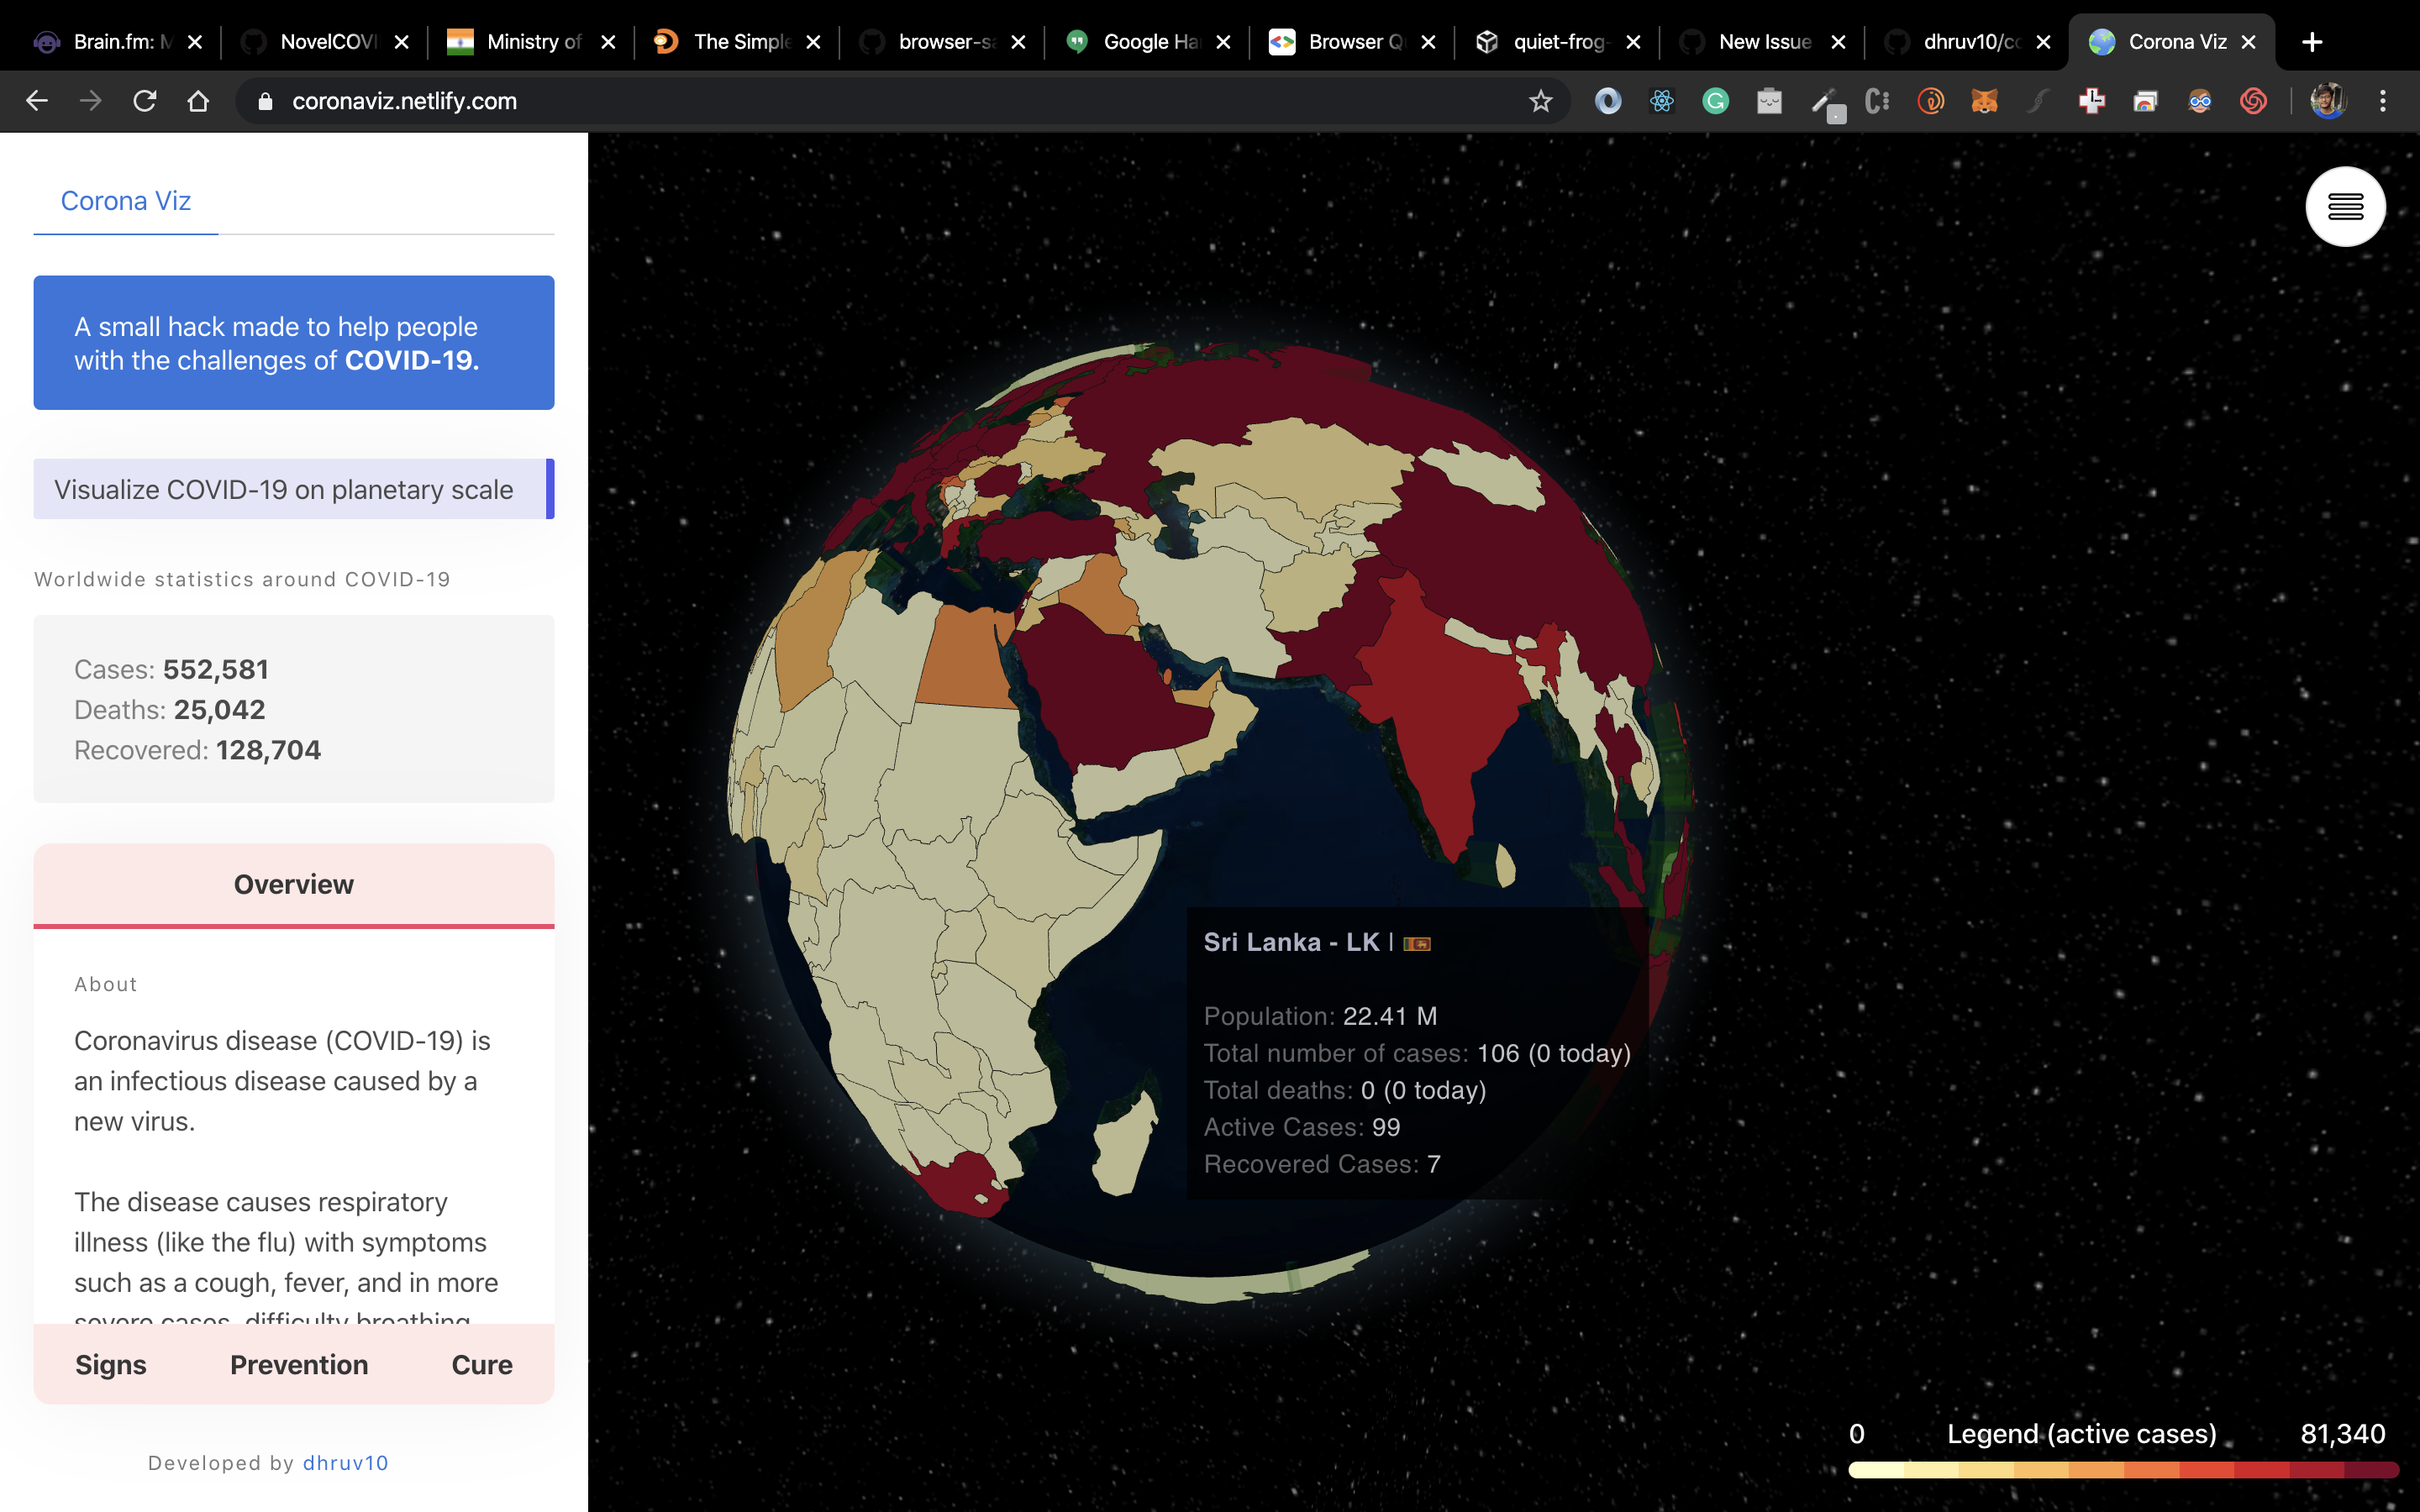
Corona Viz visualizes the planetary distribution of COVID19 with real-time statistics with an objective to remind people to stay inside & prevent the whole planet from becoming red. This viz shows the global pandemic from a bird's eye view and people get to know how serious it is. This project GitHub repository sits here.
Additional context
I would like to collab with your data and make it granular to the state or district level. We can even make it generic can allow people to add data for other countries as well based on crowd-sourced data.
This would bring even more traction to the project.
Here is an image of the viz:
 dhruv10
All 2 comments
Nice Suggestion.
The visualization of data will be a great help to make this project engaging and interesting.
Comparisons in the increase of cases wrt the population in a region also help to analyze the scenario the situation.
 shivamkansal
on 27 Mar 2020
shivamkansal
on 27 Mar 2020
Hi, Great suggestion! It would be so cool.
However, this would be out of our scope. Please feel free to use our data to work on this. Thank you.
Closing.
 sudevschiz
on 27 Mar 2020
sudevschiz
on 27 Mar 2020
Related issues
 DikshantYadav19
·
5Comments
DikshantYadav19
·
5Comments
 ninjakx
·
3Comments
ninjakx
·
3Comments
 amita-kapoor
·
3Comments
amita-kapoor
·
3Comments
 iDhruv22
·
6Comments
iDhruv22
·
6Comments
 DashmeetArt
·
5Comments
DashmeetArt
·
5Comments
Most helpful comment
Nice Suggestion.
The visualization of data will be a great help to make this project engaging and interesting.
Comparisons in the increase of cases wrt the population in a region also help to analyze the scenario the situation.