Covid_19: Drop in hospitalization numbers
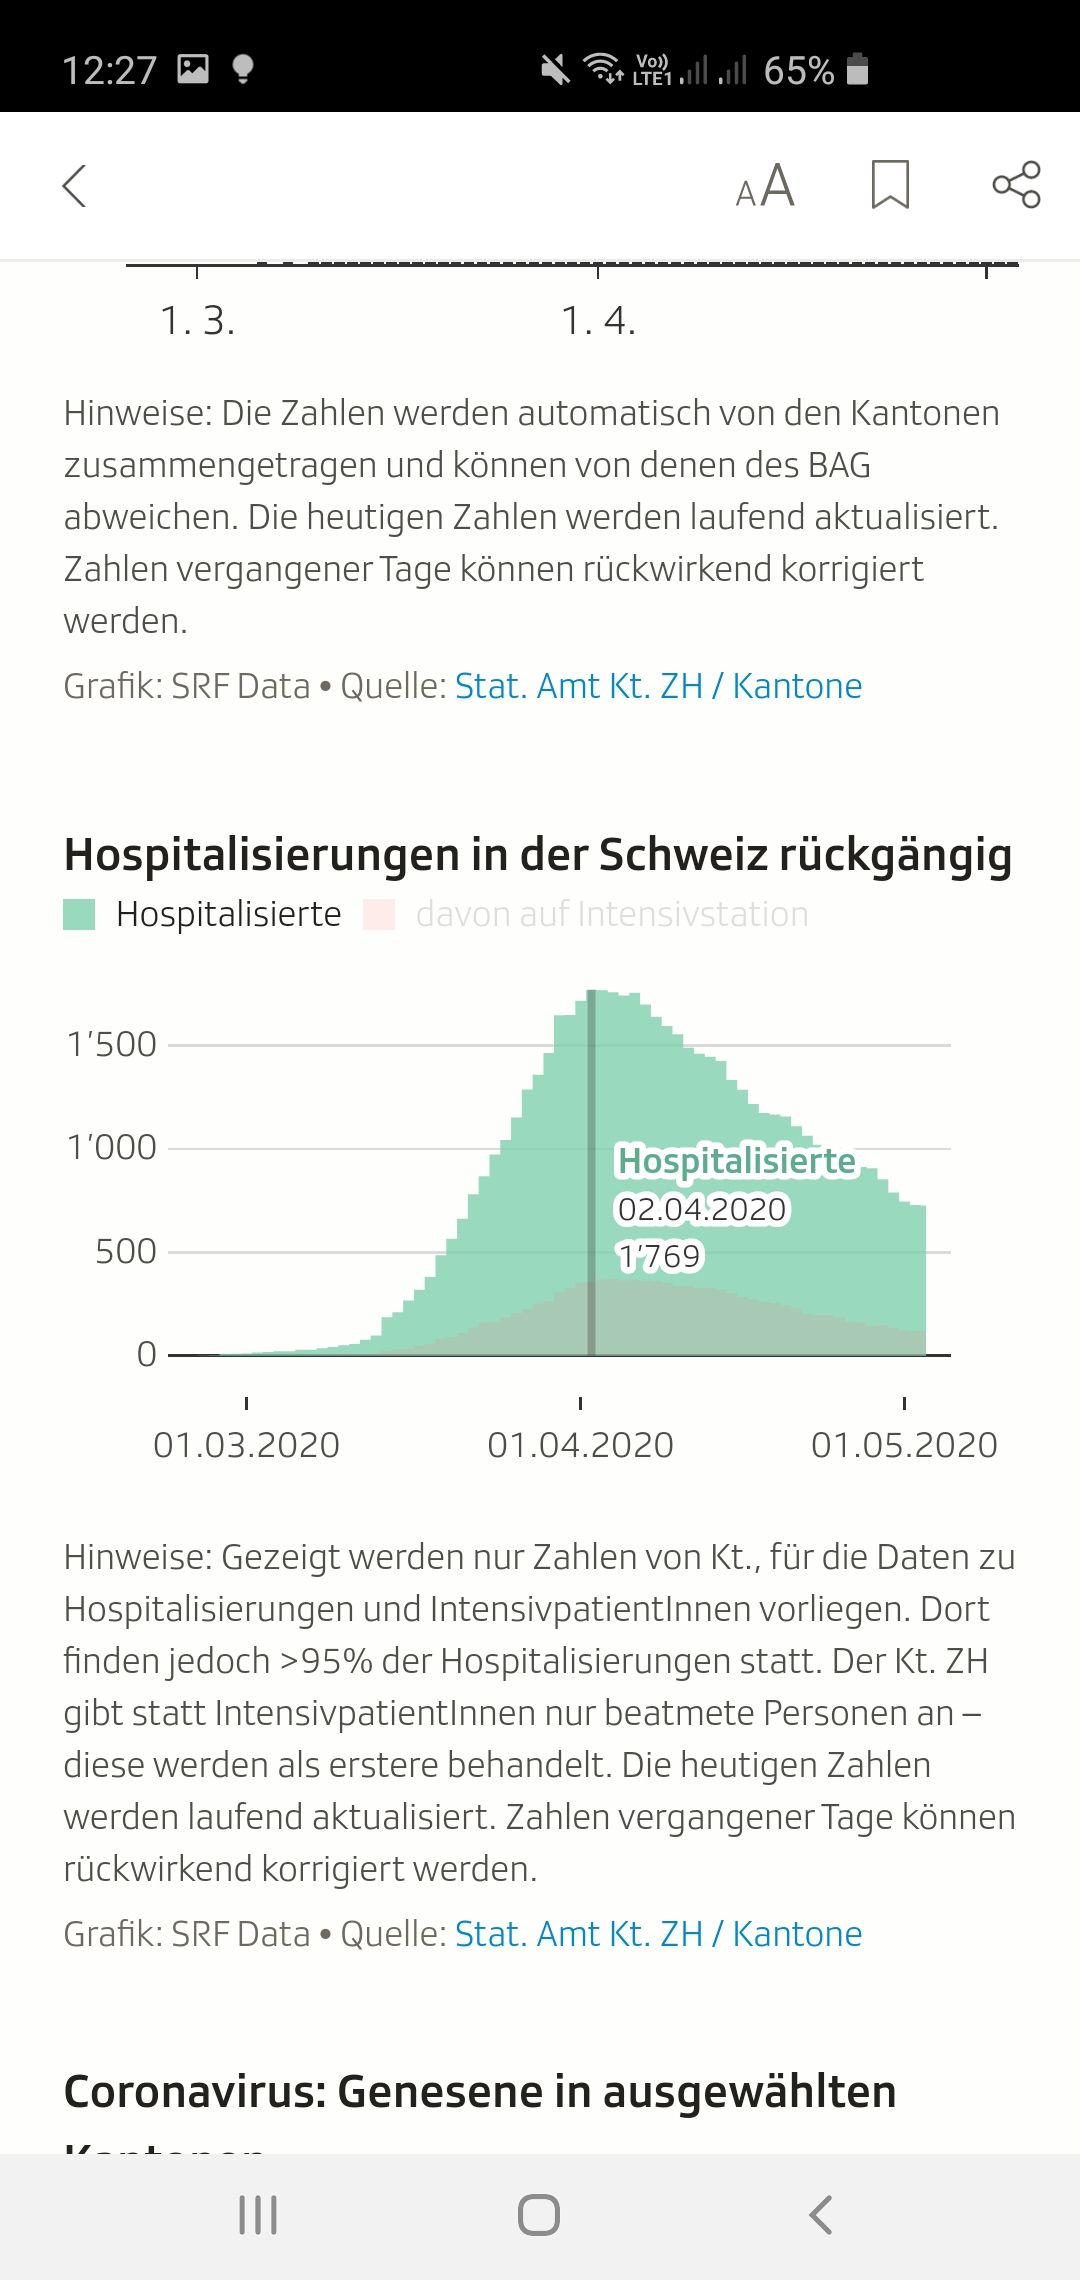
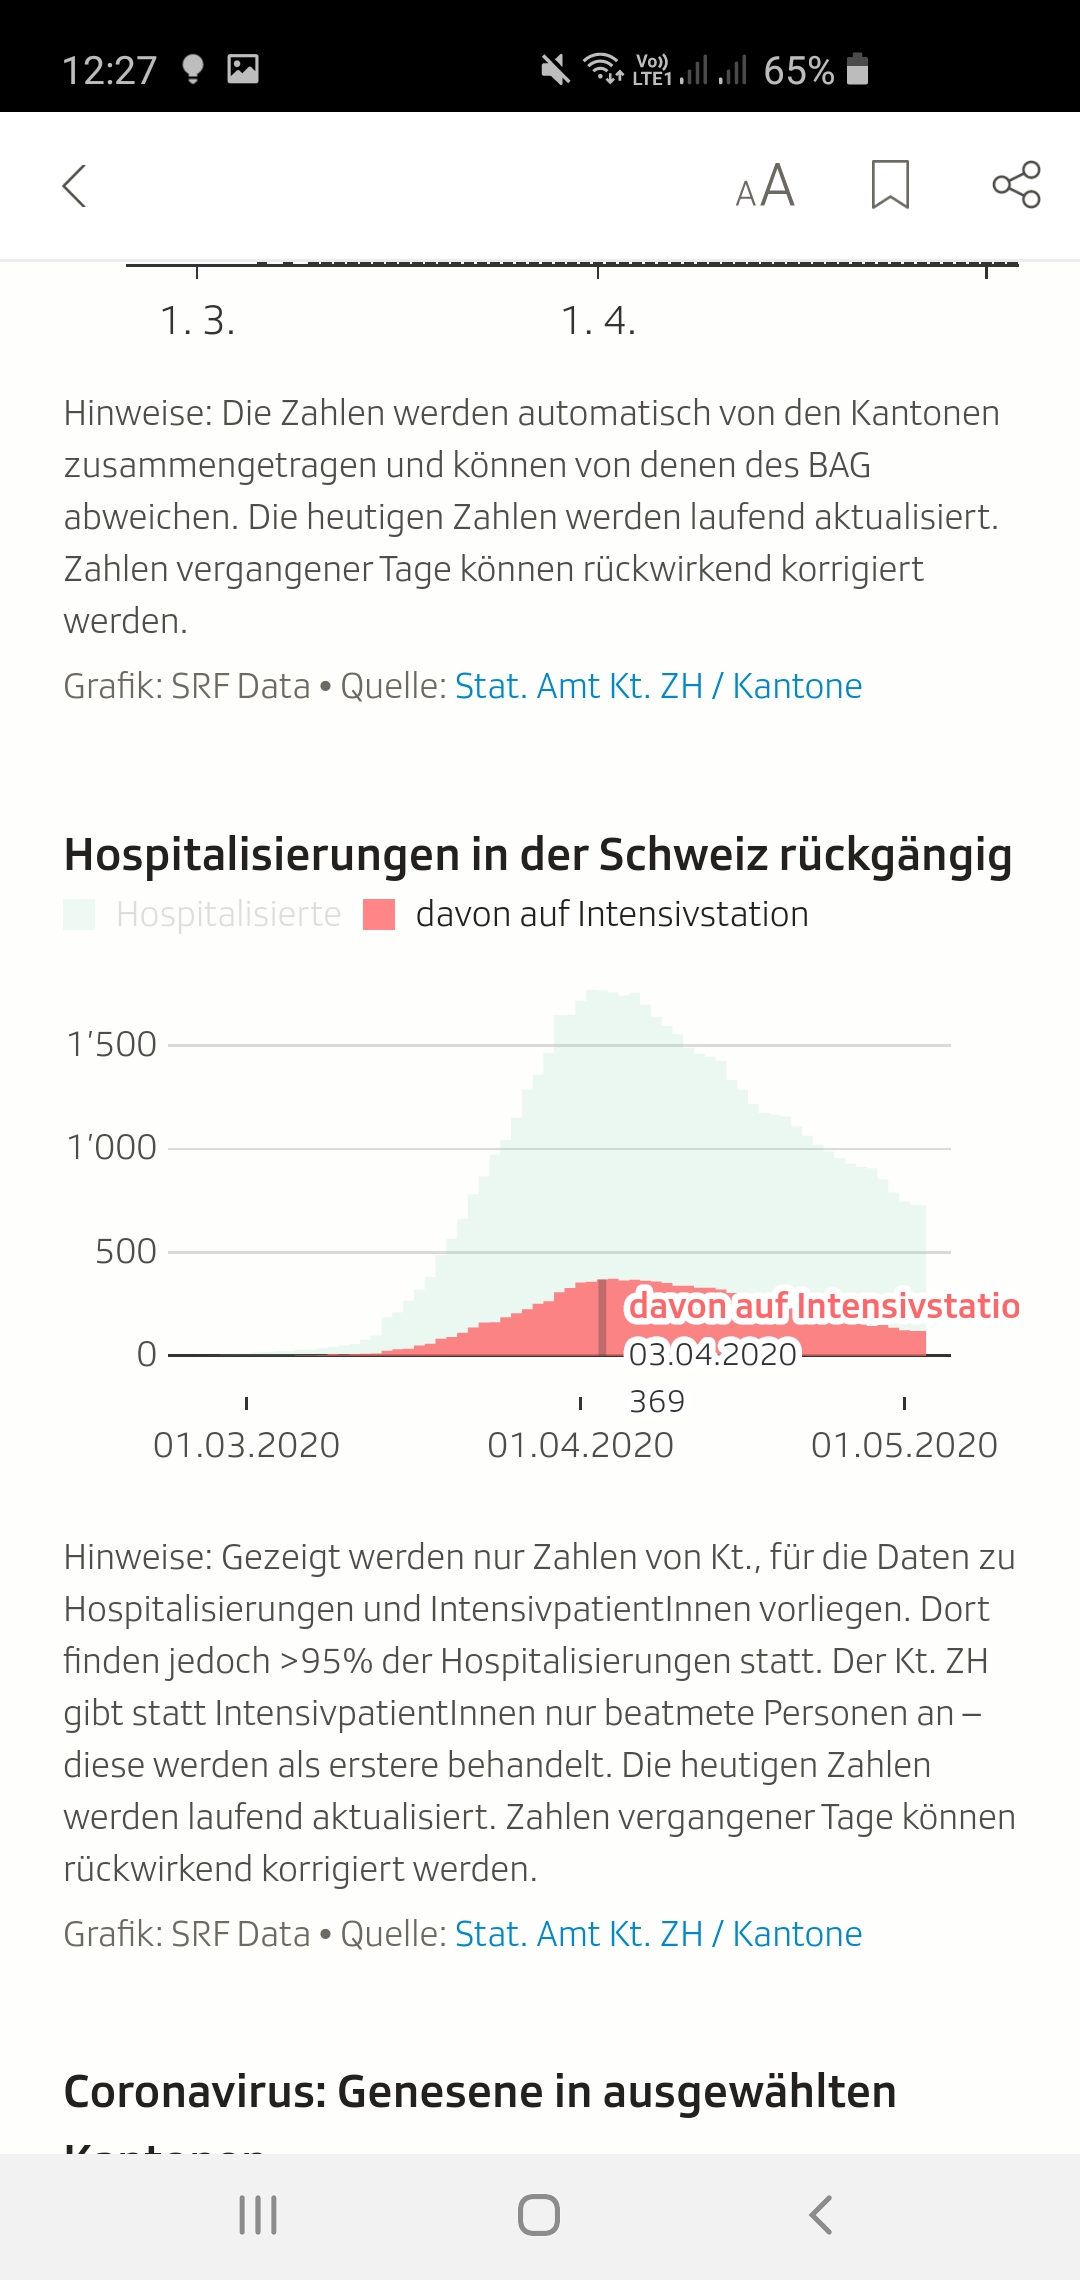
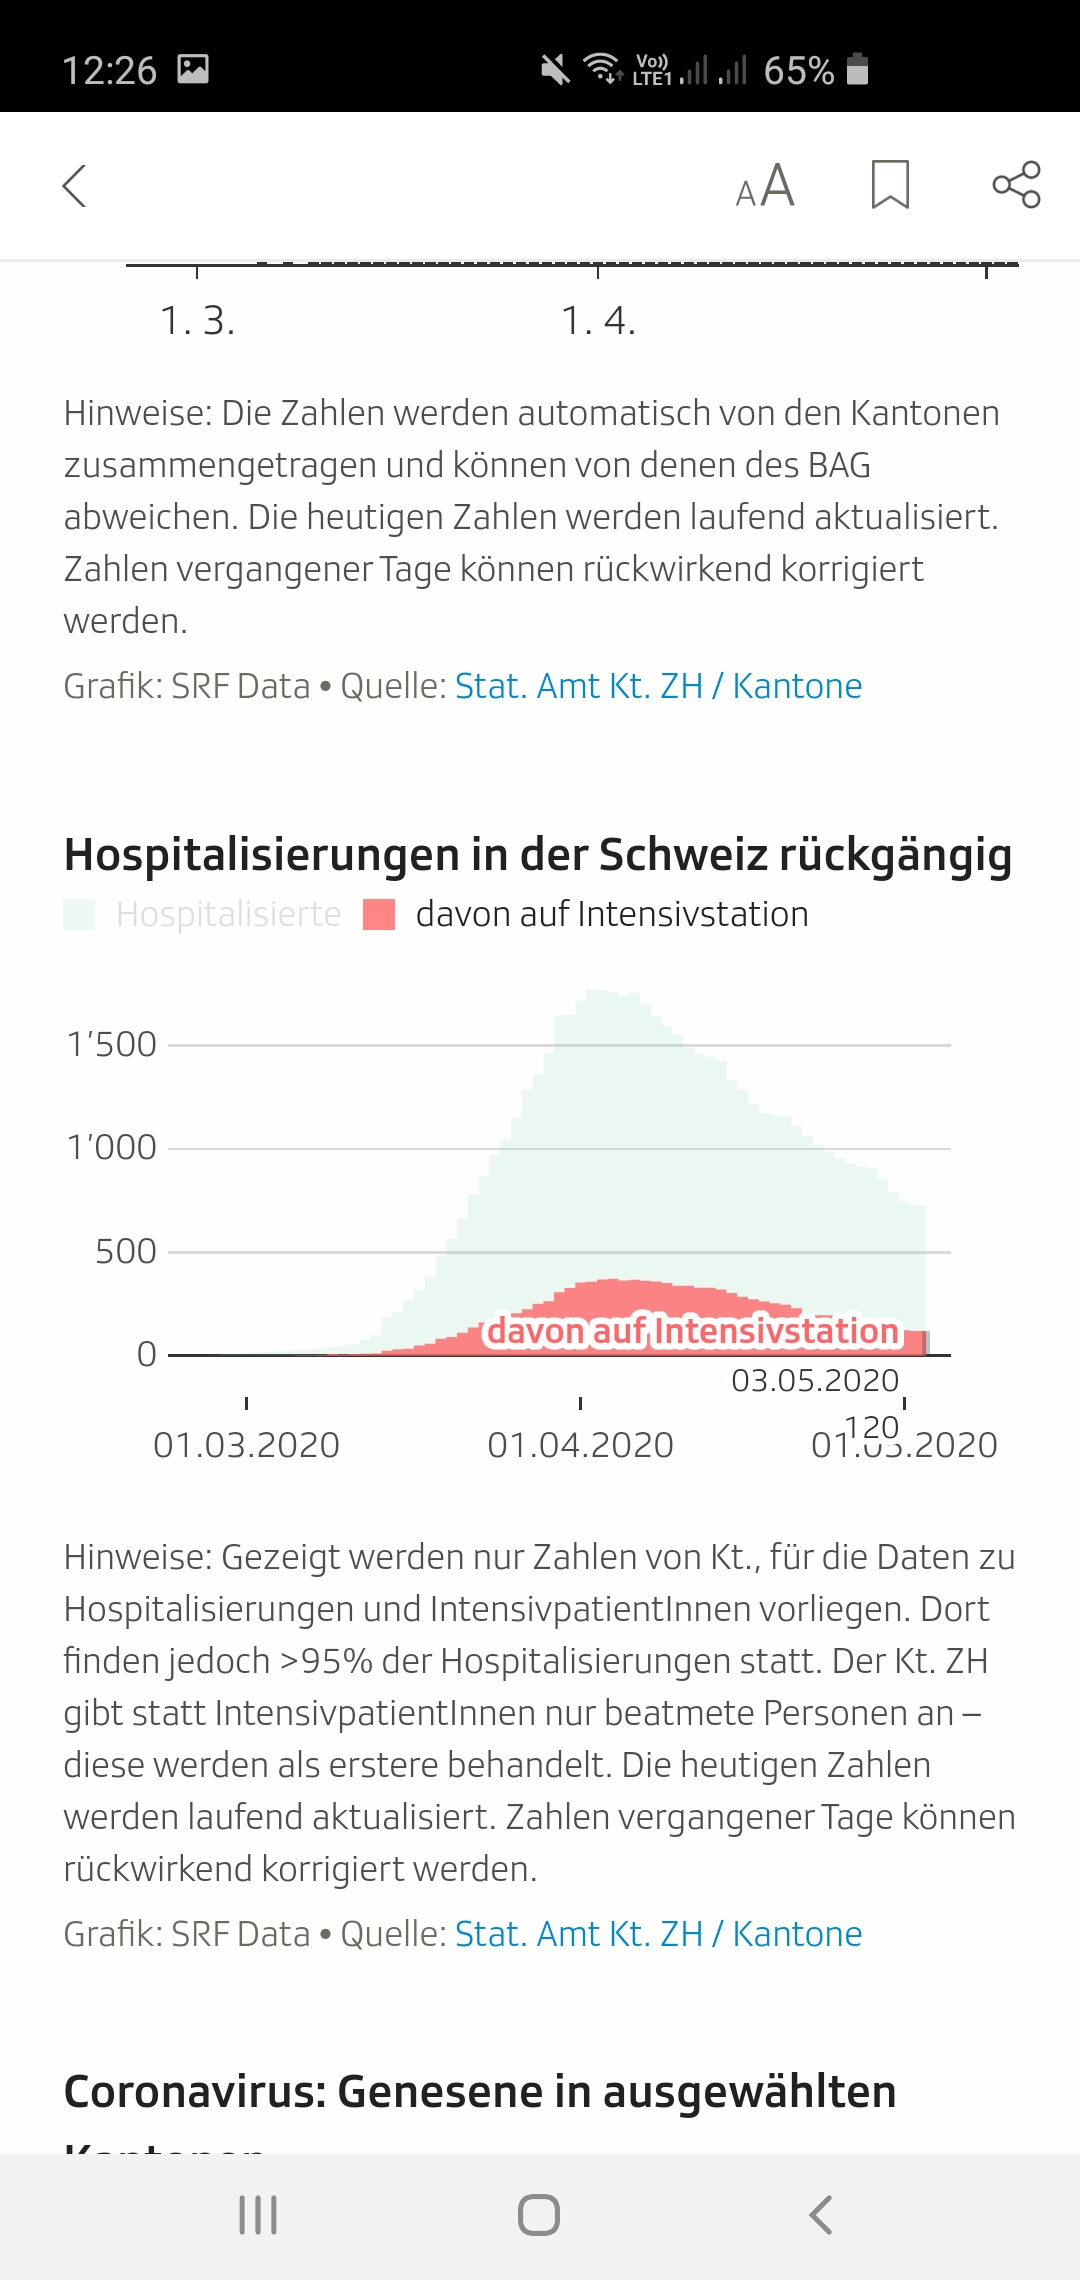
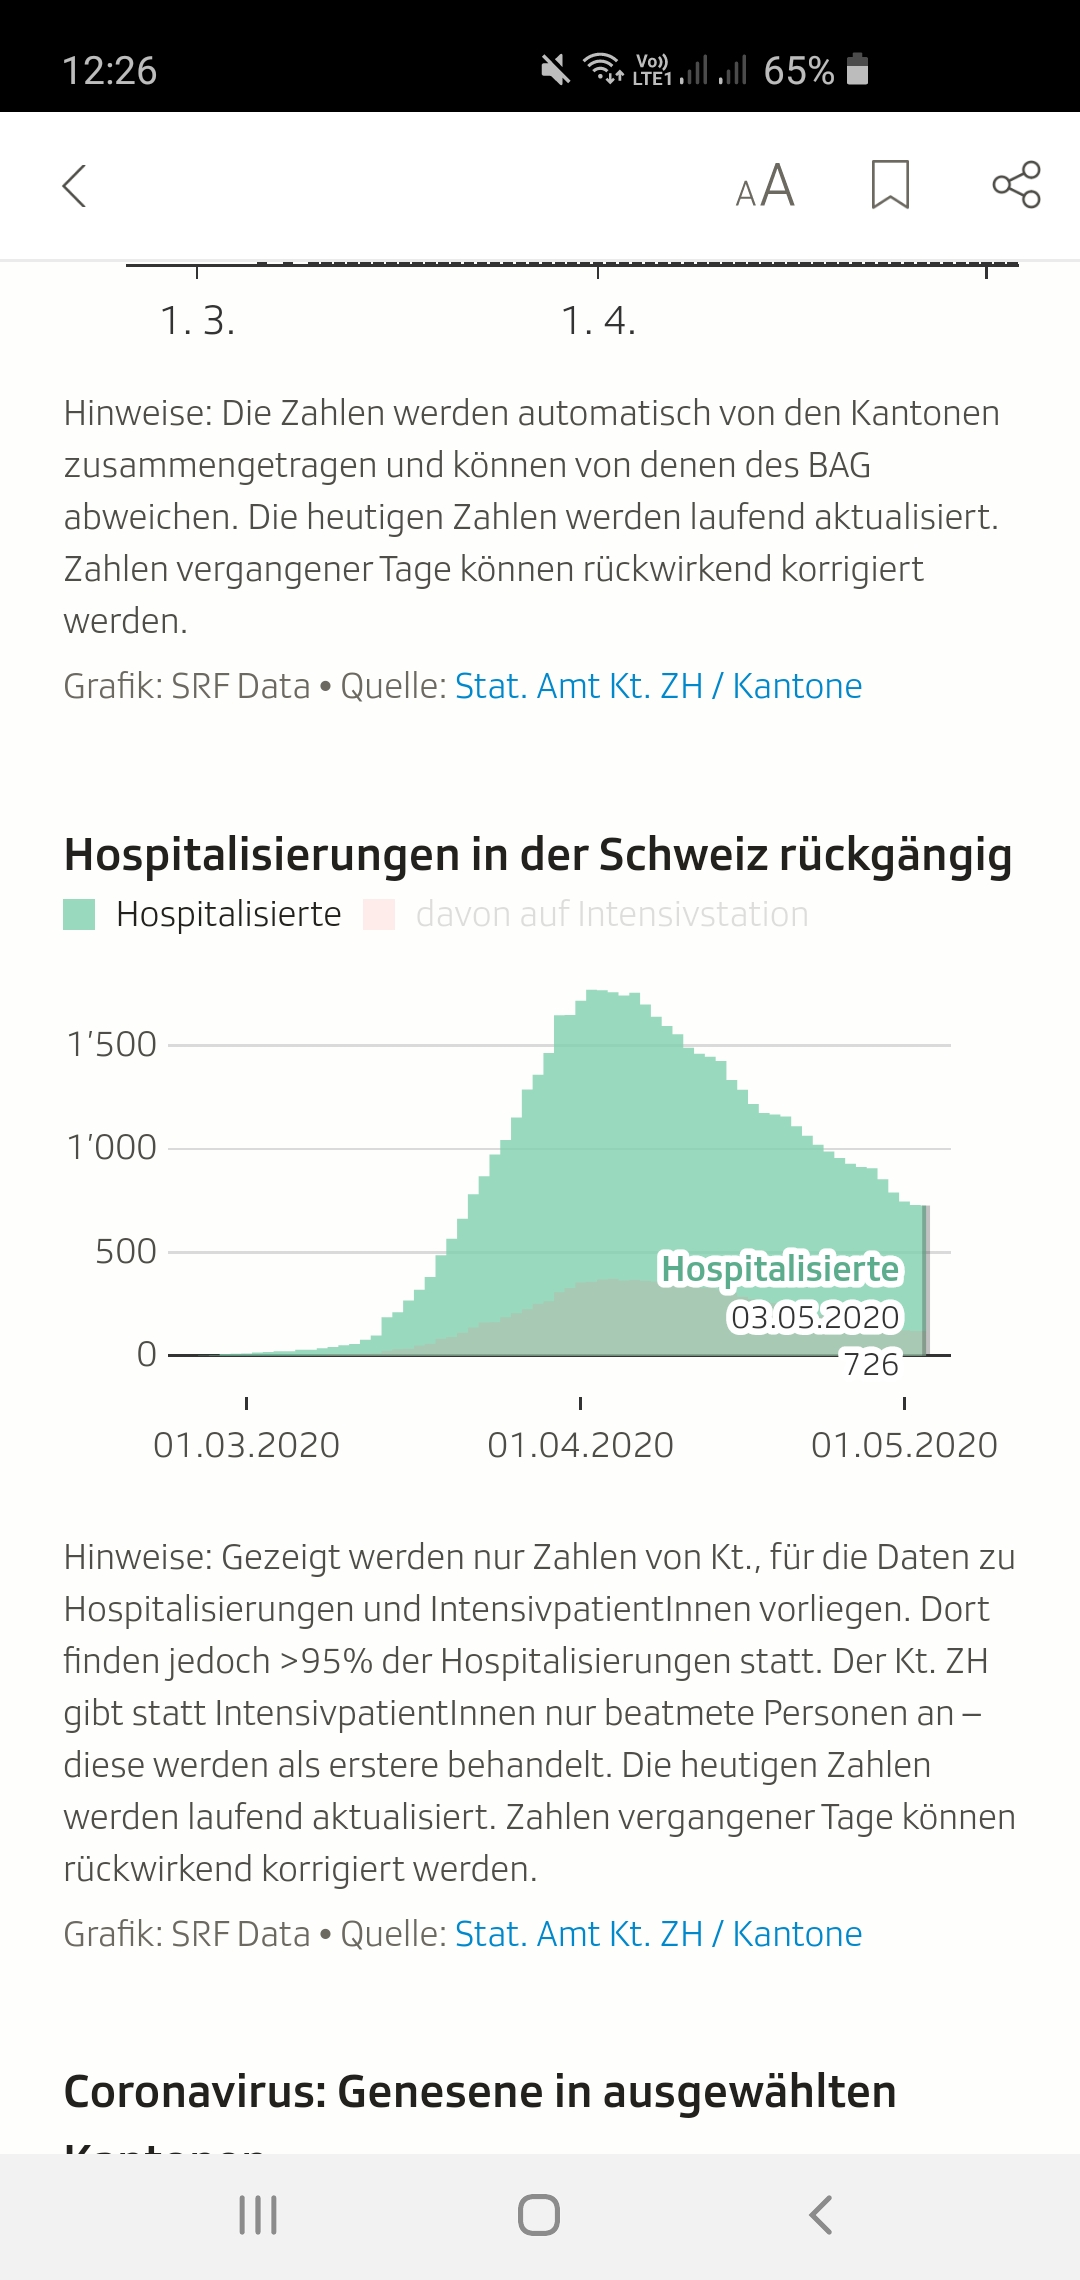
@simgraworldwide: as requested I let you know that I've noticed a drop in the hospitalization numbers, the same pattern as last time. I made a few screenshots, maybe they help to get insights into what is happening...
 Melandra
All 2 comments
Ok @Melandra , we found the problem. The script for the graph filters all cantons, that either publish only hospitalised but not ICUs (this will remain) and, furthermore, all cantons that have not published hospitalised data in the last three days. The entire time series data is filtered for these cantons to gain consistency.
Several cantons do publish data on hospitalisations for the weekend days only retrospectively on Monday. With 1st of May being a Friday, some passed this three day threshold, removing their data from the graph entirely.
The script will be adjusted, so that a canton has to not publish data on hospitalisations for more than three days until they are removed from the graph.
Thanks again for letting us know!
 simgraworldwide
on 5 May 2020
simgraworldwide
on 5 May 2020
As Simon says, we will adapt our script slightly so that the likelihood a canton is fully removed from the chart for some period of time is reduced. Thanks for bringing this to our attention. To sum it up: The drop in the chart is caused by our script, not due to an error or quality issue in this data source.
Timo (SRF Data)
 grssnbchr
on 5 May 2020
grssnbchr
on 5 May 2020
Related issues
 netzwerg
·
6Comments
netzwerg
·
6Comments
 zukunft
·
6Comments
zukunft
·
6Comments
 zdavatz
·
4Comments
zdavatz
·
4Comments
 rsalzer
·
3Comments
rsalzer
·
3Comments
 dominikgehl
·
6Comments
dominikgehl
·
6Comments