Covid-19-data: Large discrepancies to official state data
Living in MA I have been looking at multiple sources of data/projections, and there are large differences between the NYT numbers and the official MA report (found here: https://www.mass.gov/info-details/covid-19-response-reporting )
MA daily deaths from the 19th on according to MA report:
162 156 138 137 128
MA daily deaths for the same range according to NYT data:
146 103 152 221 178
This kind of renders any projections meaningless. On the NYT graphs MA is still massively rising in death count, whereas what's actually happening is that the numbers have steadily dropped for the last 5 days.
Is it possible that you sometimes get backdated data, which the MA report correctly attributes to the day they actually occurred, whereas you just attribute to the day you received the number?
 threebrooks
All 3 comments
What's happening is a difference in definition. We are reporting deaths reported by date of announcement of death. The state chart in the document you link to is a chart of deaths by date of death.
You'll see a note there: *Counts on the trend chart do not match total number of deaths reported, as there is a several day lag in reporting by date of death.
Because of that lag, and because they revise their daily numbers each day, the number of deaths for the the most recent days in the state chart are going to be lower than the increases in our data, while the number of deaths for dates in the past will be higher than in our data, because we do not backdate data and the state does.
 albertsun
on 26 Apr 2020
albertsun
on 26 Apr 2020
Thanks for the swift reply Albert, that definitely explains it. I assume the "back-dated" data isn't available for all states and counties, so the approach you are taking makes the data consistent across the US (at the expense of some loss of accuracy). I'm assuming this is also why you smooth the graph with a 7-day window in your graphics, to remove stuff like the post-weekend jump.
threebrooks
on 26 Apr 2020
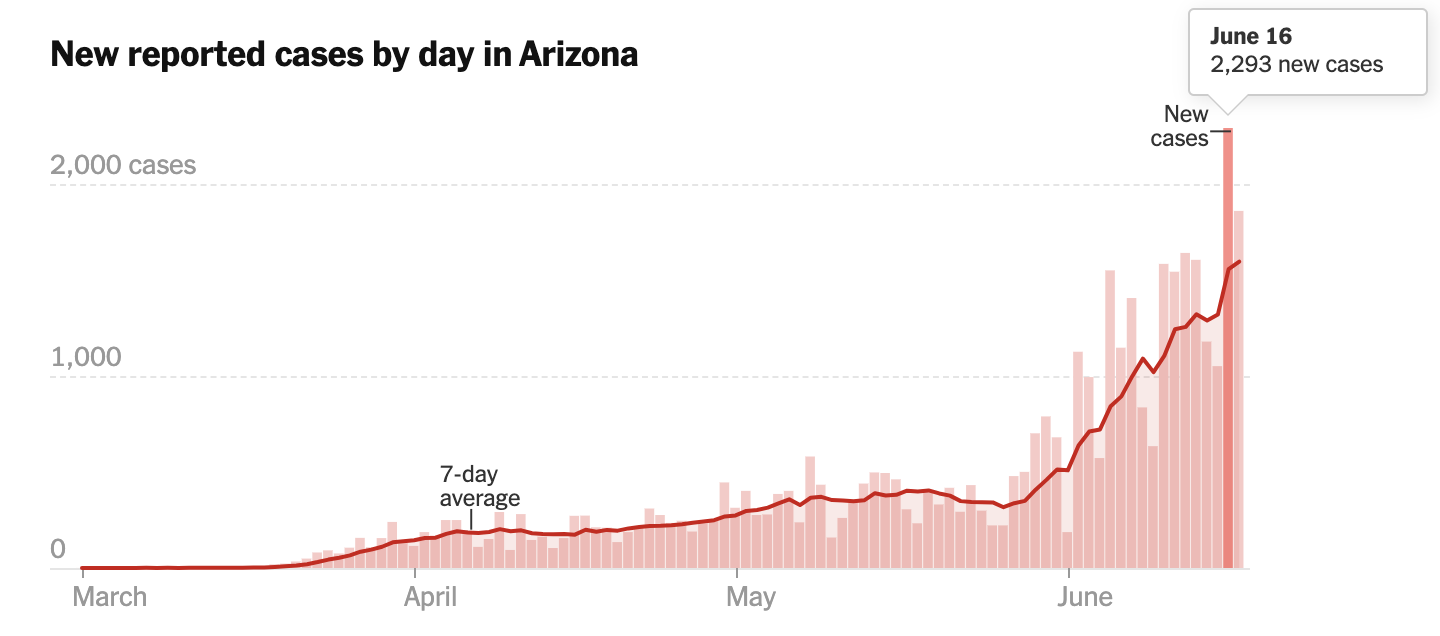
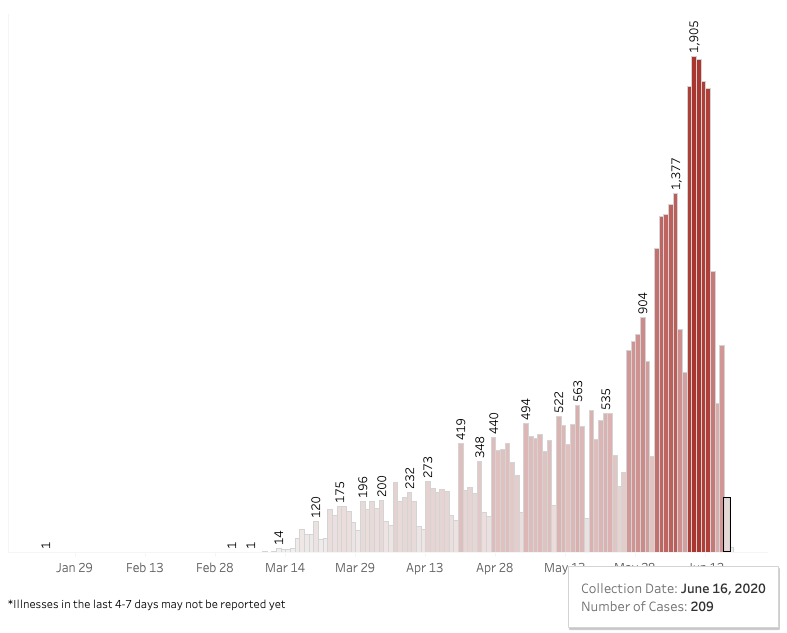
I'm noticing similar discrepancies between the state data and NYT data in Arizona. Is this also a result of the aforementioned contrast in backdating?
NYTimes:
AZDHS:
 forresthopkinsa
on 18 Jun 2020
forresthopkinsa
on 18 Jun 2020
Related issues
 lsylvain
·
3Comments
lsylvain
·
3Comments
 bsaunders23
·
4Comments
bsaunders23
·
4Comments
 bcunning
·
5Comments
bcunning
·
5Comments
bcunning
·
5Comments
bcunning
·
5Comments
 wescrockett
·
5Comments
wescrockett
·
5Comments
Most helpful comment
What's happening is a difference in definition. We are reporting deaths reported by date of announcement of death. The state chart in the document you link to is a chart of deaths by date of death.
You'll see a note there:
*Counts on the trend chart do not match total number of deaths reported, as there is a several day lag in reporting by date of death.Because of that lag, and because they revise their daily numbers each day, the number of deaths for the the most recent days in the state chart are going to be lower than the increases in our data, while the number of deaths for dates in the past will be higher than in our data, because we do not backdate data and the state does.