Covid-19-data: Example: Mobile-friendly interface for navigating the top COVID datasets
Describe the project
RonaViz is a fast, mobile-friendly interface for the Times' dataset. I wanted to build a quick way to check in on friends and family in other states and counties to see how things are doing there. I found it especially useful to supplement the Times' data with hospitalizations and testing data to get as clear picture as possible of where things are at. The design is built for quickly navigating different levels of hierarchy in the country. You can quickly tap on states, and zoom into specific counties. If you're interested in a more holistic perspective of the country, the table at the top works great for that too.
The data is always current and updates to use live data as soon as a significant chunk of it is reported. The supplemental data comes from the COVID Tracking Project and Google Community Mobility Reports.
Massive thank you to the Times for making this dataset available. It's a true national resource and makes me proud to be a subscriber.
The code that powers the site is available on github.
Have a URL or images of the project?
The site is available at ronaviz.com
Here are a few screenshots of the project:
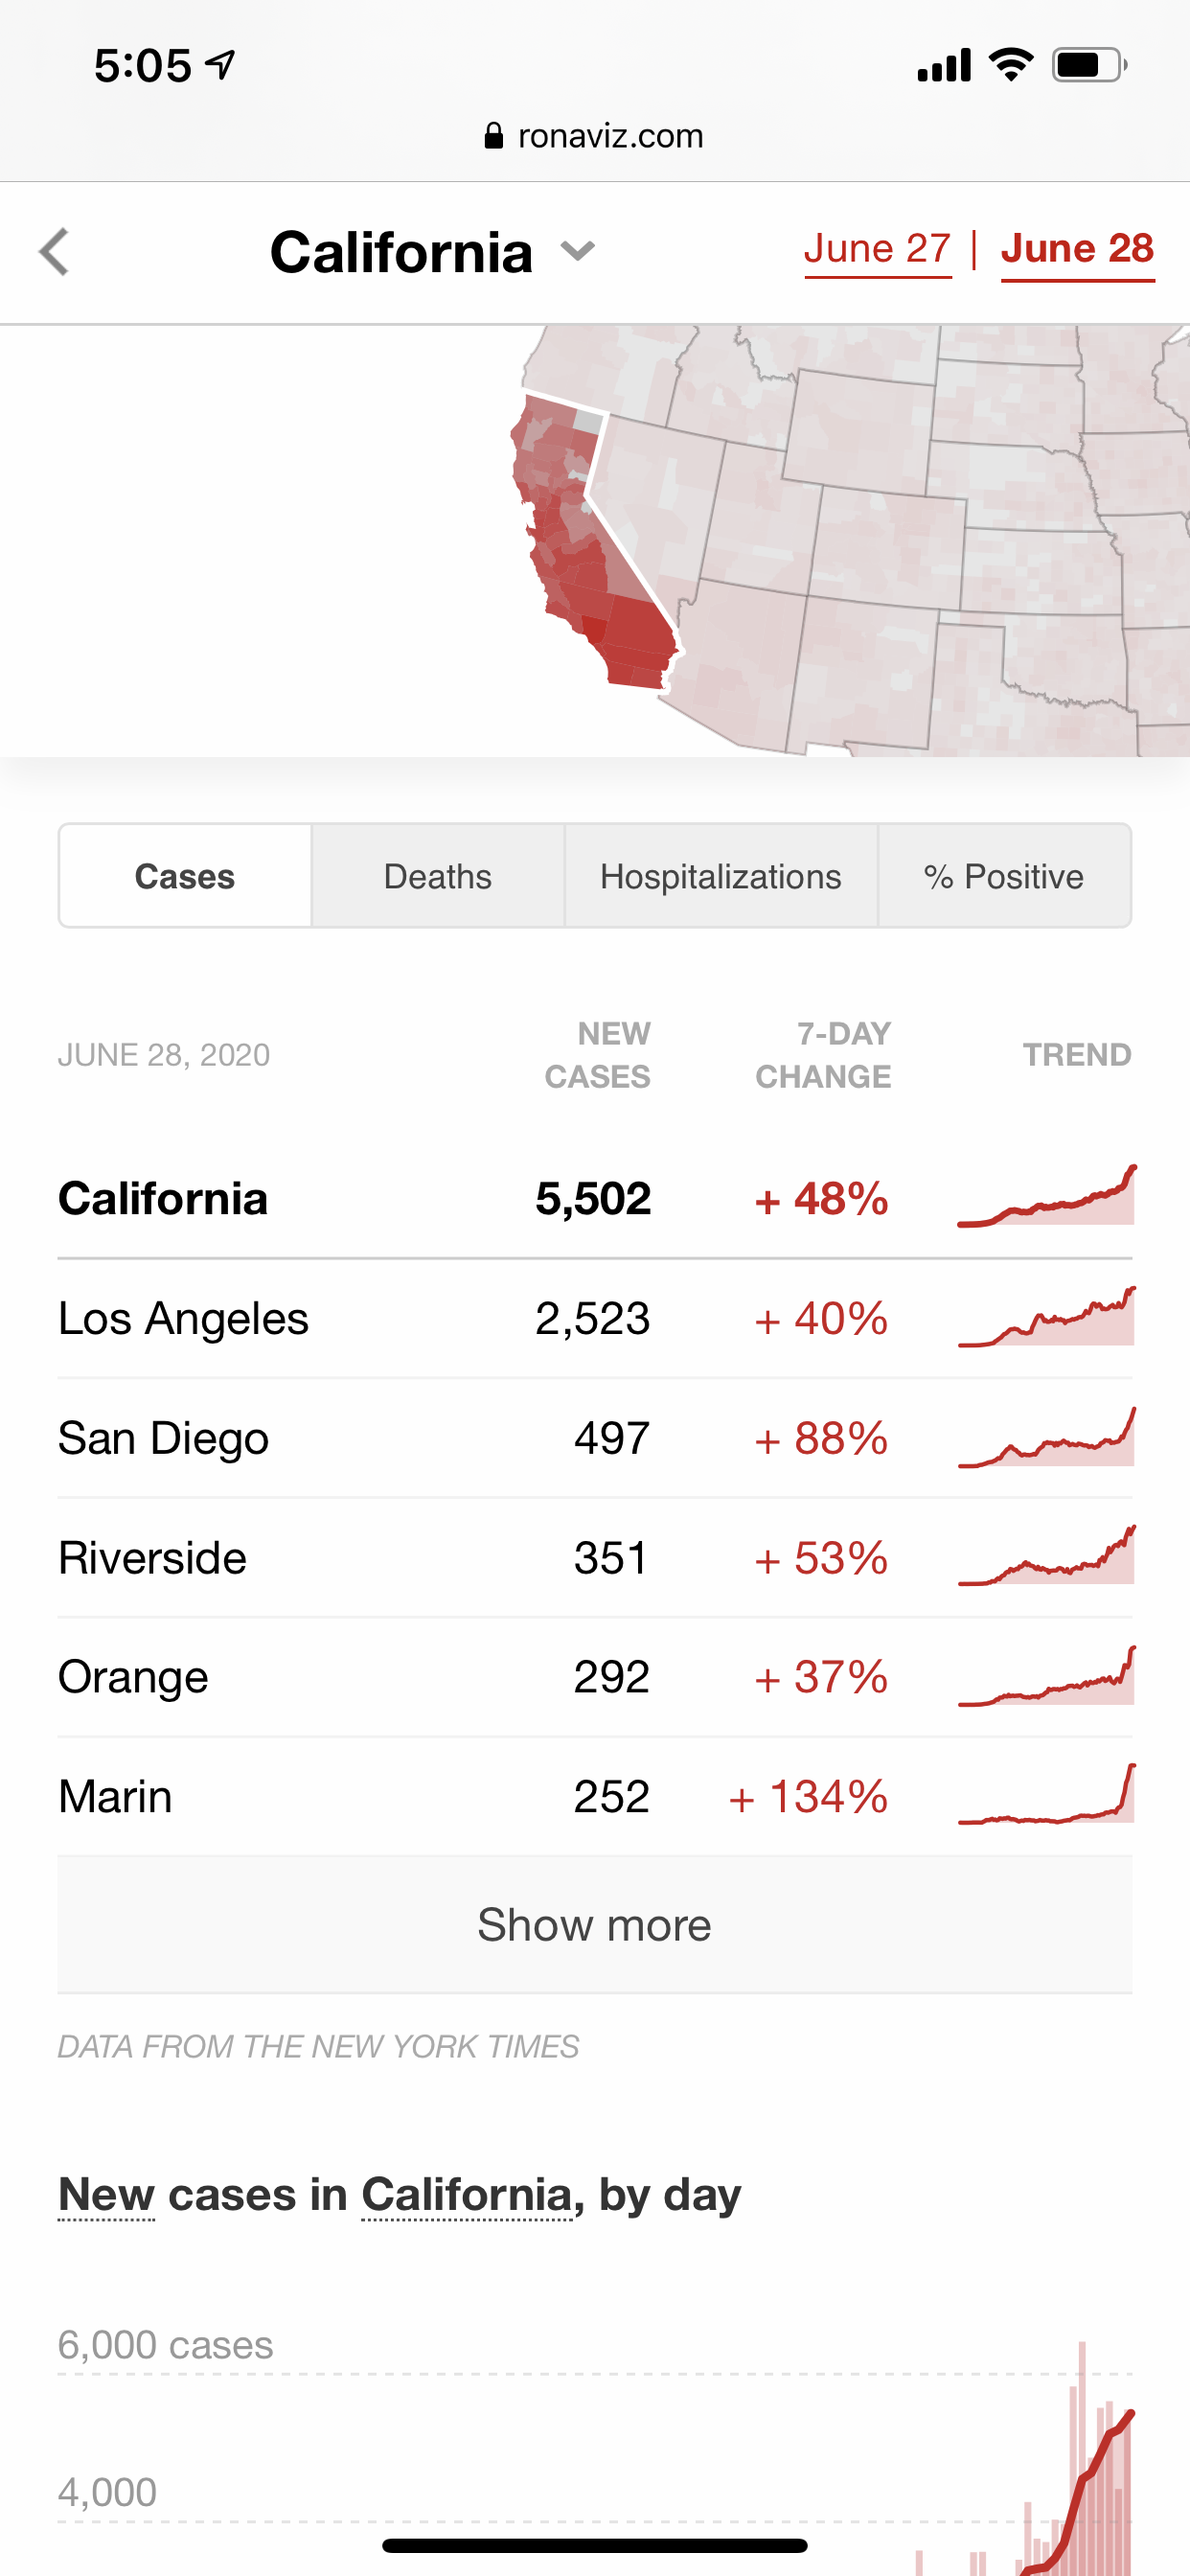
_Selecting a state to see which counties have seen the most new cases._
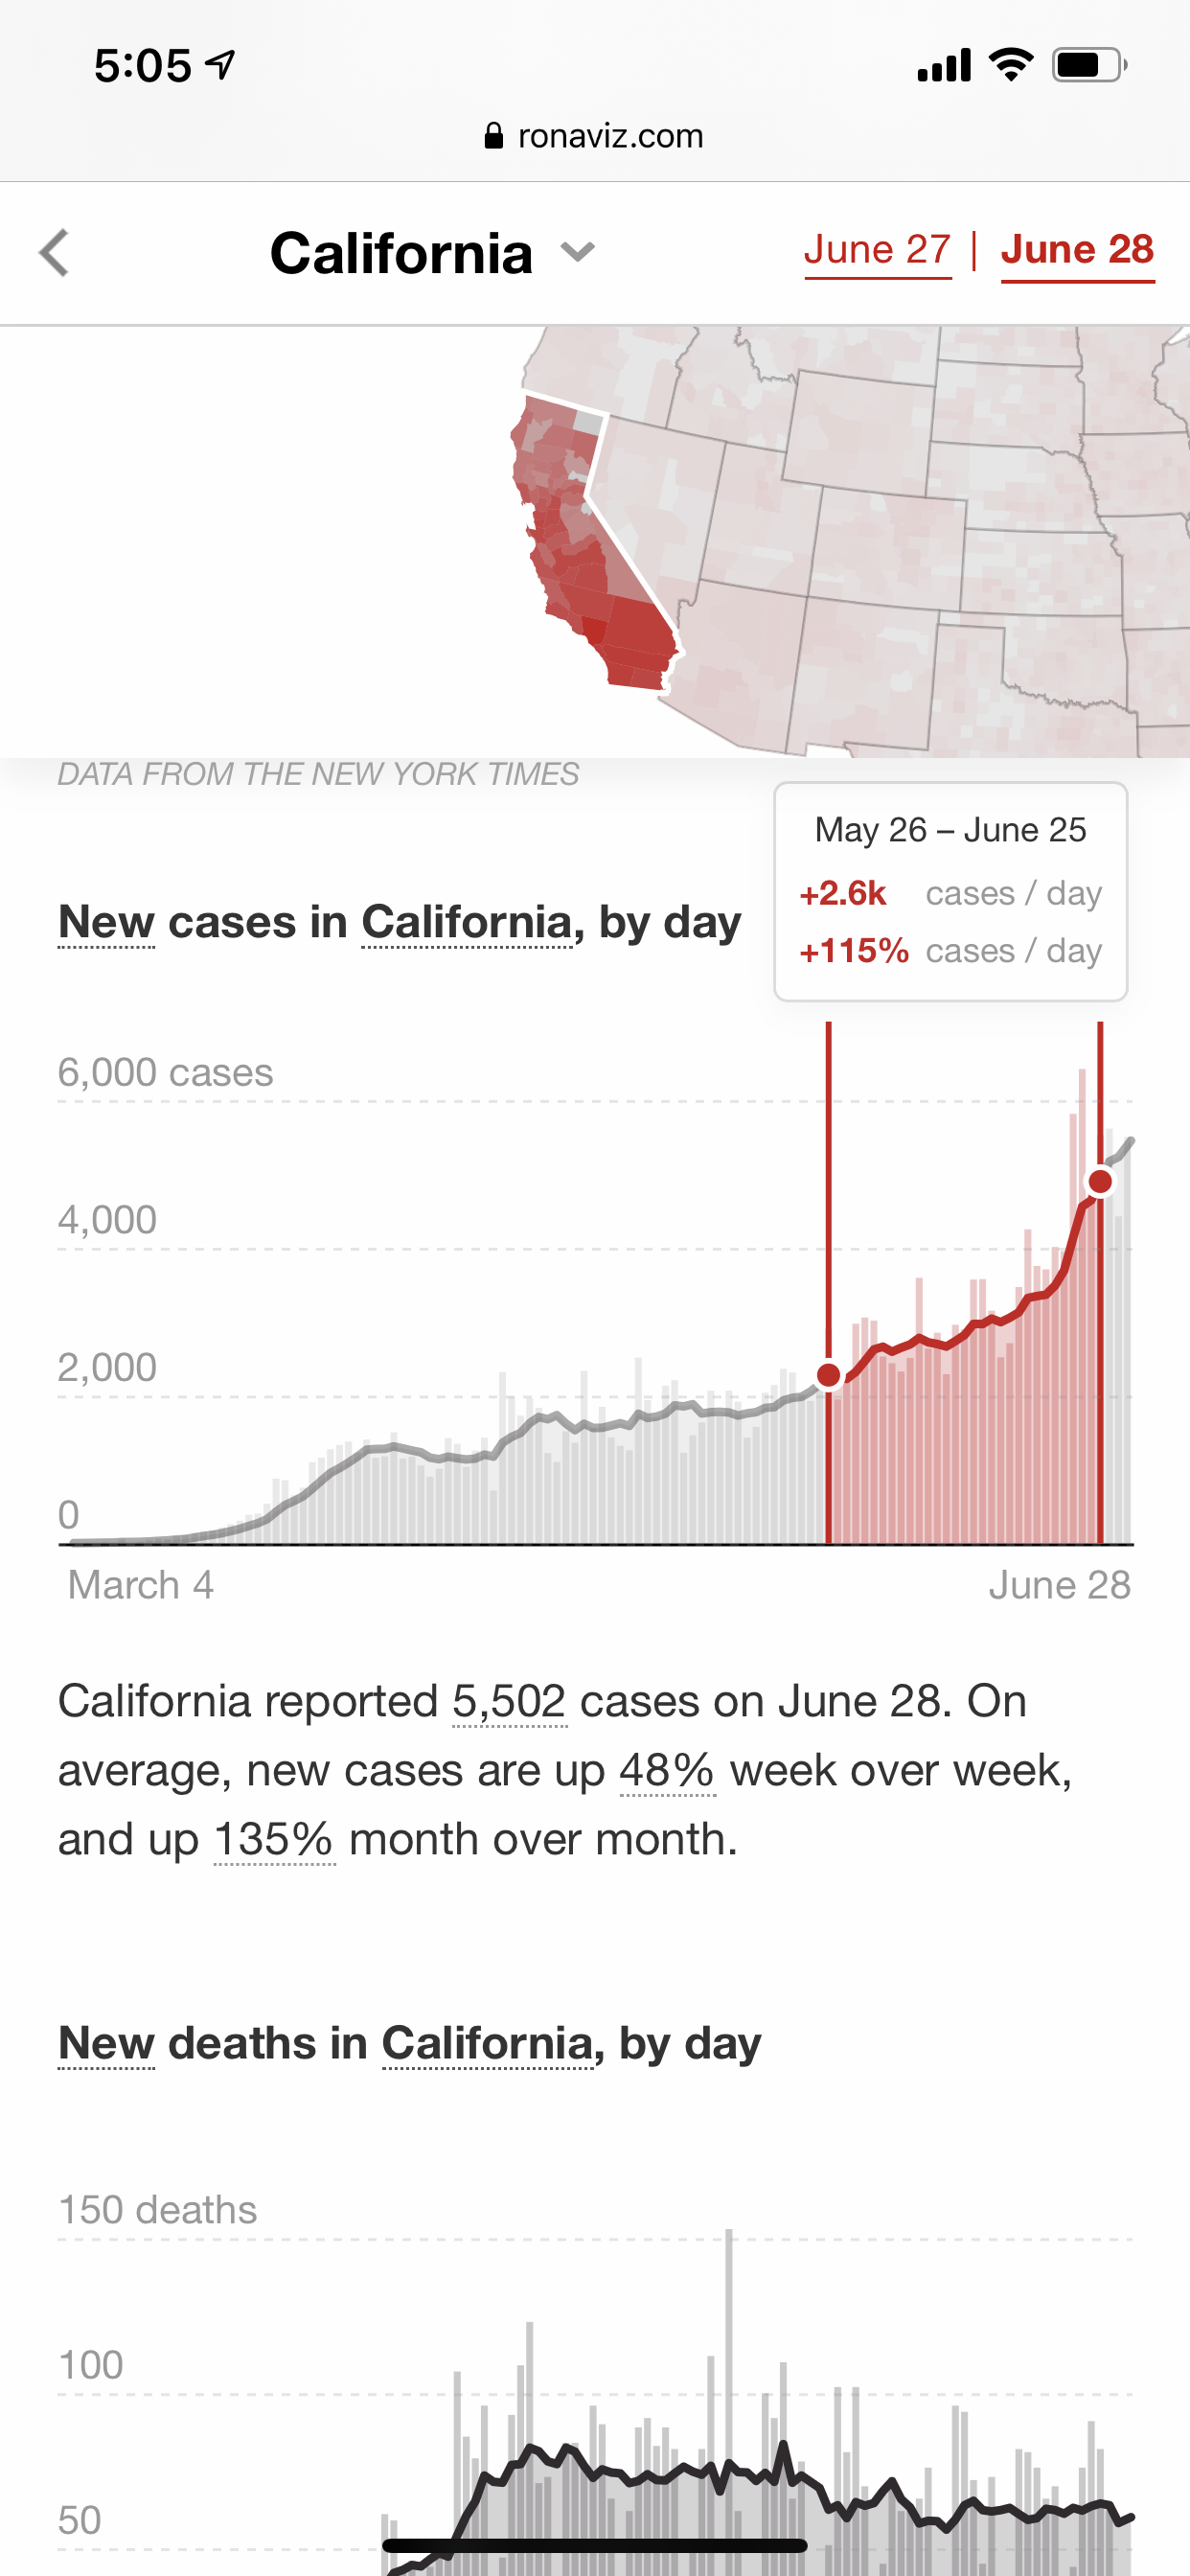
_Comparing case growth in a region over time._
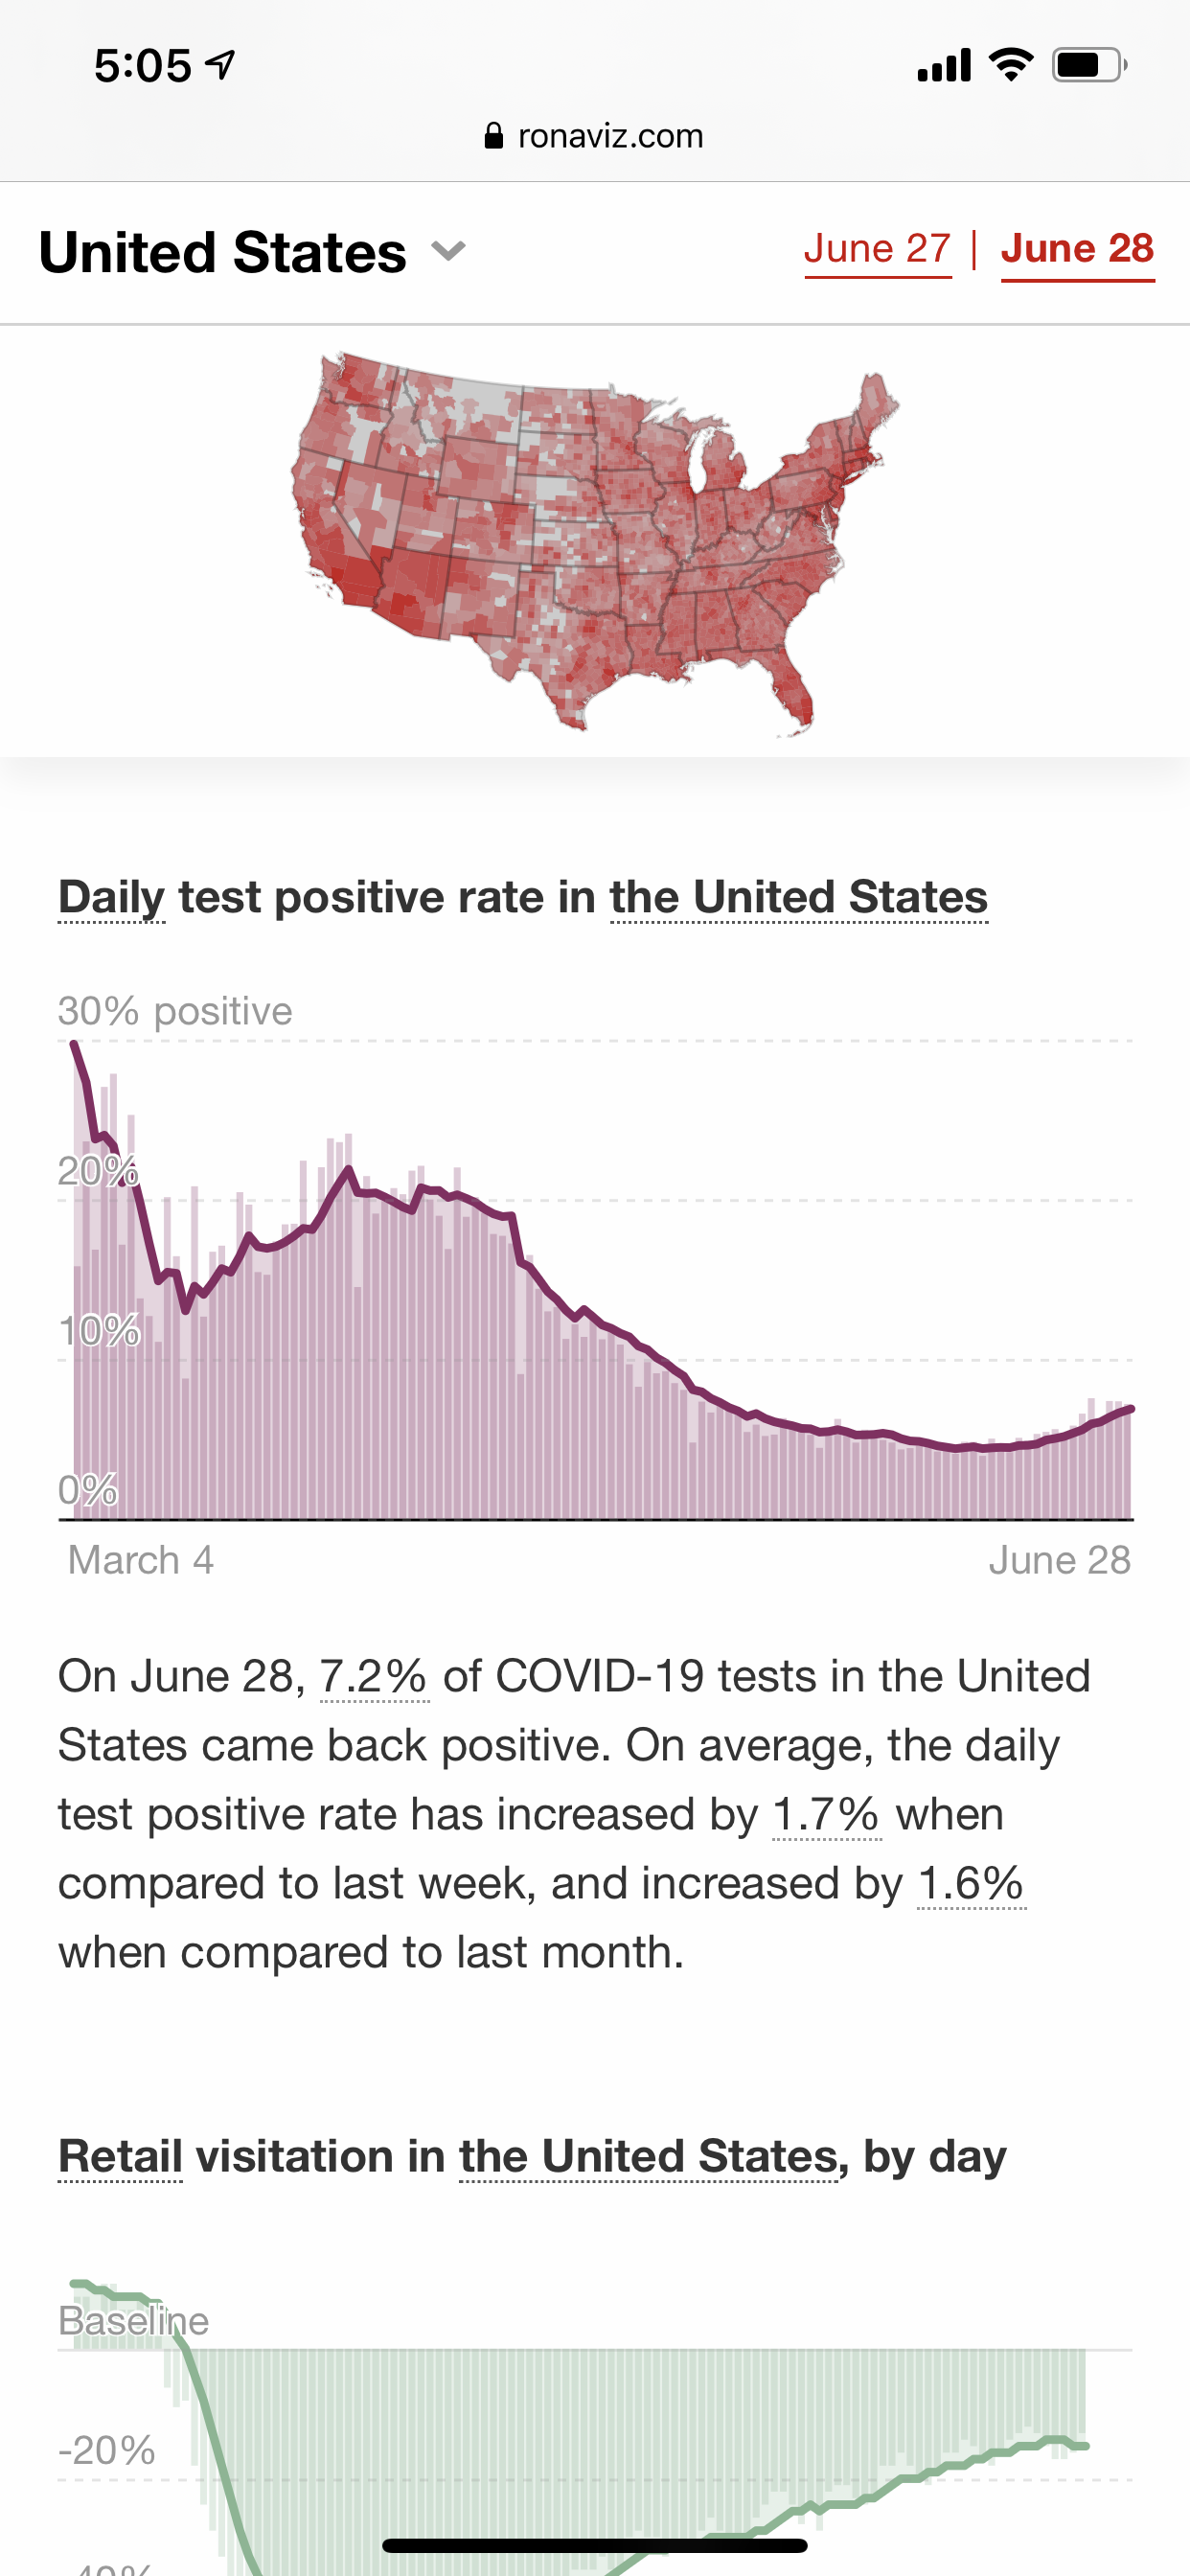
_Monitoring the national test positive rate_
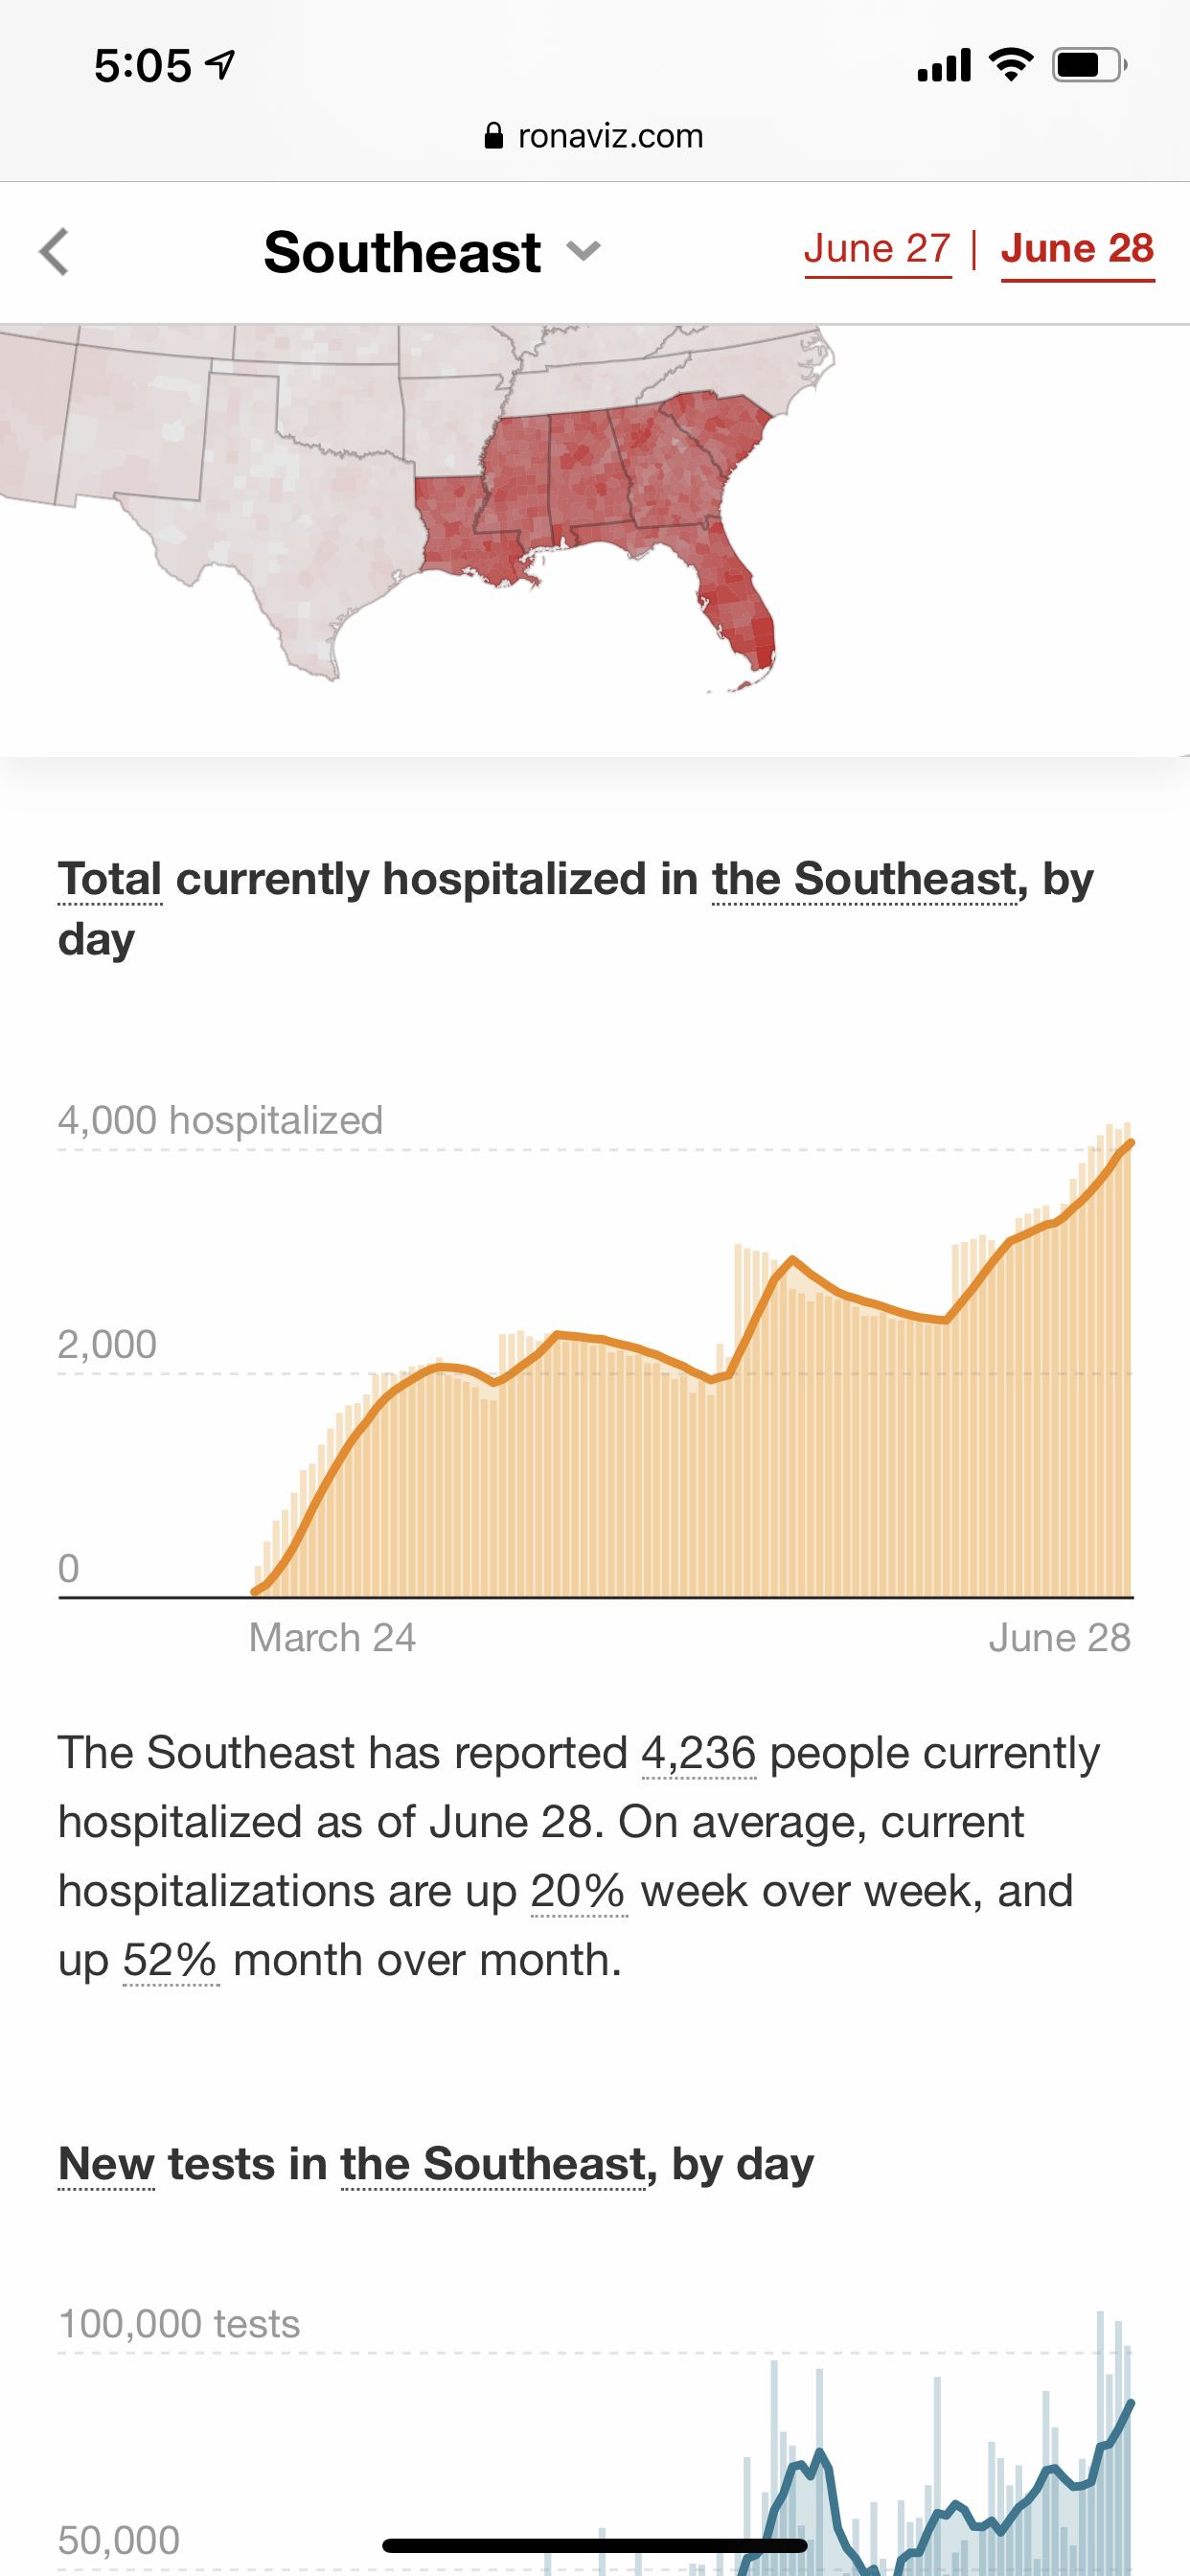
_Viewing current hospitalizations for a region of the country_
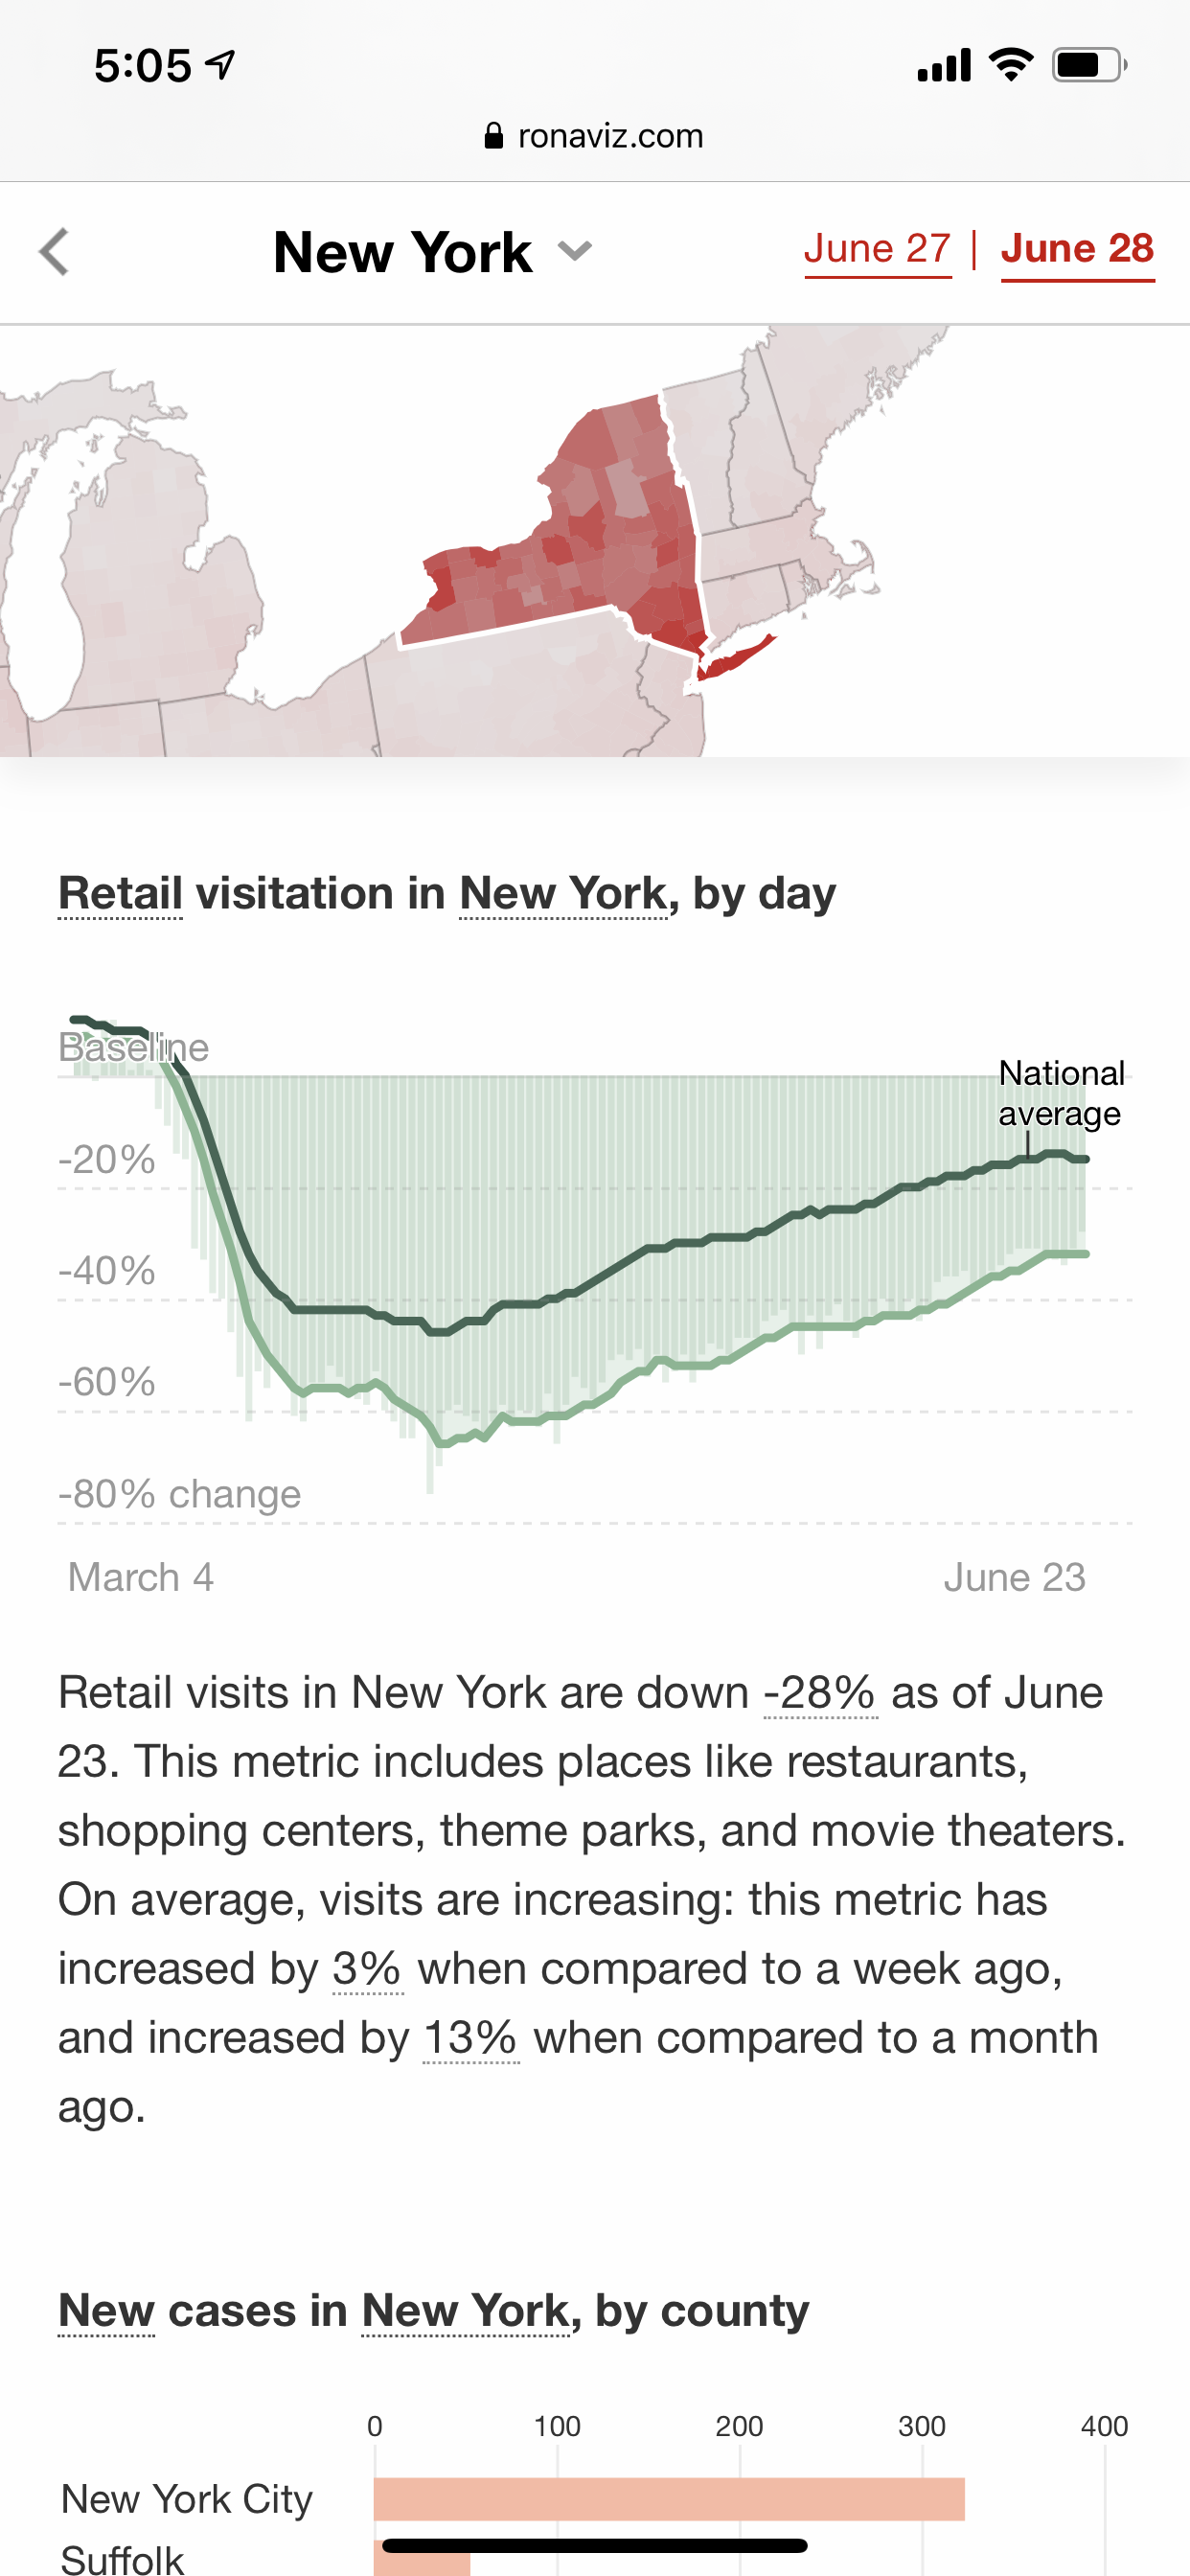
_Examining retail visitation behavior as it compares to the national average_
 bcunning
All 5 comments
That's so great it works well on mobile. That's such a needed thing and so hard to do. Thanks for doing that. I hope it gets a lot of traction because so many other sites don't work well or are confusing with lines everywhere.
 gmillikan
on 1 Jul 2020
gmillikan
on 1 Jul 2020
Thank you for sharing! This looks great. I added it to our Collections (a Project board) under Examples.
 tiffehr
on 2 Jul 2020
tiffehr
on 2 Jul 2020
This is fabulous! thanks for sharing. one of the best I've seen
 Nicole58
on 2 Jul 2020
Nicole58
on 2 Jul 2020
Thank you! I love interactive data viz. The Times (and Mike Bostock while he was there) are a big source of inspiration to me.
bcunning
on 2 Jul 2020
🙂
tiffehr
on 5 Jul 2020
Related issues
 Montana
·
3Comments
Montana
·
3Comments
 wescrockett
·
5Comments
wescrockett
·
5Comments
 murphystout
·
5Comments
murphystout
·
5Comments
 briancpark
·
3Comments
briancpark
·
3Comments
 cradaydg
·
4Comments
cradaydg
·
4Comments
Most helpful comment
This is fabulous! thanks for sharing. one of the best I've seen