Cookie-autodelete: [BUG] continuous high CPU - 30% to 32%
Describe the bug
Plugin active. Uses 30 to 32% of CPU at all times. Does not quiesce.
To Reproduce
1 - All other plugins disabled.
2 - Enable/Activate plugin. CPU quiet.
3 - Open any web page and CPU jumps to 30%.
4 - Close and reopen browser, CPU immediately to 30%, even if no webpage is open (i.e. I leave the Add-ons page open as the First Open option).
5 - Deactive plugin, leaving browser open, CPU stays at 30%......
6 - restart after 5, cpu back to zero.
(its as if a cryptominer is residual in memory).
I'll attempt to get some console output, but I dont know how to profile the browser itself yet.
Expected Behavior
Screenshots
Your System Info
- OS: Win 10.0.19041
- Browser Info: 82.0
- CookieAutoDelete Version: 3.5.1
Additional context
 AtomicRobotMan0101
All 16 comments
Checked on another machine - same config (OS, browser)... same problem, but at 14%.
This is a quad core machine. The original report was from a dual core.
AtomicRobotMan0101
on 22 Oct 2020
A profiler would help as I am unsure just where we are still holding resources as things.
All executions should be on listeners, ranging from tab close, tab updates, to cookie changes.
Firefox has an internal profiler that I do not know how to properly use at this time. https://profiler.firefox.com/
Currently I'm using Kubuntu/Linux and Firefox seem stable and using <5% CPU (well the Memory area is using 500MB, but contributing to that is over 50+ tabs as well).
 kennethtran93
on 24 Oct 2020
kennethtran93
on 24 Oct 2020
Learning the profiler now.
Seems it is a call that is looping. Trying to work out which.
I turned off all the Addons options to DEFAULT and the CPU quiesced..... now to go through and work out which is misbehaving :)
AtomicRobotMan0101
on 24 Oct 2020
OK. Replicated. Will document and post.
AtomicRobotMan0101
on 24 Oct 2020
OK. Replicated. Will document and post.
If you want to post it privately to me, I can give you a Dropbox link instead. Let me know.
kennethtran93
on 25 Oct 2020
Apologies for delay.
Managed to replicate, but not find cause via debugger/profiler. I do not have enough experience there to be useful.
Devices - Windows 10 (fully updated), FF (fully updated), quite a few alternative plugins (again, updated).
-- Using HIGH performance option under power.
-- FF with CAD enabled uses ~17% continuously on quad core.
-- CPU use regardless of other plugins (all disabled, enabled, switched around, etc). All no effect.
Change Win10 power to "Power Saver" (i.e. low)
-- Disable and Restart FF, CPU drops to negligible
Enable Balanced power ("Recommended") CPU remains low.
-- Enable CAD without restart, CPU use pops back to ~17%
It is quite replicable. BUT it has an odd intersection/reaction to power options set in Win10. There must be a FF bug(?) that causes CAD to trigger some sort of loop/iteration(?) that it can't release from/tidy up.
TBH, I wouldn't normally be too bothered by it, other than the cooler fan is noisy when it heats up.
AtomicRobotMan0101
on 4 Nov 2020
OK, another point to report.
-- Enable Automatic Cleaning creates the problem
-- Disable this, regardless of power settings, problem removed
-- Time set (5 sec --> 10 mins) has no effect of quiescence
BUT, if the Win10 power mode is set to Power Saver (low) the problem does not offer even with the EAC set to ON....
Have confirmed on my gaming PC (decent rig) and an ASUS lappie. Both run Win10 and FF, all latest... but each runs different services/software.
Hopes this adds a little clarity.
AtomicRobotMan0101
on 5 Nov 2020
OK, another point to report.
-- Enable Automatic Cleaning creates the problem
-- Disable this, regardless of power settings, problem removed
How was it enabled/disabled - through the popup, CAD Settings Page, or right-click?
-- Time set (5 sec --> 10 mins) has no effect of quiescence
BUT, if the Win10 power mode is set to Power Saver (low) the problem does not offer even with the EAC set to ON....
Have confirmed on my gaming PC (decent rig) and an ASUS lappie. Both run Win10 and FF, all latest... but each runs different services/software.
Hopes this adds a little clarity.
Hmmm...Majority of the background items still runs even if automatic cleaning is disabled.
- Cookie Count Updates for icon and mouseover Text - normally triggers on cookie update listener
- Icon update - color depending on lists.
- Tab Updates/closed still triggers, though if triggered will check if active mode is enabled.
- This also manages the main domain for each tab, and triggers the icon color and cookie count update if domain changes.
If the profiler could dive deeper into which file/function is causing the most resources being used that would be most helpful.
kennethtran93
on 6 Nov 2020
Answering Q above....
1 - EAC is enabled via (both) the Click-Toolbar-icon (then the green Enable option at top) and via the FF > AddOns > CAD > Options > CAD Settings > topmost checkbox.
-- Both methods create the same high CPU usage.
-- If off and broweser restarted, CPU event does not occur.
2 - For power settings on Windows? These methods, all are the same result
-- Via a desktop shortcut (target: C:\Windows\System32\powercfg.cpl)
-- Via START, type power
I'll do what I can with the profiler. That will be novel for me, so I'll do/dump/grab what I can and see as useful/reasonable.
Cheers!
AtomicRobotMan0101
on 6 Nov 2020
There was an old issue regarding high cpu usage when I tried to implement cookie count/update through the popup the first time - Think that issue had a reference to a profiler result that helped me figure out what went wrong. Maybe see if that contained any setup options used and go from there?
kennethtran93
on 6 Nov 2020
Will look up this pointer.
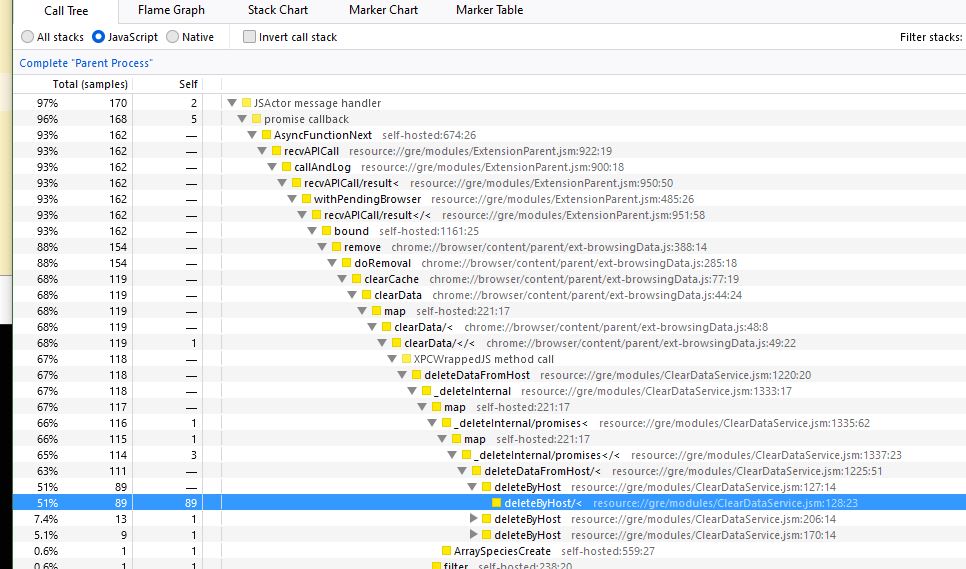
From my diggings so far, it looks like the offender might be that call to deleteByHost.... https://searchfox.org/mozilla-central/search?q=deleteByHost&path=
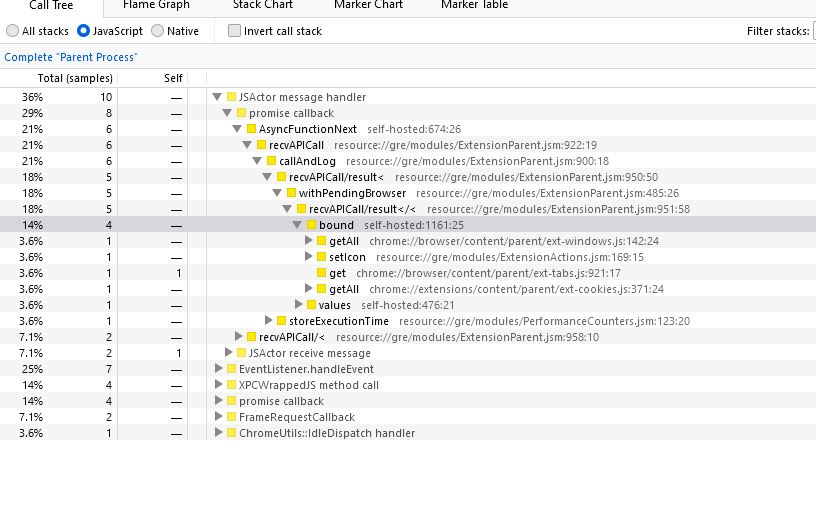
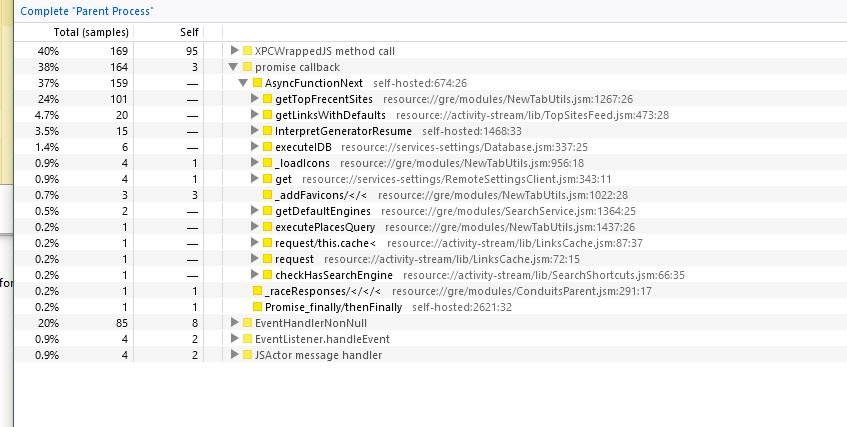
Screen grabs attached. This was for a completely blank page, with various selections.
1 - blank page, full power, auto delete on
2 - EAC off, restarted, full power (ultra-low cpu result)
3 - EAC on, mid power turned on (went from quiet to 18% without touching the browser).
I assume there may be a means of dumping stuff into a file, but this is terribly new. As for the above, pardon me if Ive errored, I'm not a JS dude.
AtomicRobotMan0101
on 6 Nov 2020
OK, here is a dump: https://share.firefox.dev/3p1y9QO
I redid everything, clean and tidy, and used the call-tree right from system. I am not a developer (so I am, therefore 100% likely to be an idiot)... but following the trail it led to the same place.... that deleteByHost is the offender.
AtomicRobotMan0101
on 6 Nov 2020
I'm not fully sure if it is a Firefox thing or CAD. From what you have given me it looks like the firefox internal call for cache cleanup is causing the spike in CPU. If you try disabling that cleanup option in CAD, do you still get the CPU issue?
Apologies for the late response.
kennethtran93
on 3 Dec 2020
Yes, disabling auto stops the CPU problem - Ive been doing this since reporting the bug.
Turning it on for a short time every now and then blows those bastard cookies away... then its turned off :)
AtomicRobotMan0101
on 3 Dec 2020
 gwarser
on 3 Dec 2020
gwarser
on 3 Dec 2020
@gwarser you're probably on the right track there.
I sense trying to remove cache is actually checking disk and memory files and for specific hostnames to delete, and when you have a large cache/visit numerous sites since an empty cache, it may take some time and resources to filter through and remove them.
I think ultimately this falls on the Firefox side of things as according to the profile you've given me, the 'webextension' portion doesn't take that long to execute or resources. Just the Firefox/internal code takes time.

By the way, every time you enable 'clean cache' through the global settings, it should trigger a 'clean all existing cache' (i.e. since: 0). I believe this should still happen regardless of the current auto clean setting.
kennethtran93
on 3 Dec 2020
Related issues
 frankclaassens
·
4Comments
frankclaassens
·
4Comments
 mooms06
·
7Comments
mooms06
·
7Comments
 xenopeek
·
4Comments
xenopeek
·
4Comments
 imtbl
·
4Comments
gwarser
·
3Comments
imtbl
·
4Comments
gwarser
·
3Comments