I am a little confused about the graph of memory usage, I am not sure which level of the memory it represents, and there is a big difference between Cockpit and Fedora monitor, the memory usage presented by Cockpit is greater than 10GB most of the time.

@andreasn @stefwalter @mvollmer @puiterwijk
 porscheyin
All 9 comments
Same problem here. My box has 16GB RAM but cockpit shows that it's using 28.2GB


 vvetu
on 30 Dec 2014
vvetu
on 30 Dec 2014
Fixed by 5ea06f9ab4244ae5cf1cc5350312e7b88bfaa239
 stefwalter
on 8 Feb 2015
stefwalter
on 8 Feb 2015
I still have the same issue with fedora 24 server
 Ben1980
on 19 Jul 2016
Ben1980
on 19 Jul 2016
I still have the same issue with fedora 24 server
Which version of Cockpit? Choose 'about' in the menu in the upper right corner.
stefwalter
on 19 Jul 2016
Version 0.112.
The one which is shiped with Fedora 24.
I did all updates, so maybee there is only an update of the repository necessary.


Ben1980
on 19 Jul 2016
Is there some new information? Cockpit is accumulating used and cache together:


Ben1980
on 25 Jul 2016
Version 141 from EPEL (el7) shows double the max memory in the memory details (not in the graph from main screen, this one is ok). My server has 16GB, but the graph goes up to 32GB.
 brlarini
on 14 Jul 2017
brlarini
on 14 Jul 2017
I'm seeing the same thing as @Ben1980 on v151 from EPEL (running CentOS 7.4).
free -tm output:
              total        used        free      shared  buff/cache   available
Mem:           1839         146         689          16        1003        1468
Swap:             0           0           0
Total:         1839         146         689
System graph:

Detailed graph:
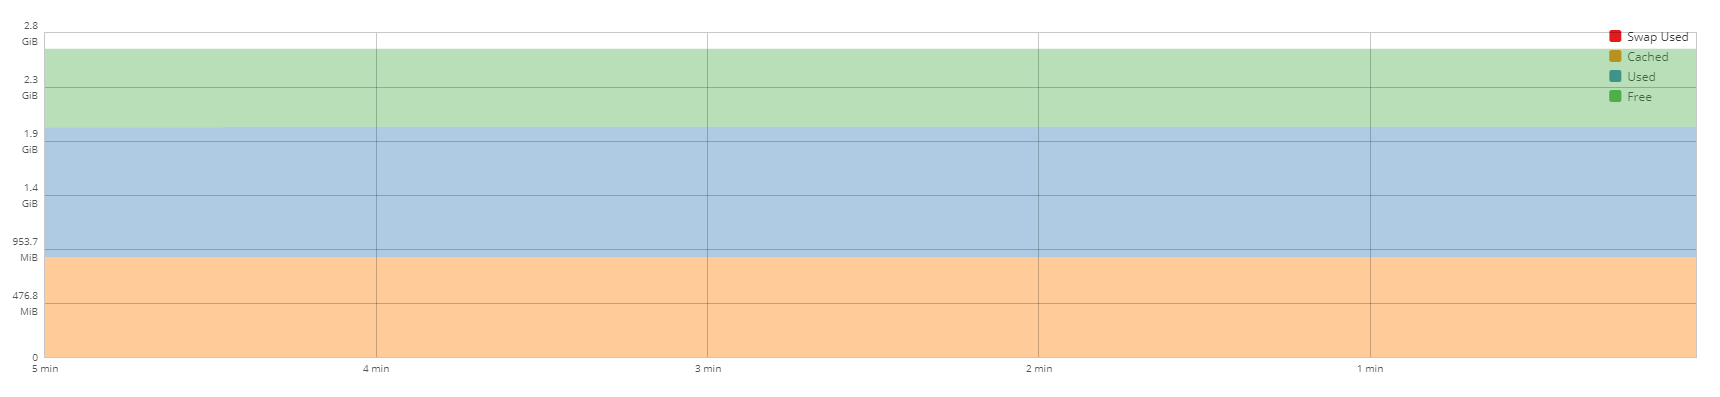
The graphs seem a little misleading since they're lumping multiple variables together and presenting it as "used".
 lodicolo
on 27 Jan 2018
lodicolo
on 27 Jan 2018
Same here.
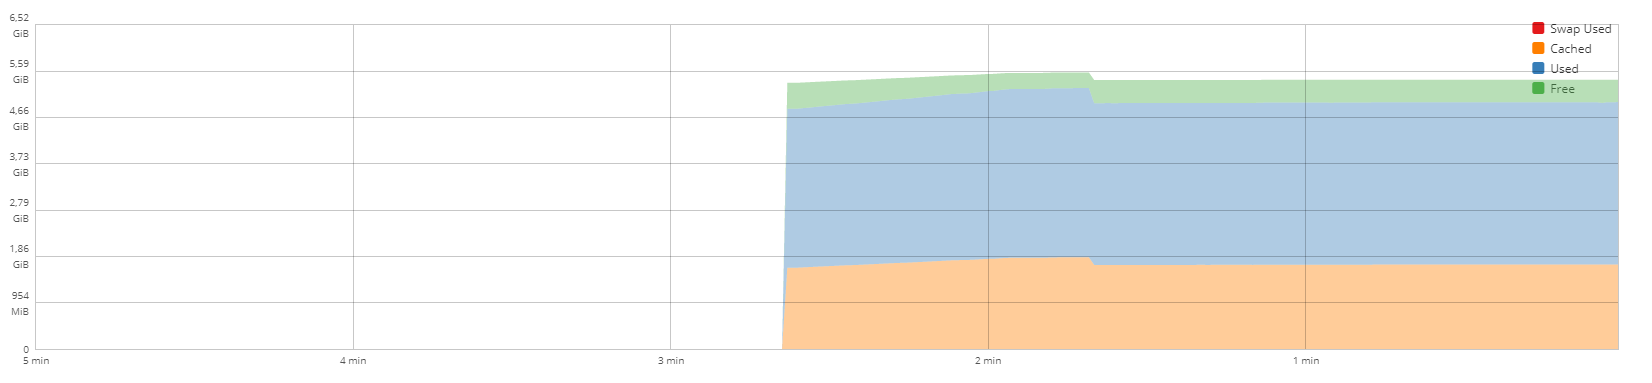
Have 3,8 GB memory and it's says 6.52. Also the usage is under 2 GB and it's says 4 gb used.
 Gaboros
on 19 Feb 2019
Gaboros
on 19 Feb 2019
Related issues
 FireDrunk
·
6Comments
FireDrunk
·
6Comments
 jacksnodgrass
·
6Comments
jacksnodgrass
·
6Comments
 kai4785
·
4Comments
kai4785
·
4Comments
 daniel-wtd
·
8Comments
daniel-wtd
·
8Comments
 bachradsusi
·
4Comments
bachradsusi
·
4Comments
Most helpful comment
I'm seeing the same thing as @Ben1980 on v151 from EPEL (running CentOS 7.4).
free -tmoutput:System graph:

Detailed graph:

The graphs seem a little misleading since they're lumping multiple variables together and presenting it as "used".