Page: System
would be nice to see CPU temp and Fan Speeds graphs from lm_sensor data on the system page.
 jacksnodgrass
All 6 comments
temperatures are also mentioned in issue 5454
and I think the method mentioned there has more merit, currently cockpit does not depend on lm-sensors, and this information is all exposed through the /sys/ interface. if anything I think the preferred option would be PCP if present, thermald if present, then the sys interface? that way it should work on the most basic of installs as well as others without dragging in more dependencies?
 JamesGKent
on 18 Mar 2019
JamesGKent
on 18 Mar 2019
I have a rough prototype using lm-sensors here
however when i can work out how best to access the data i would like to rework this to make use of the graphs other stats use.
Unfortunately the machine I have available does not give me access to fan speeds through lm-sensors so I cannot write code to handle that.
JamesGKent
on 18 Mar 2019
@JamesGKent I think i can help with the code for reading the fan speed through lm_sensors.
@martinpitt The issue seems a bit sleeping at the moment. What are the plans for the current issue? I think I have some time to spare at the moment. Is the plan to still support cpu temperature with the details described in #5454 ?
 waikontse
on 28 Oct 2019
waikontse
on 28 Oct 2019
There are no plans from our team's side to do this. If this information is accessible through /sys, pcp, or some D-Bus interface, then if someone wants to extend our hardware information page with that, this would be great. Otherwise, if lm_sensors just has a shared library API, then it's not going to happen in cockpit itself, and this should be a standalone project then.
 martinpitt
on 30 Oct 2019
martinpitt
on 30 Oct 2019
I could not find any dbus api for lm-sensors. (only libsensors api) Perhaps it could just be read from the hwmon sys interface via a sampler: https://www.kernel.org/doc/Documentation/hwmon/sysfs-interface -> https://github.com/cockpit-project/cockpit/issues/5454#issuecomment-262914509
Another more generic approach could be to use the openbmc dbus "scheme" for reading data from a bmc. And then extend existing bmc data on dbus with data from hwmon. ( https://github.com/openbmc/phosphor-hwmon ). Afterwards cockpit can read (and even send) data from (to) the dbus and provide a fitting UI. (some UI inspiration: https://github.com/openbmc/phosphor-webui ) _(removed caus of security issues: bmc should not be accessible from the host system)_
But this would be perhaps a standalone project and could even somehow achieved by using either the existing bmc ui or implement the bmc rest api.
another idea would be to use collectd via dbus or using just a piece of openbmc to get the hwmon data to dbus: https://github.com/openbmc/phosphor-hwmon to dbus. Also sensord would be somehow an option.
any thoughts?
 maltegrosse
on 18 Dec 2019
maltegrosse
on 18 Dec 2019
We introduced new separate page for seeing current and historical performance stats. That would be a good place for this.
See design on https://garrett.github.io/cockpit-mockweb/metrics/current/
https://www.mjmwired.net/kernel/Documentation/thermal/sysfs-api.txt
e.g.
cat /sys/devices/virtual/thermal/thermal_zone0/temp
61000
means 61 degrees Celsius.
If we're only going to list CPU temp, we could integrate it in the card like this, perhaps:
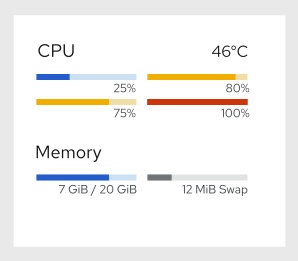
It might be weird at that height though. Perhaps it's better under the load. And perhaps it should say temperature.
(Sorry, working from an old mockup that doesn't reflect the current state of things... I just wanted to quickly throw something on this issue.)
Copied from https://github.com/martinpitt/performance-graphs/issues/25
 marusak
on 26 Oct 2020
marusak
on 26 Oct 2020
Related issues
 digitalformula
·
3Comments
digitalformula
·
3Comments
 FireDrunk
·
6Comments
FireDrunk
·
6Comments
 bachradsusi
·
4Comments
bachradsusi
·
4Comments
 q2dg
·
6Comments
q2dg
·
6Comments
 cedroid09
·
5Comments
cedroid09
·
5Comments
Most helpful comment
We introduced new separate page for seeing current and historical performance stats. That would be a good place for this.
See design on https://garrett.github.io/cockpit-mockweb/metrics/current/
https://www.mjmwired.net/kernel/Documentation/thermal/sysfs-api.txt
e.g.
means 61 degrees Celsius.
If we're only going to list CPU temp, we could integrate it in the card like this, perhaps:
It might be weird at that height though. Perhaps it's better under the load. And perhaps it should say temperature.
(Sorry, working from an old mockup that doesn't reflect the current state of things... I just wanted to quickly throw something on this issue.)
Copied from https://github.com/martinpitt/performance-graphs/issues/25