Cht-core: Memory leak when switching between tabs
This is a script which switches between the messages and contacts tab every 5 seconds.
setInterval(() => $('#messages-tab').click(), 5000);
setTimeout(() => setInterval(() => $('#contacts-tab').click(), 5000), 2000);
I did the following:
- Load WebApp
- Navigate to all tabs to ensure view warming.
- Trigger GC
- Measure Heap size and DOM Node Count.
- Start the script
- Wait some duration
- Trigger GC
- Measure Heap size and DOM Node Count.
Results after waiting 10 minutes:
Metric | Before | After
-- | -- | --
Heap | 163MB | 195 MB
DOM Nodes | 17,000 | 410,000
A second run for 5 minute without live-list drawing in contacts tab:
Metric | Before | After
-- | -- | --
Heap | 126MB | 327MB
DOM Nodes | 17,000 | 200,000
Measures imply some sort of resource leak. This was on Chrome 70, so could be bogus. Worth investigating further.
 kennsippell
All 11 comments
@kennsippell were the chrome dev tools open or closed when you did these tests?
 SCdF
on 29 Nov 2018
SCdF
on 29 Nov 2018
@SCdF Open. I haven't attempted to measure precisely, but still appears to be a leak (slower) when closed. You have good reading on the impact of DevTools on this?
kennsippell
on 29 Nov 2018
@kennsippell definitely not a good reading, but I have noticed that leaving dev tools open overnight in our app (so not changing tabs, just completely idle, and against an idle local DB) can often cause huge amounts of ram usage for the tab and often a lot of cpu usage.
However, I have not put effort into replicating or isolating this-- sometimes I just wake up after working on webapp the day before and my laptop fan goes nuts. I have just always presumed that dev tools === slow + dodginess. That could be a bad presumption though...
SCdF
on 30 Nov 2018
I may have a fix for this, or at least a partial one.
I found some leaks that are easily avoidable.
 dianabarsan
on 3 Dec 2018
dianabarsan
on 3 Dec 2018
@kennsippell I've pushed some changes to a branch, as an attempt to fix some of these memory leaks.
I've touched Messages, Contacts and Reports.
If you find the time, could you please checkout and re-run the tests with these changes? Thanks in advance!
dianabarsan
on 4 Dec 2018
@dianabarsan Added most recent measures into the PR.
The actual leak is not as severe as reported above. My chrome extensions were interfering.
kennsippell
on 7 Dec 2018
To AT, follow these steps:
- Login as a restricted user with a healthy number of docs (they need to have data in all tabs for the test to be valid!) in some incognito browser - this is important as any extensions you may have would possibly interfere with the results
- Visit all tabs and let them load completely
- Go to Messages tab
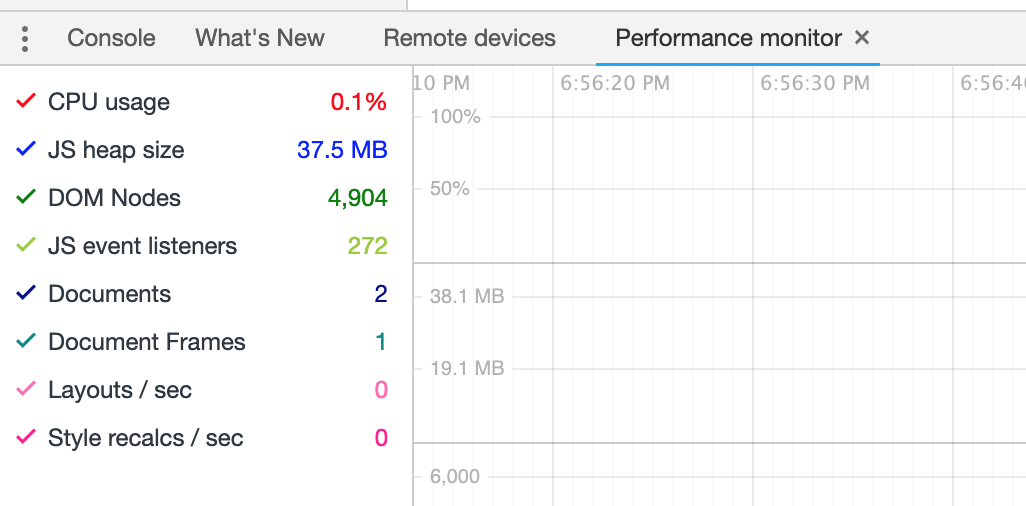
- Open DevTools and go to Performance tab, _force garbage collection_ and then open Performance monitor (Settings -> More tools -> Performance monitor)
- In performance monitor, make sure it registers JS heap size, DOM nodes and JS event listeners. These are the metrics we will follow.
- Switch to console and run this script, __closing DevTools__ after it starts:
(() => {
  let i = 0;
  const mInterval = setInterval(() => {
    if (i % 5 === 0) $('#messages-tab').click();
    if (i % 5 === 1) $('#tasks-tab').click();
    if (i % 5 === 2) $('#reports-tab').click();
    if (i % 5 === 3) $('#contacts-tab').click();
    if (i % 5 === 4) $('#analytics-tab').click();
    if (++i > 100) {
      clearInterval(mInterval);
    }
  }, 2500);
})();
(2500ms was enough of a timeout to load any tab completely on my PC, but you can increase this interval if it's too low).
Let the script finish. You should be back to the messages tab now. Repeat from step 4, recording the 3 metrics after every iteration. Repeat as many times as you like, maybe at least 4 times.
Compare metrics across iterations. Slight variations are normal. It's very important to force garbage collection before recording.
There is also more information/discussions on the PR: https://github.com/medic/medic-webapp/pull/5073#issuecomment-445877319
dianabarsan
on 16 Jan 2019
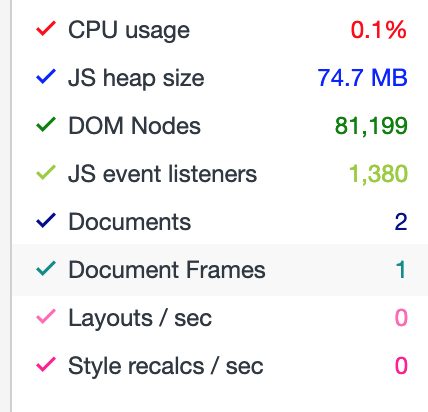
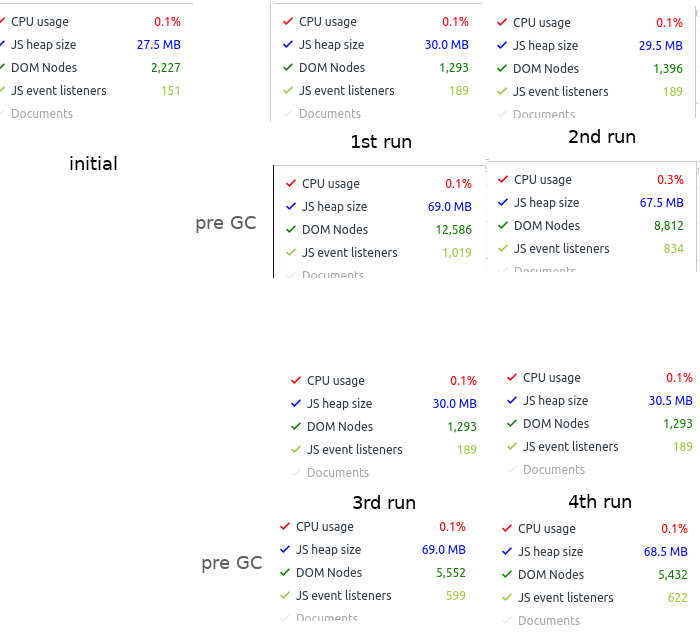
There seems to be a linear increase the heap size each run (even after running the garbage collector).... but not a big difference.
Run 1
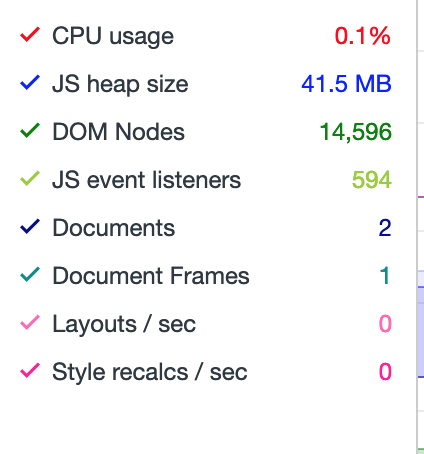
Run 2
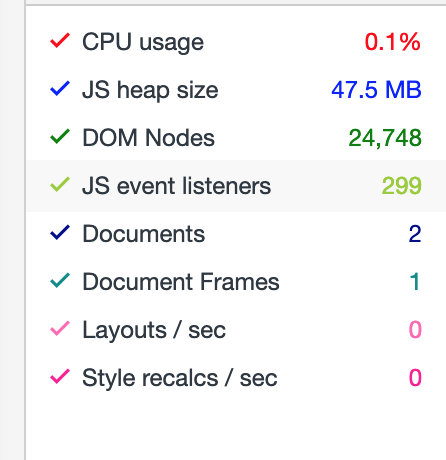
Run 3
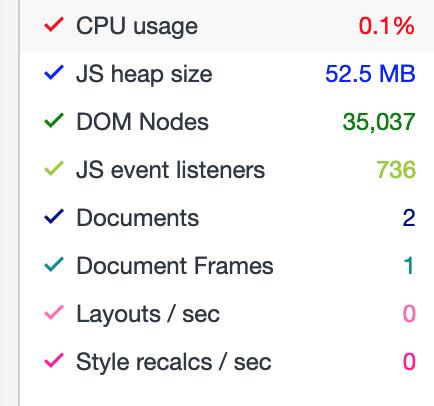
Run 4
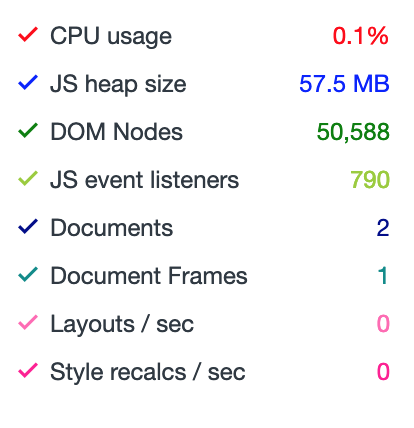
Run 5
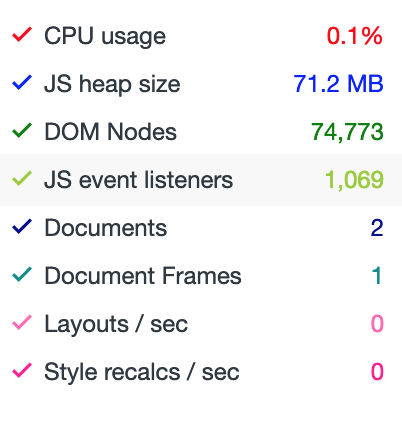
Run 6
 ngaruko
on 2 Mar 2019
ngaruko
on 2 Mar 2019
@ngaruko
Are you sure you are following the steps exactly, including running the tests with a closed dev tools in an incognito browser?
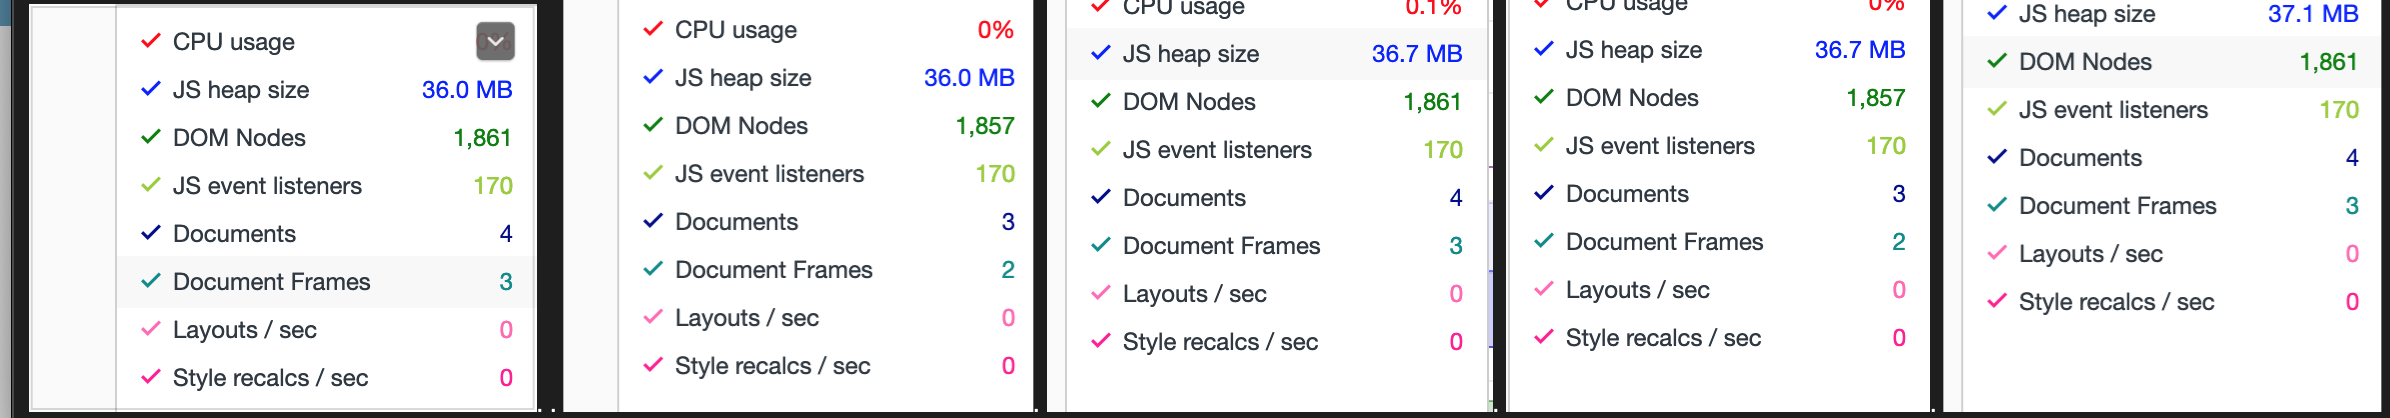
I ran them again, myself, on gamma.dev with a restricted user and these are my results:
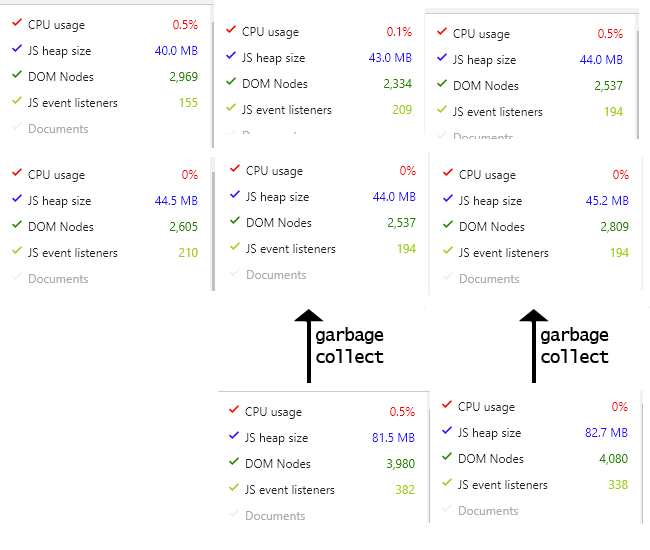
A total of 6 runs, for the last 2 I included the performance status before clicking on the garbage collect button too.
Can you please tell me how and where you are testing this, so I can try to replicate?
dianabarsan
on 3 Mar 2019
Running the test 4 times on gamma.dev, logged in as the user indicated by @ngaruko
dianabarsan
on 4 Mar 2019
LGTM
Thanks @dianabarsan
ngaruko
on 5 Mar 2019
Related issues
 mandric
·
60Comments
mandric
·
60Comments
 benkags
·
36Comments
benkags
·
36Comments
 sglangevin
·
35Comments
sglangevin
·
35Comments
 estellecomment
·
38Comments
estellecomment
·
38Comments
 n-orlowski
·
29Comments
n-orlowski
·
29Comments
Most helpful comment
To AT, follow these steps:
(2500ms was enough of a timeout to load any tab completely on my PC, but you can increase this interval if it's too low).
Let the script finish. You should be back to the messages tab now. Repeat from step 4, recording the 3 metrics after every iteration. Repeat as many times as you like, maybe at least 4 times.
Compare metrics across iterations. Slight variations are normal. It's very important to force garbage collection before recording.
There is also more information/discussions on the PR: https://github.com/medic/medic-webapp/pull/5073#issuecomment-445877319