Chartist-js: multiple series labels and identifying
Hi!! Nice and clean charts!!
i was wondering, i'm using multiple linechart series on my data and i dunno how to identify each line
for each line is a diferent series, how can i label each line / colorline?
Data Example:
var data = {

    //my labels
    labels: ['Mon', 'Tue', 'Wed', 'Thu', 'Fri'],

    //my multiple series
    series: [
        //series1: label example: apples
        [5, 2, 4, 2, 0],
        //series1: label example: lemons
        [8, 1, 14, 12, 10],
    ]
};
all i got is:
http://oi60.tinypic.com/6q8fhv.jpg
but how do i identify each series?
thanks!!
 vlasvlasvlas
All 17 comments
Hi there and thanks! :-) They get a default class that is generated. ct-series-a, ct-series-b, ct-series-c etc. You can also override by using the object series notation:
var data = {

    //my labels
    labels: ['Mon', 'Tue', 'Wed', 'Thu', 'Fri'],

    //my multiple series
    series: [
        //series1: label example: apples
        {
          className: 'apples',
          name: 'My nice apples',
          data: [5, 2, 4, 2, 0],
        },
        {
        //series1: label example: lemons
          className: 'lemons',
          name: 'My nice lemons',
          data: [8, 1, 14, 12, 10],
        }
    ]
};
Then you'll have two things available, first a class will be set on a group above the form elements (series group) as well as some custom attributes on your element containing the original data values. You can also check the new advanced example to attach behavior: http://gionkunz.github.io/chartist-js/getting-started.html#adding-behavior-to-your-charts
 gionkunz
on 10 Sep 2014
gionkunz
on 10 Sep 2014
woow thanks alot! :)
vlasvlasvlas
on 10 Sep 2014
You're welcome!
gionkunz
on 10 Sep 2014
and how can i force to use specific color for each line (lemons = yellow line; apples: red line)? thanks!
vlasvlasvlas
on 10 Sep 2014
You need to use css. Check the chartist css to see what styles are applied. I recommend to inspect your chart in the browser dev tools. You can use various style attributes for svg. Chack this article by Jakob Jenkov which is a great summary http://tutorials.jenkov.com/svg/svg-and-css.html
gionkunz
on 10 Sep 2014
You can add them via the css .ct-chart .ct-series.ct-series-a .ct-line and .ct-chart .ct-series.ct-series-a .ct-point just change the stroke to the color you
want and the series .ct-series-a, .ct-series-b, ... to different colors.
ct-series-a would be your lemons and ct-series-b your apples
 dominicrico
on 10 Sep 2014
dominicrico
on 10 Sep 2014
waw thanks!
if i follow the ClassName example:
{
          className: 'apples',
          name: 'My nice apples',
          data: [5, 2, 4, 2, 0],
        },
        {
        //series1: label example: lemons
          className: 'lemons',
          name: 'My nice lemons',
          data: [8, 1, 14, 12, 10],
        }
then my CSS .ct-series-a, ct-series-b wil also be replaced by 'apples', 'lemons'?
vlasvlasvlas
on 10 Sep 2014
It would be nice if there was also a way to specify the line style in javascript, without using CSS. This would be useful if you want the style to represent data.
 Timmmm
on 8 Jan 2015
Timmmm
on 8 Jan 2015
@Timmmm, styling in JavaScript is against the core principle of Chartist to keep a clean separation of concerns. If you need to dynamically style your element you can use the draw events of Chartist.
gionkunz
on 10 Jan 2015
@gionkunz I understand what you mean - you want the line style to literally be part of the website style. However sometimes the line style can be used to convey information about the data itself, which is handled in javascript. For example how would you do this chart in chartist?:
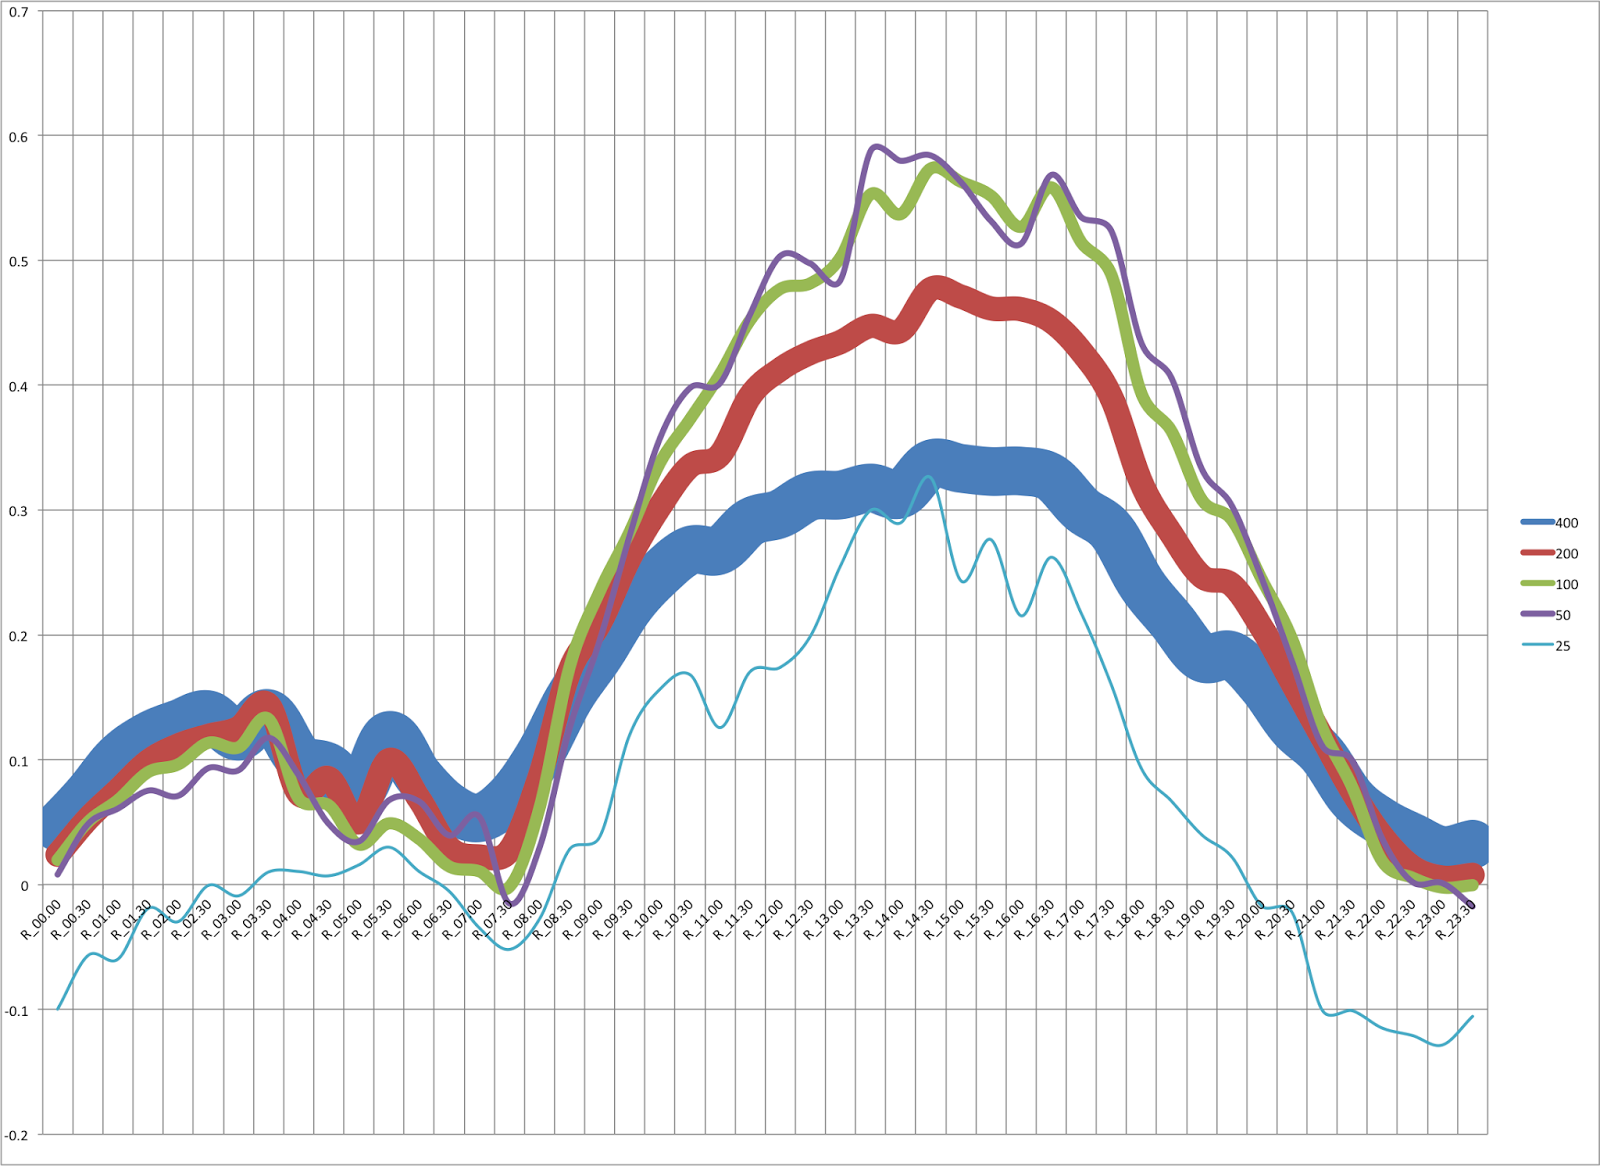
(Assuming that you did not know the widths in advance. Not the best example but you get the idea.)
In my case the graph lines are literally related to colours, so it would be nice to be able to just directly set the line colour to be the same as the colour that the line represents.
Timmmm
on 11 Jan 2015
@Timmmm Again, Chartist was created with the principle to keep a very strong separation of concerns. However, if you'd like to make your chart dynamic and use behavior to change your chart appearance, you can make use of the reactive event model in Chartist.
Your example could simply be implemented with the following code:
http://jsbin.com/xusinu/1/edit?css,js,output
I hope this helps.
Cheers
Gion
gionkunz
on 11 Jan 2015
Great example, that'll do nicely thanks!
Timmmm
on 12 Jan 2015
txs!!
vlasvlasvlas
on 30 Jan 2015
How would you do this sort of bar chart coloring, where items under certain label would be color coordinated? http://www.politiko.dk/barometeret
 lkallioniemi
on 11 Feb 2015
lkallioniemi
on 11 Feb 2015
@lkallioniemi I guess this is a different use case where you display series along the X axis instead of drawing all series per step on the X axis. For this sort of bar chart you'd need to specify two series (poll one and poll two) and specify the paries as labels. Using the draw events like in this example http://jsbin.com/xusinu/1/edit?css,js,output you can then apply the colors to the bars.
gionkunz
on 12 Feb 2015
I have this script:
var options = {
    plugins: [
        Chartist.plugins.ctPointLabels({
            labelClass: 'ct-label',
            textAnchor: 'middle',
            labelInterpolationFnc: function(value) {
                return value.toFixed(2)+'kg';
            }
        })
    ],
    showPoint: true,
    lineSmooth: false,
    axisY: {
        labelInterpolationFnc: function(value) {
            return value + 'kg';
        }
    }
};
var data = {
    labels: ['Maio', 'Junho', 'Julho', 'Agosto'],
    series: [
        {
            name: 'oleo',
            data: [2.7, 2.6, 1.9, 1.5]
        },
        {
            name: 'margarina',
            data: [4.2, 4.5, 3.4, 2.8]
        },
        {
            name: 'acucar',
            data: [11.3, 11.2, 7.2, 5.7]
        }
    ]
};
new Chartist.Line('.ct-chart', data, options);
but the subtitles of series don't show like a example of @Timmmm !!!! why?
 wgbn
on 16 Aug 2016
wgbn
on 16 Aug 2016
@wgbn search for chartist label plugin on NPM / Github.
gionkunz
on 21 Aug 2016
Related issues
 pjfsilva
·
4Comments
pjfsilva
·
4Comments
 alberk8
·
4Comments
alberk8
·
4Comments
 adilbenmoussa
·
4Comments
adilbenmoussa
·
4Comments
 unhinged
·
3Comments
unhinged
·
3Comments
 denisvolokh
·
4Comments
denisvolokh
·
4Comments
Most helpful comment
Hi there and thanks! :-) They get a default class that is generated. ct-series-a, ct-series-b, ct-series-c etc. You can also override by using the object series notation:
Then you'll have two things available, first a class will be set on a group above the form elements (series group) as well as some custom attributes on your element containing the original data values. You can also check the new advanced example to attach behavior: http://gionkunz.github.io/chartist-js/getting-started.html#adding-behavior-to-your-charts