Caseflow: Reader instability investigation
Problem
Users are experiencing instability with Reader, including a significant number of crashes. This issue is to describe some new efforts we're going to pursue make to determine the source or sources of this instability, and to solicit feedback from others on the best path forward.
- Is there really a memory leak, or are there unexpectedly high performance demands in certain situations that overwhelm users' browsers?
Summary of current efforts
We've basically been trying to manually create conditions on local dev, UAT, and prod that cause a crash and use browser developer tools to reconstruct what happened. This approach doesn't seem to be working very well for a few reasons:
- Our dev machines are much faster than VA users (can run a VM), so it's difficult to cause a crash on dev machines
- Users report that crashes are non-deterministic and happen only sometimes when repeating the same behavior
- We do see memory creeping up in our repro attempts, but we haven't gotten to the bottom of why. We need to get more methodical.
Ideas
Three snapshot approach
I'll try this afternoon on UAT:
https://addyosmani.com/blog/taming-the-unicorn-easing-javascript-memory-profiling-in-devtools/
Open the DevTools > Profiles
Take a heap snapshot
Perform an action in your app that you think is causing leaks
Take a heap snapshot (ex: browse through 5-6 docs, zoom, add comments, add tags— or just open the document list page)
Repeat the same stuff once more
Take a final heap snapshot
Select the most recent snapshot taken
At the bottom of the window, find the drop-down that says "All objects" and switch this to "Objects allocated between snapshots 1 and 2". (You can also do the same for 2 and 3 if needed)
In the view you'll see a list of leaked objects that are still hanging around. You can select one to see what is being retained in its retaining tree.
Maybe: Rubric for collecting information from users who report crashes
If this memory leak is correlated with certain variables or patterns of user behavior, we want to be able to narrow this down. Going forward, here are some questions we could ask users to try to get more of a framework to reason about crash reports.
- Was the user on VPN or local VA network?
- What was the username of the user?
- Approximately how many Reader tabs did the user have open?
- What appeal was the user looking at?
- Approximately how long was the user's Reader session (that is, how long since the user opened the first Reader tab until the crash)?
- What was the user doing right before the crash?
- Did they have multiple appeals open?
- Did they have the document list view open? If so, how many? (This is important because the document list view will trigger requests for all documents in a folder)
- Do they ever click the Next or Previous button more than 3-4 times quickly?
Maybe: Monitoring JS heap size
We don't currently have monitoring that reports on crashes. We might look into Sentry internals to figure out why, but it's likely that if a crash happens without a window.onerror firing, Sentry will not be able to report on it. We only have a few dozen Board users right now. We could instruct them to start Chrome with the --enable-precise-memory-info flag which exposes JS heap size at window.performance.memory:
{
  totalJSHeapSize: 29400000,
  usedJSHeapSize: 15200000,
  jsHeapSizeLimit: 1530000000
}
Then add monitoring of the JS heap size (Google Analytics? Sentry? Prometheus?) to watch how it grows. We could then get a sense of how much memory users have available when they're using Reader, and would get monitoring that tells us which users are experiencing crashes when, and could potentially correlate that with logs (may be a long slog of a process). This would only capture JS memory and not memory allocated directly to DOM nodes or otherwise allocated (https://developers.google.com/web/tools/chrome-devtools/memory-problems/?utm_source=dcc&utm_medium=redirect&utm_campaign=2016q3)
Maybe: test PDFjs for memory leaks
We've never tested PDFjs separately. Create a local env to test if PDFjs leaks memory or dom nodes. Just open, render, and close documents on a loop, over and over.
 amprokop
All 14 comments
Actively looking for critiques of current ideas and new ideas for how to move forward if anyone has thoughts!
amprokop
on 19 Sep 2017
Questions:
Can we reproduce this at all?
Do we know users that have experience this?
How do we know this is a memory leak issue?
Is Chrome crash reporting turned on for our users?
It is possible to read Chrome crash dumps. However, it is non-trivial to set up and will require some C/C++ and assembly reading experience. I would do this as last resort.
http://www.chromium.org/developers/decoding-crash-dumps
 askldjd
on 19 Sep 2017
askldjd
on 19 Sep 2017
@askldjd
Can we reproduce this at all?
I have caused Reader to crash on a low-spec (4GB RAM, 5+ year old) computer sitting on the podium in Chobani by trying to nav through 30+ documents in rapid succession. When I try to behave like a more normal user behavior, I haven't seen a crash.
Do we know users that have experience this?
@abbyraskinUSDS receives reports through the Feedback app and through email, and has been responding to those users.
How do we know this is a memory leak issue?
We don't, necessarily. We have observed Reader using huge amounts of memory (5GB+) via Activity Monitor. According to @mdbenjam, he expects that Reader should only keep 3 documents at a time in memory, and those docs have a 60MB file max. So it does seem we are using unexpectedly high amounts memory somehow. However, it doesn't necessarily follow that that memory use creeps up over time, and in fact, GC does seem to correct for our high memory usage (even when it gets really high, eventually GC takes care of it).
Is Chrome crash reporting turned on for our users?
Not sure.
amprokop
on 19 Sep 2017
Another consideration is that there's a chance my refactoring efforts will magically clean things up. Some behavior will be changed. We will be rendering fewer pages at once, which might help. We also are using React Lifecycle events to clean up pdfs, which seems more reliable than my old code. I'm hoping to merge the feature branch into master by the end of the week. No guarantee that it fixes it, and it's still worthwhile to investigate.
Until then I'm thinking anything that we can add that helps diagnose things is probably the best path to go down. Either seeing if we can get sentry errors for browser crashes or monitor the memory usage.
 mdbenjam
on 19 Sep 2017
mdbenjam
on 19 Sep 2017
sentry errors for browser crashes
I don't think that's possible. This is a native code crash in the C/C++ layer. The interpreter will also crash along with the tab container process. There is no chance for JS engine to run because this is not an exception that can be caught in the managed JS world.
If you look into chrome crash reporting, you can notice that the report actually contains a minidump file to Google. The dump report is something that requires a debugger (e.g. windbg/gdb) with debug symbols to interpret.
askldjd
on 19 Sep 2017
Today's investigation report
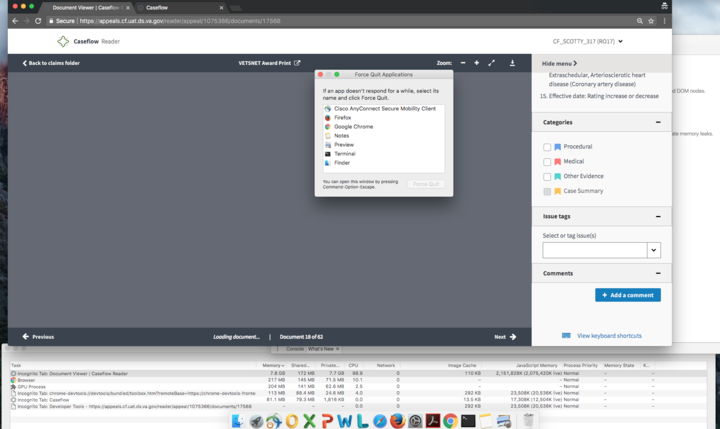
Tested in UAT. Opened appeal 1075466 in an incognito tab and flipped rapidly back and forth to the end of all 65 documents and back to the first, for 1-2 minutes.
Memory went up to 1GB while i was flipping, then continued to climb slowly with no user input until it hit around 8GB. I force quit Chrome at that point.
amprokop
on 19 Sep 2017
It really hard to diagnose this issue without actually being able to replicate it consistently. I agree with Mark, he has been doing a pretty big refactor of pdf.js and page rendering logic. It might be a wise to wait and see if the problems still persists after the refactor.
But we do need a better way to diagnose this problem and actually capture some data from the users.
- Is it always the same users that have this problem or is the set variable?
- How often does this happen per day per user? What exactly are they doing when this happens?
- Could the be max cache limit being reached? I'm not sure how chrome reacts if the number is reached.
- We should watch this crash happen live at a user's desk and observe the patterns that are causing this problem. Maybe have a tech savvy user record this?
I'm not sure how useful monitoring the heap size might be, if it's only capturing the Javascript memory and nothing else.
Pdf.js tests have to wait until Mark finishes up with the refactor.
 tejans24
on 19 Sep 2017
tejans24
on 19 Sep 2017
Yeah — since @mdbenjam advised that he's about to refactor a ton of the code, I think we should wait to continue investigating until that's merged in. No sense trying to hit a moving target on this.
amprokop
on 19 Sep 2017
Going to leave this issue open, but assign it to @mdbenjam for now — @mdbenjam when you merge in your refactor, can you assign it back to me?
amprokop
on 19 Sep 2017
It's reproducible. I just crashed my machine completely by leaving reader open.
Also see:
- https://github.com/department-of-veterans-affairs/caseflow/issues/3205#issuecomment-328385403
- https://github.com/department-of-veterans-affairs/caseflow/issues/2722#issuecomment-318212410
- https://github.com/department-of-veterans-affairs/caseflow/issues/1960
- https://github.com/department-of-veterans-affairs/caseflow/issues/2532
Documents with 100ish pages can easily crash. confirmed by users referencing 500+ page documents.
need a user in UAT with all 500+ page documents? Just Slack me.
 ghost
on 20 Sep 2017
ghost
on 20 Sep 2017
We should watch this crash happen live at a user's desk and observe the patterns that are causing this problem.
Great idea, @tejans24. We are fortunate that we have the ability to just walk down the hall and talk to people.
 NickHeiner
on 20 Sep 2017
NickHeiner
on 20 Sep 2017
Always happy to facilitate any field trips (or Lync calls), let me know!
 abbyraskinUSDS
on 20 Sep 2017
abbyraskinUSDS
on 20 Sep 2017
Yep, as soon as Mark's refactor gets merged in and deployed to prod, we should jump on the next crash report and ask the user if we can shadow :)
amprokop
on 20 Sep 2017
Closing because Mark and team did a ton of refactoring after this ticket and into early 2018
 laurjpeterson
on 30 May 2019
laurjpeterson
on 30 May 2019
Related issues
amprokop
·
6Comments
 leikkisa
·
4Comments
leikkisa
·
4Comments
 lowellrex
·
5Comments
laurjpeterson
·
5Comments
lowellrex
·
5Comments
laurjpeterson
·
5Comments
 yoomlam
·
5Comments
yoomlam
·
5Comments
Most helpful comment
Going to leave this issue open, but assign it to @mdbenjam for now — @mdbenjam when you merge in your refactor, can you assign it back to me?