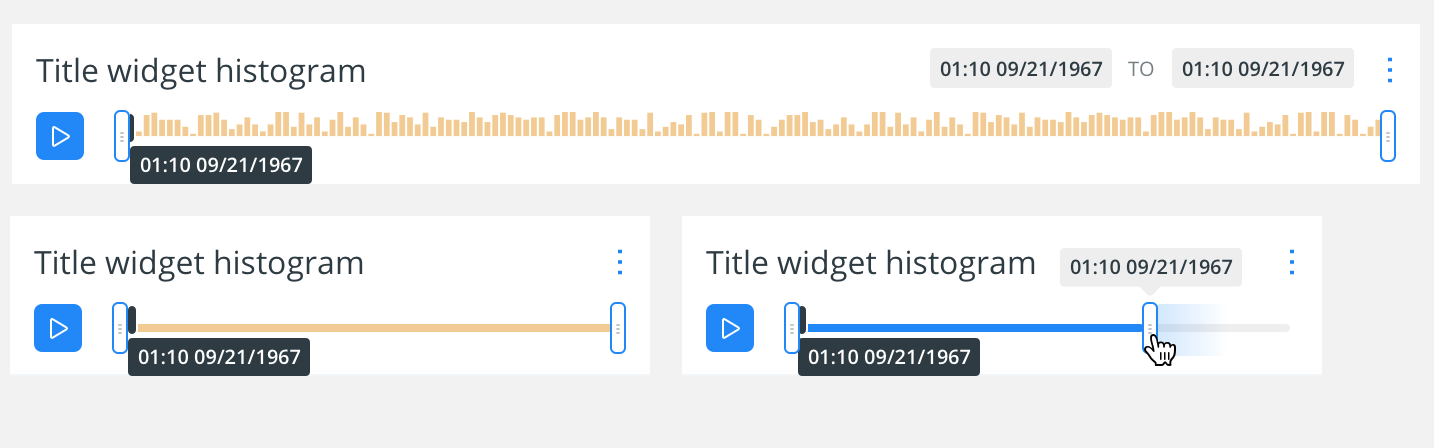
Cartodb: Implement responsive behaviour for time series
Time series elements positions & apperance varies a lot with screen size.
Sample:
 rjimenezda
All 11 comments
Oh, why is it blocked?
 xavijam
on 8 Aug 2017
xavijam
on 8 Aug 2017
Blocked until we release https://github.com/CartoDB/cartodb/issues/12088.
xavijam
on 8 Aug 2017
I've deployed it to ded04 if someone wants to have a look.
cc @CartoDB/design
 rubenmoya
on 14 Aug 2017
rubenmoya
on 14 Aug 2017
I'll take a look :D
 josecruz
on 14 Aug 2017
josecruz
on 14 Aug 2017
Looking great!! Just found two small things:
- When you add an animated layer it works as expected. until you filter inside the playing range:
- Behaviour
- Expected
Disabled play button
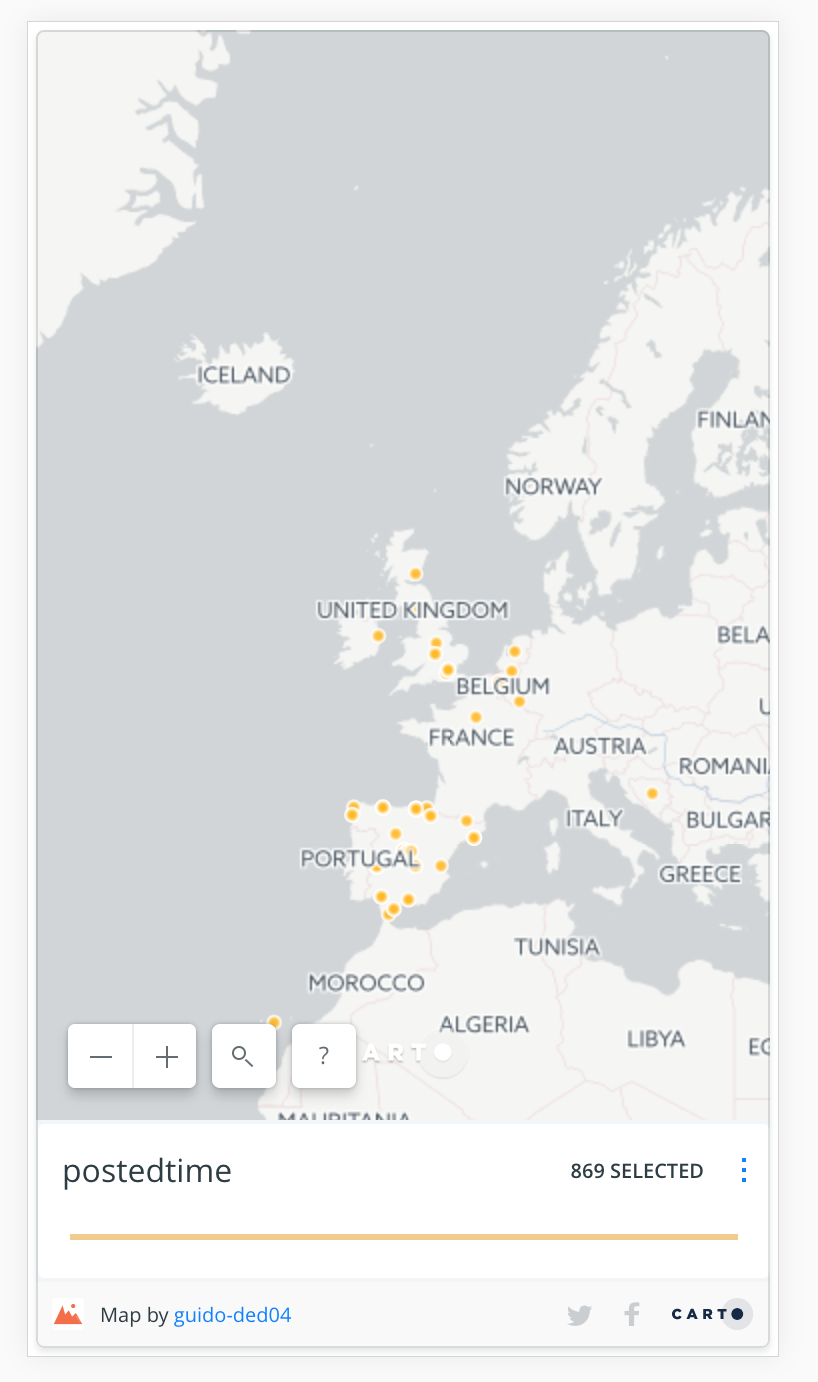
- Maybe this is more related to @CartoDB/design but when it's a Time Series widget instead of an animated layer, it shows a flat orange line on the widget with no more context. Should work that way? cc @noguerol
josecruz
on 14 Aug 2017
Hey guys! I don't know if it's a late change but:
Can we show the handlers on that bar by default and also activate the option "Show Totals" so that way we make it look more like an "interactable bar with data"

vs

(but orange)
josecruz
on 16 Aug 2017
Let's open a new issue with that change, since this is being merged already
rubenmoya
on 16 Aug 2017
@josecruz can you open it? :*
 noguerol
on 16 Aug 2017
noguerol
on 16 Aug 2017
@noguerol sure thing
josecruz
on 17 Aug 2017
Reference it here, please
noguerol
on 17 Aug 2017
Guys, closing this one because it was already added in production.
xavijam
on 21 Aug 2017
Related issues
 nygeog
·
5Comments
noguerol
·
5Comments
nygeog
·
5Comments
noguerol
·
5Comments
 piensaenpixel
·
4Comments
piensaenpixel
·
4Comments
 ramiroaznar
·
4Comments
ramiroaznar
·
4Comments
 fernando-carto
·
5Comments
fernando-carto
·
5Comments