Bedrock: Analysis: page load time and conversion
| Estimates | |
| ------------- | ------------- |
| TL | 3|
| PM | |
| ENG | 3 hours |
| SEO | |
| ANA | |
| DES | |
| COPY | |
Conduct an analysis including any necessary experiments to confidently bucket page load times by their relationship to conversation rates.
:yellow_heart: Success Criteria :yellow_heart:
- [x] We have analyzed historic conversion rates across enough dimensions to gain some insights into any experimentation that we might do
- [x] We can more clearly articulate a hypothesis based on these insights
:heavy_exclamation_mark: Risks :heavy_exclamation_mark:
- [ ]
Tasks
- [x] Plot conversion rates against pageload time
- [x] Drill down into several dimensions looking for any interesting correlations: Device type (mobile/desktop), Locale (Tier 1 vs. Not), CTA type (Desktop download, newsletter signup, accounts signup)
 hoosteeno
All 24 comments
@hoosteeno please see https://github.com/mozilla/bedrock/issues/6720 (I'd very much like to talk about this in our 1:1)
 alexgibson
on 23 Jan 2019
alexgibson
on 23 Jan 2019
@hoosteeno @alexgibson I'm working on an analysis related to this ask to benchmark the relationship between longer page load times and bounce rate/conversion rate. Hoping this will help us to size the opportunity ahead of us.
In the meantime, I'll keep adding to the Mana page I made here: https://mana.mozilla.org/wiki/x/m4ZoBQ
And please feel free to edit the document if there is anything you would like to change or have me look into further!
 sghoseWI
on 28 Jan 2019
sghoseWI
on 28 Jan 2019
@hoosteeno @alexgibson -- based on my pre-experiment analysis, I agree that we could benefit from running an experiment on this to help us understand how longer page load times affect our business.
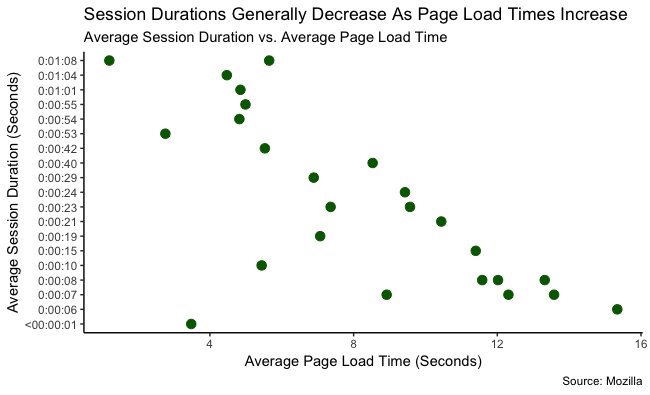
From the charts below, we can see that across the most visited pages in January 2019, there seems to be a strong positive relationship between higher page load times and bounce rate. In the same vein, there seems to be a strong inverse relationship between higher page load times and average session duration.
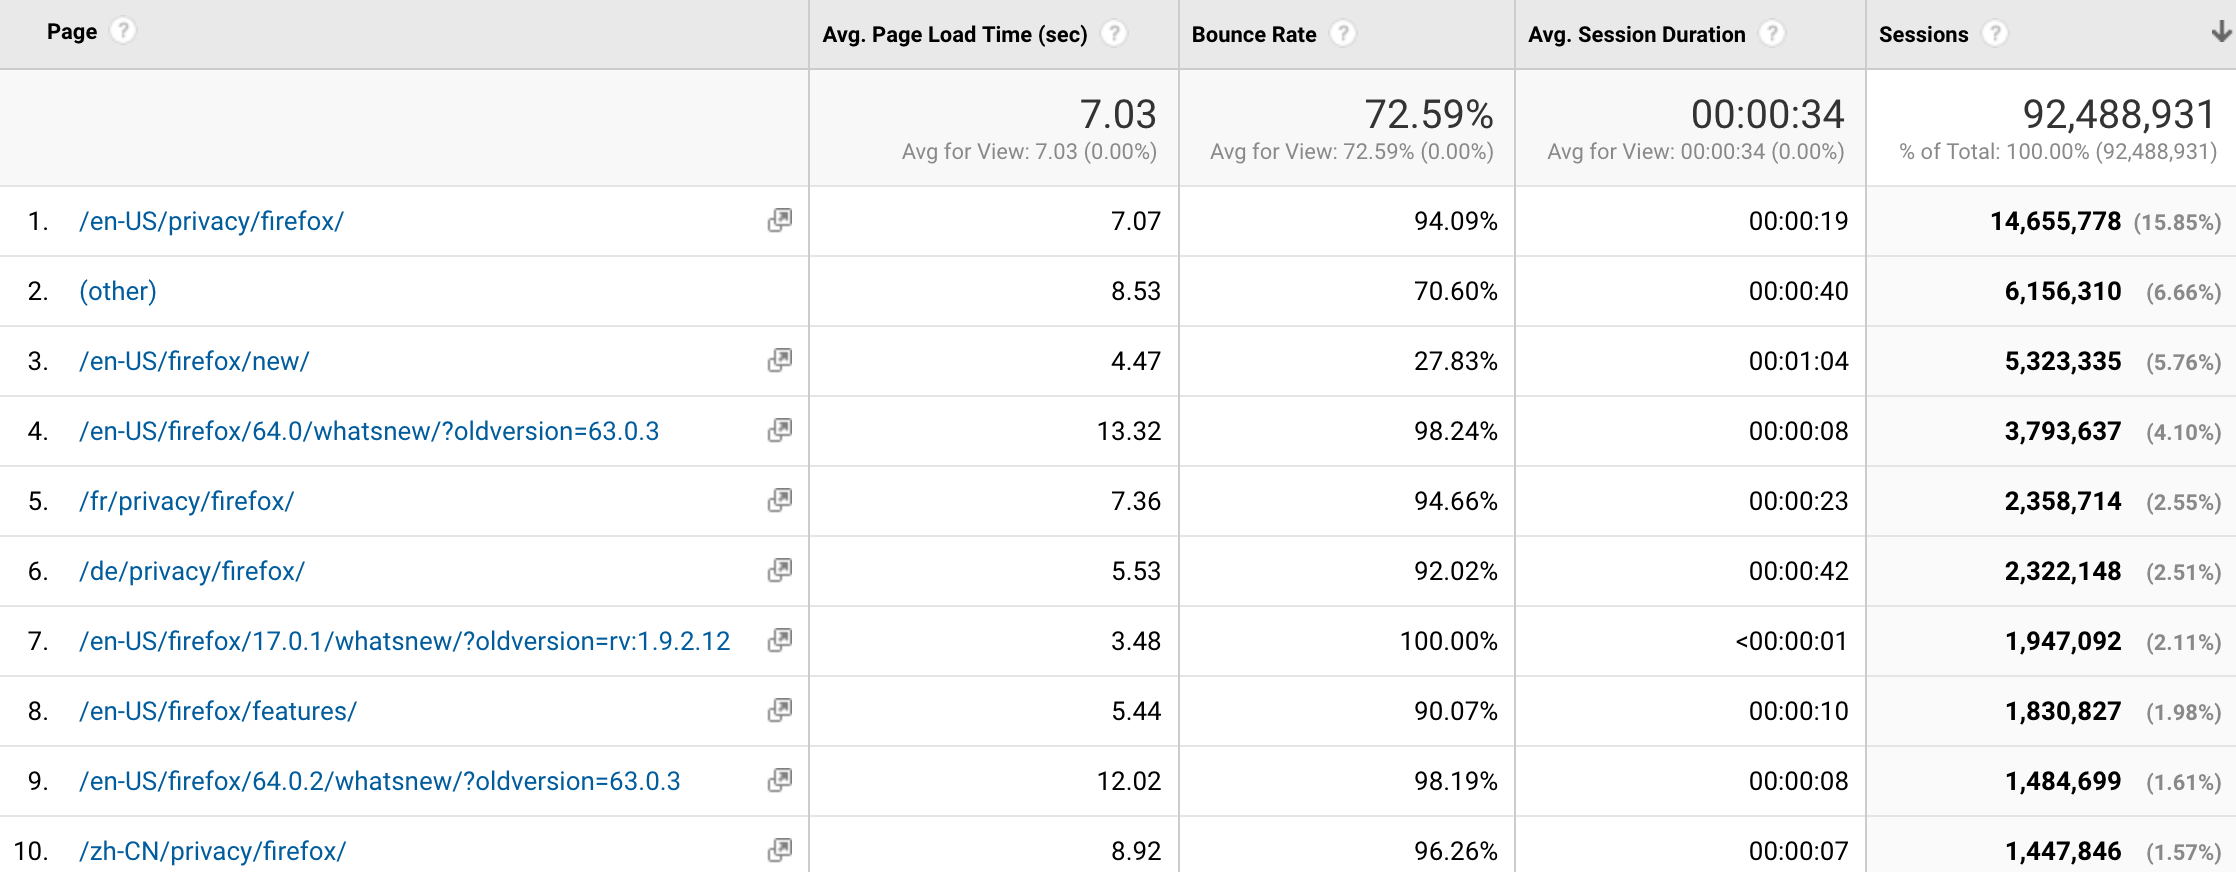
From the table below, we can see that when target_url = www.mozilla.org/firefox/new/ is perhaps a good option for us to choose to experiment with as it has a relatively low average page load time (4.47 seconds), low bounce rate (27.83%), and long average session duration (1 minute 4 seconds) -- all with over 5 million sessions so far in 2019. Plenty to sample from -- even if we choose to dimension by mobile vs. desktop devices as @alexgibson suggested. And it is perhaps more sensitive to experimental changes than pages that already take longer to load as is.
If we decide to move forward with experiments in this direction, for whatever target audience we choose, I propose we have at least a few different treatment variations (with images of different sizes for each group loading in the background). This way, we can test how each incremental unit of additional page load time is statistically associated with changes in our success metrics. Similarly, if there is something that we can do to experimentally _decrease_ the load times of some of the pages that take longer on average to load, it may be useful to test whether our success metrics meaningfully _improve._
Should we scope this out in AirTable with our RICE score estimates? Otherwise I can go ahead and flesh out my thoughts on sample size estimates, experiment duration, traffic distribution, etc. in the Mana page linked above... thoughts on how to proceed?

sghoseWI
on 31 Jan 2019
@sghoseWI this sounds great to me, thanks so much for diving in to help pre-verify our theory here. I think your suggestion of using different treatments to stagger page load times is a great idea. It would be really interesting to look at the data incrementally this way.
I'll defer to @hoosteeno on the next steps here, but I'd welcome fleshing out estimates and detailing things such as cohort variations further. If it would help, I'd very much like to try and put together some estimates as to how many extra kB each page variation could potentially load in order to delay load times by (x) seconds etc.
alexgibson
on 31 Jan 2019
@sghoseWI thanks! It's good to know that site engagement appears to relate to page load times.
I am especially interested in understanding pageload impact on conversion rates. Do conversion rates for desktop downloads or accounts signups relate to page load times?
hoosteeno
on 31 Jan 2019
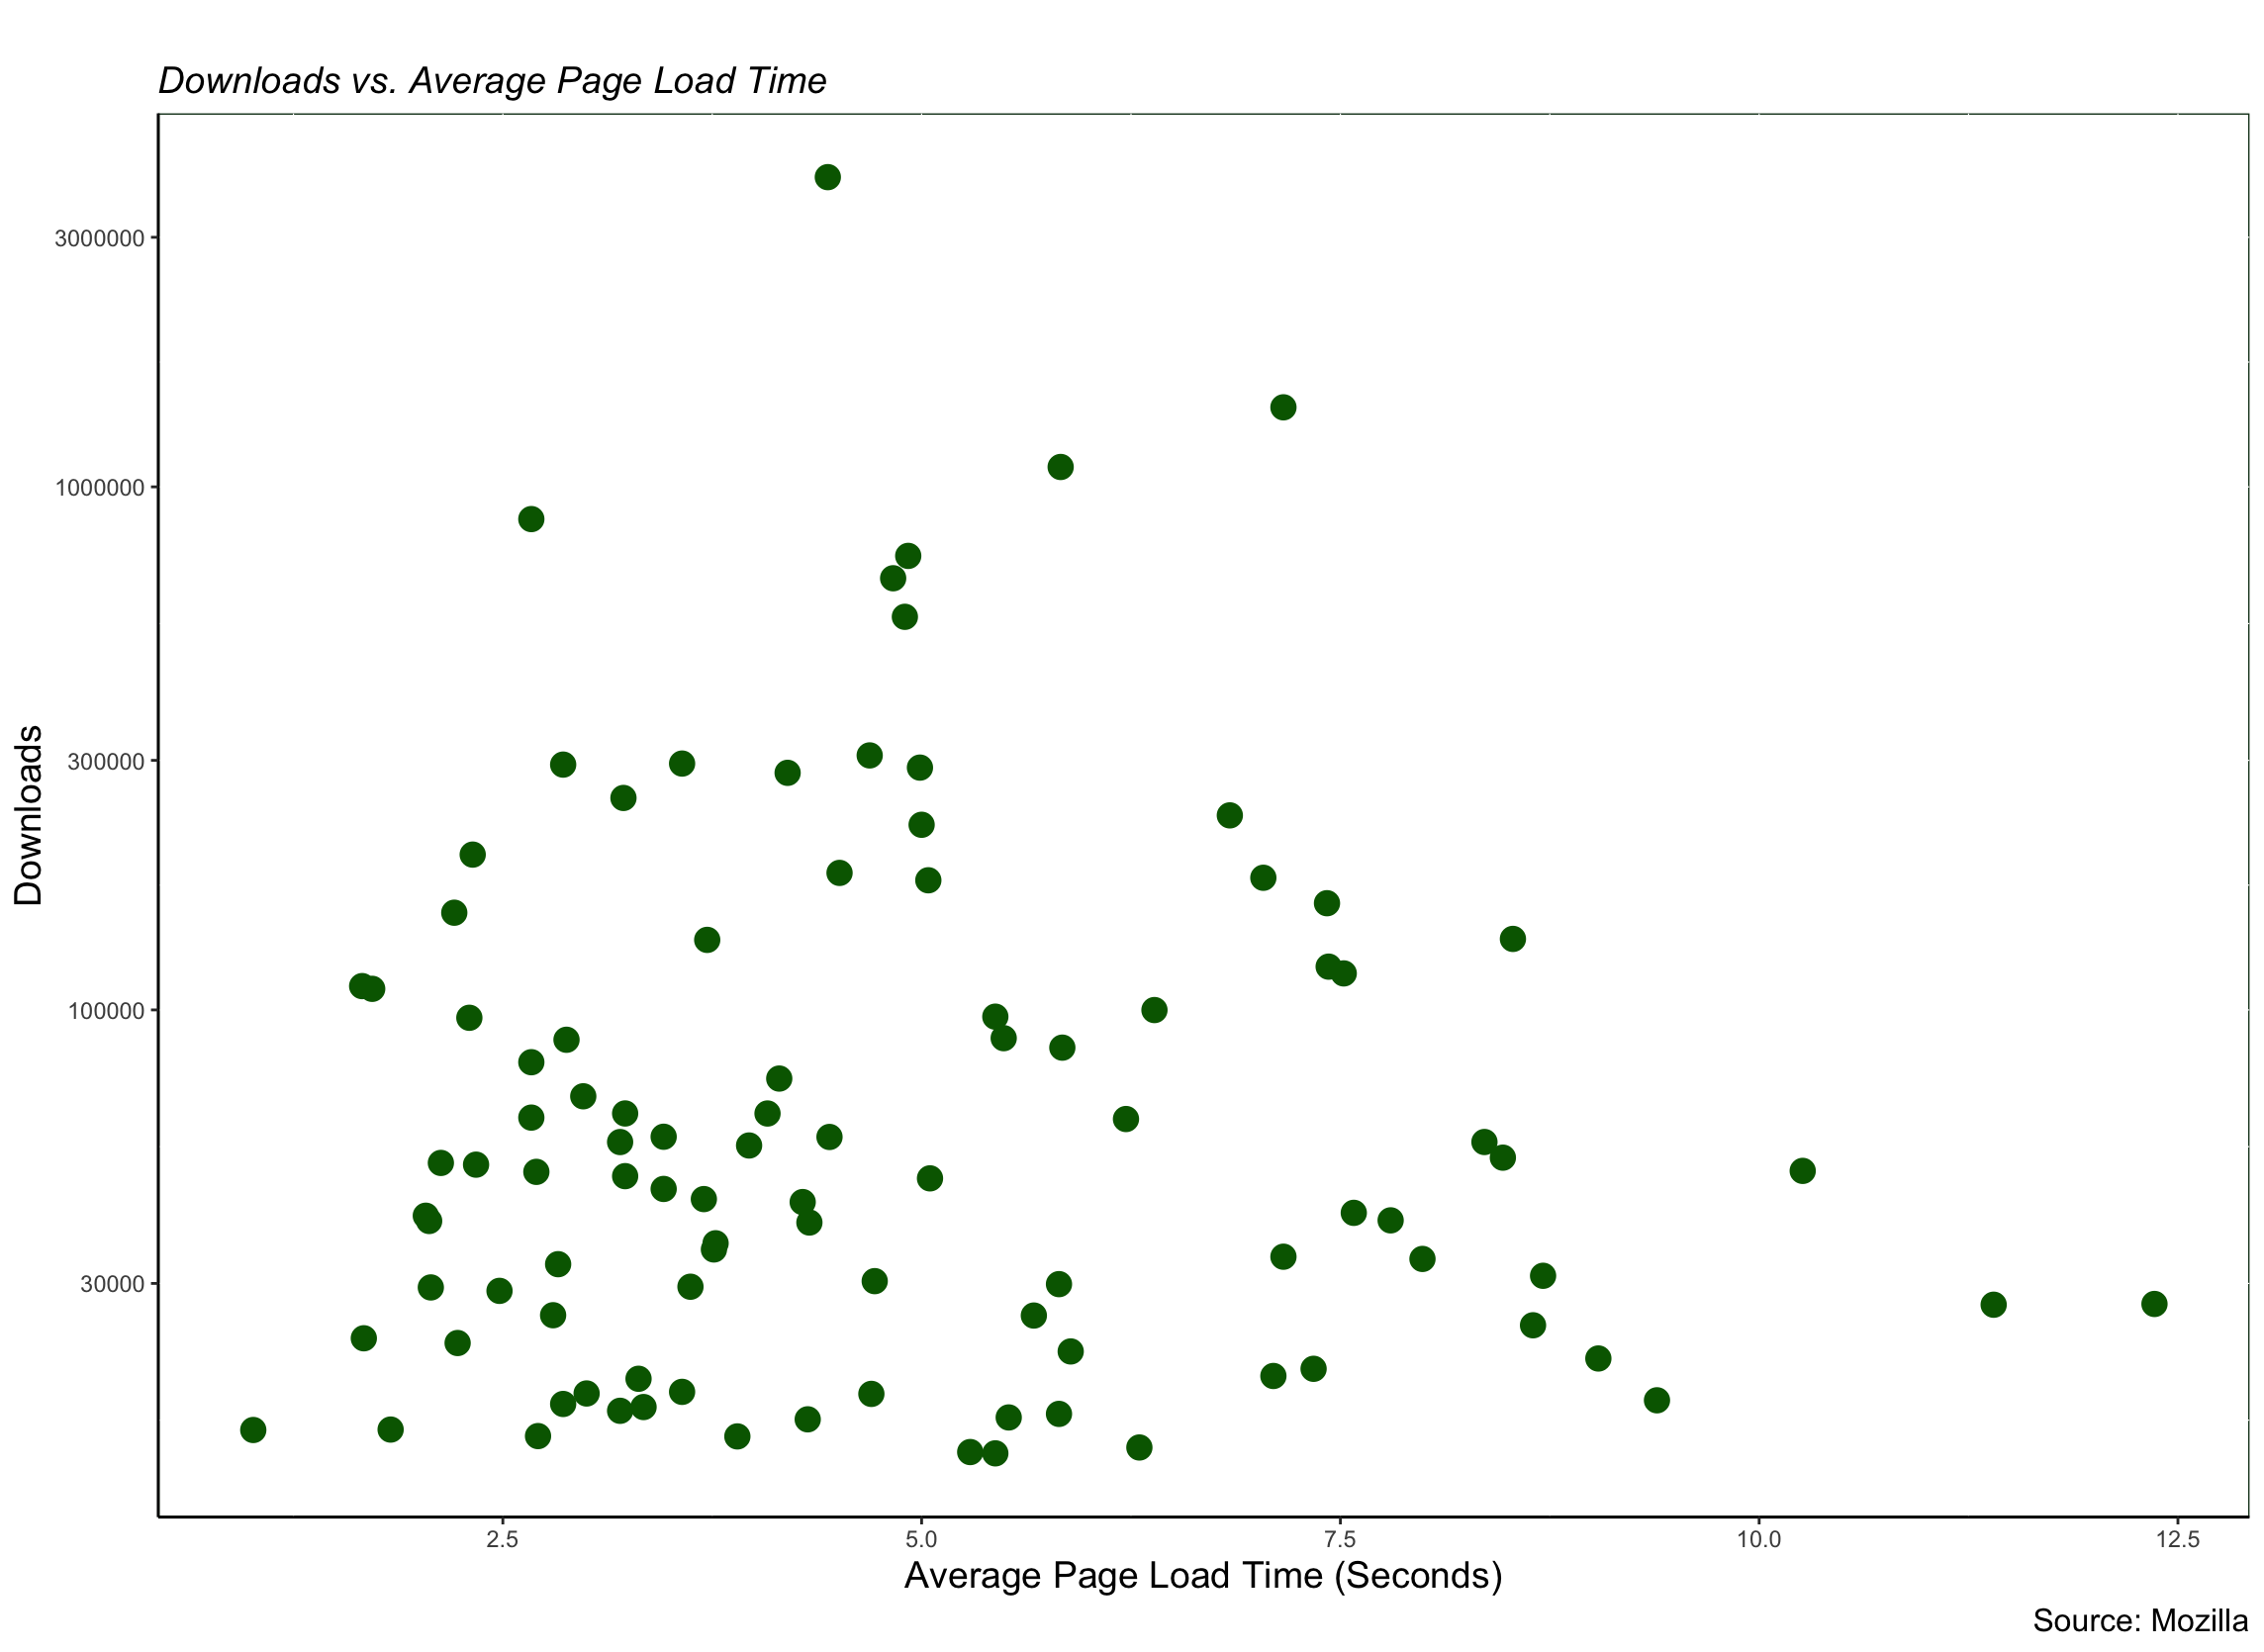
@hoosteeno, it doesn't look like there is as strong of direct relationship between FX downloads and page load times. There is very little correlation in either direction between these variables (I'm seeing a correlation coefficient of .005). This is based off the same time horizon as the previous charts:
sghoseWI
on 6 Feb 2019
@sghoseWI @hoosteeno interesting that this seems very noisy, and is somewhat in contradiction to the bouncerate analysis (an increase in bouncerate should naturally also imply a decrease in clicks).
I've been thinking more about this experiment, and I wonder if it would be prudent to try and understand the effect on other types of interactions as well. For example, we could run this experiment on multiple pages where the main type CTA differs e.g.
- A product download page.
- A Firefox Accounts CTA.
- A newsletter signup CTA.
I also think we really need to get more granular in our analysis of different populations of users. My hunch is there will likely be distinct differences between desktop and mobile traffic, for example, as well as in different parts of the world.
alexgibson
on 7 Feb 2019
I've also been thinking about the variations we could use for such an experiment. My current thinking is something along the lines of the following:
- Variant A: Loads (x) kB of extra images outside the visual viewport (non-blocking).
- Variant B: In addition to the same (x) kB of images, load (x) kB of CSS & JS (blocking).
- Variant C: In addition to the things in A & B, introduct a delay in web font loading (FOIT).
- Variant D: In addition to all the above, delay content above the fold being visible by (X) seconds.
The idea would be that each variant gets progressively slower, whilst still being visually identical once loaded.
alexgibson
on 7 Feb 2019
Good questions @alexgibson . I have updated the issue card with a couple measures of completion and some tasks. I think we can answer several of the questions you're asking with historical data, which will help us focus our hypotheses. @sghoseWI does this task make sense to you?
Drill down into several dimensions looking for any interesting correlations: Device type (mobile/desktop), Locale (Tier 1 vs. Not), CTA type (Desktop download, newsletter signup, accounts signup)
hoosteeno
on 7 Feb 2019
@hoosteeno Makes sense to me -- I'll dig into this and comment back on here when I have something more to share.
@alexgibson Thanks for the feedback -- lots of interesting questions for me to look into!
sghoseWI
on 7 Feb 2019
Is there anything we can do to make sure we're comparing like to like users? For example, a user in San Francisco, CA is going to have a much better connection than a user in Gainsville, AK. Can the users be segmented according to technology or location or some other proxy for good internet connections?
The user's perception of our page speed is going to be really different depending on how fast other pages load on their connection and technology. A 5 second wait will mean different things to different users.
 stephaniehobson
on 11 Feb 2019
stephaniehobson
on 11 Feb 2019
Great points @stephaniehobson! This fine level of analysis is something I'd love for us to be able to reason about more. This kind of detail may be somewhat hard to measure by looking at our existing GA data alone. With the help of @sghoseWI, I'd really like to start work on constructing this experiment soon.
alexgibson
on 13 Feb 2019
Hi All - please see below for the pre-experiment analysis I put together; drilling down deeper into the points discussed above. Would love to hear any feedback and thoughts on how we can best proceed from here!
sghoseWI
on 14 Feb 2019
@sghoseWI this is great, thank you. I think meeting to discuss the next steps here would be good?
One question I do have re: the weaker correlation to page load times vs downloads - is this looking at average downloads across all channels, or just FF desktop downloads? Is there a difference between mobile downloads and desktop?
Edit: also, the higher correlation between page load times and FxA completion rate ties in nicely with our teams OKR. Measuring against this in an experiment seems like a no-brainer? 🙂 I do think we also need to understand the influence on download rate better still, so testing against both of these type of conversion would be really interesting.
alexgibson
on 14 Feb 2019
Thanks @alexgibson! That was for FF desktop downloads. I'll look into whether I find a meaningful difference across that cut for desktop vs. mobile and let you know!
I think meeting to discuss next steps makes sense too. As a thought -- can we re-frame the experimental treatment so that we IMPROVE page performance (perhaps by reducing the size of images on a page) as opposed to artificially worsening page performance? I think this would help us better understand how incremental increases in dev time focused on improving page performance affect our key performance metrics -- which I think would be a more telling experiment than the converse.
So instead of our general hypothesis being:
"Web pages that take longer to load will have a higher bounce rate, especially on slower connections, and higher bounce rates will naturally incur the cost of a decrease in download conversions. If we can measure that cost, then we can also estimate about increases in conversions for new and exsiting web pages. This estimation may help us (as a Marketing org) to spend more time thinking about, and working on page performance."
We can perhaps change to:
"Web pages that take less time to load will have a lower bounce rate and lower bounce rates will naturally lead to an increase in account sign-ups. If we can measure that improvement, then we can also have an informed estimate of how much of our team resources to dedicate to improving page performance."
sghoseWI
on 14 Feb 2019
I think meeting to discuss next steps makes sense too. As a thought -- can we re-frame the experimental treatment so that we IMPROVE page performance (perhaps by reducing the size of images on a page) as opposed to artificially worsening page performance? I think this would help us better understand how incremental increases in dev time focused on improving page performance affect our key performance metrics -- which I think would be a more telling experiment than the converse.
I think this is worth discussing in a meeting. The key thing I think we should consider is there should be no visual difference between variations, else we risk influencing conversions in other ways. It's a lot harder to improve page speed substantially without altering appearance in some way. Making the page slower is easier in a controlled environment like this. That said, I think certainly we could do at least one variation where we try to cut out unneeded CSS/JS (if possible), lazy-load, or further compress images in some way.
alexgibson
on 14 Feb 2019
@sghoseWI great analysis. Based on your observation, do you think there is a likely impact in FxA acquisition if we improve pageload time? Could you offer any estimate about the upper bounds of that impact across
a) Tier 1 locales
b) All locales
hoosteeno
on 14 Feb 2019
Could you offer any estimate about the upper bounds of that impact
We should also consider that whilst improving performance may well have upper bounds in its effectiveness, decreasing performance could have a whole different impact.
alexgibson
on 14 Feb 2019
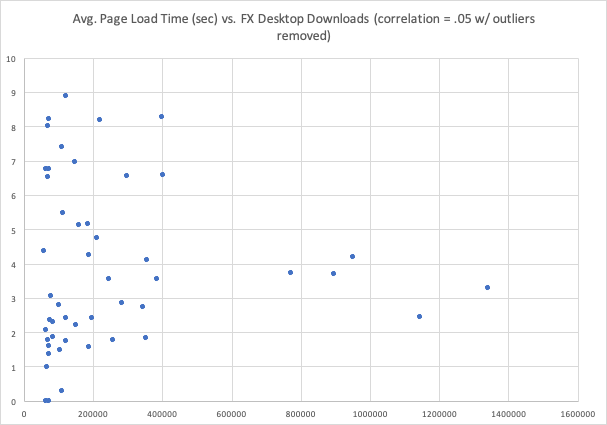
@alexgibson -- I looked at the cuts of mobile vs. desktop downloads. The correlation coefficients between page load times and downloads seem quite weak in both cases (.05 in desktop vs. .15 for mobile).
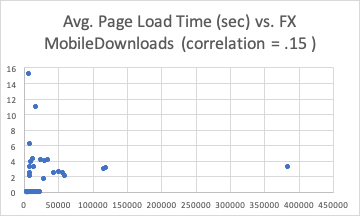
@hoosteeno Based on my observations/analysis, I do think that there is a likely impact in FxA acquisition if we improve page load times -- but it seems to be marginal. I now think that this proposed experiment may be listed a bit too high in the list of experiment opportunities we have in the backlog -- based on the pre-experiment analysis on the success metric of FxA signups.
It is difficult to quantify an upper bound of that impact across tier 1 vs. all locales without knowing how much we would expect the experimental treatment to speed up or slow down page load times a priori.
To try to get closer to an informed estimate though, I took a stab at building some simple linear models to see the impact that page load times have on FxA signups in these two cohorts.
Across all locales and pages where downloads occur (and across all devices), each incremental 1 second increase in average page load times is associated with a decrease in 600 account sign-ups (based on the 1.5 month training period for this analysis). It is important to note, these results are weakly statistically significant and are likely somewhat biased due to omitted variables not captured.
In just Tier 1 alone, there does not appear to be a statistically significant relationship between average page load times and FxA registration completions (given the training set used).
As @alexgibson said, we will likely not be able to very easily decrease average page load times across cohorts by a large amount. It seems we could much more easily increase page load times -- but I'm not sure how the insights generated from a treatment of worse site performance would help us drive towards meaningfully improving our core KPIs like FxA signups. My sense is that the opportunity here may not be as promising as once thought -- though certainly interesting.
sghoseWI
on 19 Feb 2019
Thanks, that's helpful. I have adjusted the experiment's score as a result of this analysis. It's always a bummer when data don't validate assumptions, but good to learn.
There are other important reasons to manage page load times. Conversion rate may not be the reason. @alexgibson , unless you have add'l questions, I think we can close this analysis card.
hoosteeno
on 19 Feb 2019
Thanks both. Honestly, I'm kinda bumbed out about what this data suggests. We're not the first company to investigate running an experiment like this, and there are many others who have found a direct impact that is is both real and worthwhile, and there is a wealth of data to back it up. As a browser maker, I'm suprised that we don't think we're gonna see some kind of impact here. Striking this off as something not worth measuring seems perhaps premature to me, at least when we only have general GA data to look at.
it seems we could much more easily increase page load times -- but I'm not sure how the insights generated from a treatment of worse site performance would help us drive towards meaningfully improving our core KPIs like FxA signups.
While yes there is likely an upper bound to an increase in conversions that we would likely see by improving page load times, that does not mean making load times worse aren't at all useful as an experiment (quite the opposite imho). What I wanted to hopefully come away with from an experiment like this was not just a new opportunity to look for increasing conversions on our existing pages, but also some data to affirm why we should avoid making our pages slow to load to begin with. To me, this seems super important. If we can show that making our pages slower effected conversions, then it can also be used as a reason why we should be doing our very best to avoid that. This is how companies such as Etsy quantified the direct impact of performance at their company and made people take notice. It seems to be a fairly commonly used method, and something that has worked elsewhere. That said, if we wanted to take the other route and try to improve loading times of an existing page, we could try and do that too.
I agree I think we can close this analysis issue, as there's likely not much more we can tell from looking in GA. However I would still like to consider the following:
- If we think this experiment isn't going to have much impact in terms of conversions, then I'd at least like to reaffirm it to ourselves under a more controlled environment.
- I don't think an experiment like this would be a whole lot of work. Also, if we're confident in our initial analysis, then adversely effecting page load times in a controlled experiment shouldn't be too much of a concern. We could still also go the other route of course, to try and improve load times.
- Also, we initially saw a very clear correlation between load times and bounce rate / sessions. I don't think we should ignore this. Perhaps we could focus more on this metric, or on the impact on page views in general under more controlled conditions.
- If the experiment backs up our early indicating data here in that performance does not significantly impact conversions, then as a next step I'd like to start thinking more about other UX factors on why performance is important, and to start concentrating on those.
alexgibson
on 19 Feb 2019
Interestingly, after browsing through https://wpostats.com, I came across this:
https://blog.mozilla.org/metrics/category/website-optimization/
Whilst these are old blog posts, this shows some prior experimentation that did have some significant results.
alexgibson
on 19 Feb 2019
@alexgibson Thank you sharing all these relevant links -- really good to know about the promising results other companies saw in conversion rates by focusing on page performance. It is also very helpful for me to see what kinds of similar analyses/experiments have been done before (like the 2010 A/B test at Mozilla you linked to above).
You make a compelling case -- and I'm now finding myself feeling similarly bummed that the pre-experiment analysis doesn't seem to show a larger FxA opportunity!
Happy to help tackle whatever next steps you and @hoosteeno think make sense from here.
sghoseWI
on 19 Feb 2019
We're going to meet to debrief, so closing as I think this analysis is complete for now 👍
alexgibson
on 19 Feb 2019
Related issues
alexgibson
·
8Comments
hoosteeno
·
9Comments
alexgibson
·
14Comments
 ejregithub
·
7Comments
hoosteeno
·
11Comments
ejregithub
·
7Comments
hoosteeno
·
11Comments