Azure-functions-durable-extension: Function App doesn't scale when custom HubName is specified
Issue branched from #104
I have a normal (non-durable) queueTrigger to kick off my orchestration. I am processing a batch of 20,000 items. My orchestration has 3 activities run in serial.
When the initial queueTrigger is active I see worker scaling. Once the queuetrigger has processed the backlog then I just have the orchestration and it's activities. At this point there's 20,000 items in the orchestration workqueue. I then start to see VMs dropping off, and eventually ALL VMs will stop even when items (1000s) remain in the orchestration work queue.
If I poke the functions app and wake it up then processing resumes. If I leave it alone it stops.
If it didn't go to sleep and didn't scale down the VMs then I could easily live with the current processing speed of an individual orchestration.
 AHoran
All 26 comments
Thanks for opening this issue. I confirmed that there is indeed a problem that causes the scale controller to fail to wake up and scale out your function app. Unfortunately this investigation also revealed that there is a bug in our telemetry collection which prevents me from seeing what the actual error is. A more in-depth investigation is needed.
By chance had you tried your scenario using 1.0.0-beta? I'm curious to know whether it was working before but failed after updating your extension to 1.1.0-beta2.
 cgillum
on 9 Dec 2017
cgillum
on 9 Dec 2017
I've only started using recently, and only beta2
AHoran
on 9 Dec 2017
OK, thanks. I'll look deeper to see what's going on with this.
cgillum
on 11 Dec 2017
@AHoran This might be a bug in how we resolve task hub names in the scale controller. In your host.json file, do you have a value specified for HubName?
If not specified, the default value is DurableFunctionsHub. I confirmed that I also was not able to scale when I specified a non-default name for the task hub. I was able to fix the issue on my test app by removing the task hub name or explicitly setting it to DurableFunctionsHub. Can you give that a try?
cgillum
on 11 Dec 2017
I should add, make sure you don't have another function app with the default task hub name in the same storage account. Otherwise the two will interfere with each other. If each of your function apps have their own storage accounts, then you should be fine.
cgillum
on 12 Dec 2017
I did have a custom task hub name, I didn't realise there was a default. I have removed the hub name from host.json and redeployed.
In my initial queueTrigger phase I scaled up to 8 machines. Now in the phase in which it processes only the durable work items queue I am seeing 20+ machines running. (Currently 26!)
So i can continue testing with this now that I am able to complete my batches. i just need to juggle my storage accounts carefully.
Thanks.
AHoran
on 12 Dec 2017
Cool - glad we found a workaround for this. I'll keep this issue open to track making a proper fix.
cgillum
on 12 Dec 2017
I tested this the other day and we still seem to have this issue. @tohling do you know if the Kudu updates were deployed to production?
Here is what I see in the scale controller logs for my orchestrator function. I noticed it doesn't say anything about the task hub:
Adding or updating trigger: [{"functionName":"MapReduceOrchestration","type":"orchestrationTrigger","name":"context"}]. ActivityId = a2d683e7-e297-4264-88e3-374a3a0ba829
@cgillum could you share the site name?
 suwatch
on 22 Mar 2018
suwatch
on 22 Mar 2018
Hey @suwatch. The site name is DFMapReduce in West US 2. The timestamp I'm looking at is 2018-03-20 06:11:18.7239264.
cgillum
on 22 Mar 2018
It is casing issue. In Kudu, we looked for HubName while the host.json uses 'hubName'. This is not a regression from Kudu (always use HubName). Please advise whether to fix Kudu or DurableTask?
suwatch
on 22 Mar 2018
@suwatch, thanks for the quick investigation! You are correct, the current case format is based on the documented format in https://docs.microsoft.com/en-us/azure/azure-functions/functions-host-json#durabletask
@cgillum - Do you want the case changed?
 tohling
on 22 Mar 2018
tohling
on 22 Mar 2018
The functions runtime allows either hubName or HubName. The host.json metadata is always parsed with case-insensitive property names. Can the Kudu code be updated to be case-insensitive as well? Otherwise this could be a common problem.
cgillum
on 22 Mar 2018
Umm .. looking at script host, it uses the same parser. Do we have concern with others (such as ScaleController or alike) reading this json being case-insensitive?
suwatch
on 22 Mar 2018
That's just parsing the JSON which doesn't care about case sensitivity. It's the deserialization of the JSON which is case-insensitive. Newtonsoft.Json deserializes in a case-insensitive way, which is why Kudu needs to support case-insensitive fields as well.
The scale controller never sees host.json. It only sees what Kudu sends it, so we do not have to worry about case-sensitivity there as long as Kudu and the Scale Controller are consistent.
cgillum
on 22 Mar 2018
Kudu (using common JObject.Parse) and ScaleController (using DataContractJsonSerializer) are both case sensitive and correct per Json rule. Are you saying we all have to follow Function runtime (happen to use JsonConvert.PopulateObject which is case-insensitive not follow Json rule)?
If kudu were to support case-insentivity (eg. type and Type property name), ScaleController will not be able to deserialize that.
I suggest a compromising solution addressing specifically this scenario (hubName vs HubName). Kudu can look for both. Given scale controller does not care about hubName and HubName, it is non issue.
suwatch
on 22 Mar 2018
The issue is not JObject.Parse, but rather JObject.TryGetValue. There is an overload which allows you to specify case-sensitivity rules. Using this overload would solve all the problems.
Here's an example of what I'm looking for (in PostDeploymentHelper.cs):
private static string GetTaskHub(string hostConfigPath)
{
    string taskHubName = null;
    var json = JObject.Parse(File.ReadAllText(hostConfigPath));
    JToken durableTaskValue;
    if (json.TryGetValue(Constants.DurableTask, StringComparison.OrdinalIgnoreCase, out durableTaskValue) && durableTaskValue != null)
    {
        var kvp = (JObject)durableTaskValue;

        JToken hubNameValue;
        if (kvp.TryGetValue(Constants.HubName, StringComparison.OrdinalIgnoreCase, out hubNameValue) && hubNameValue != null)
        {
            taskHubName = hubNameValue.ToString();
        }
    }

    return taskHubName;
}
This change will not impact the scale controller in any way because the scale controller does not see host.json - it only sees the custom JSON contract that kudu gives it. It's okay if that payload is case-sensitive because customers cannot influence it.
I don't know whether function.json is also case-insensitive, but if it is then it might be a good idea to make a similar change to the function.json parsing code in Kudu.
cgillum
on 22 Mar 2018
Hi,
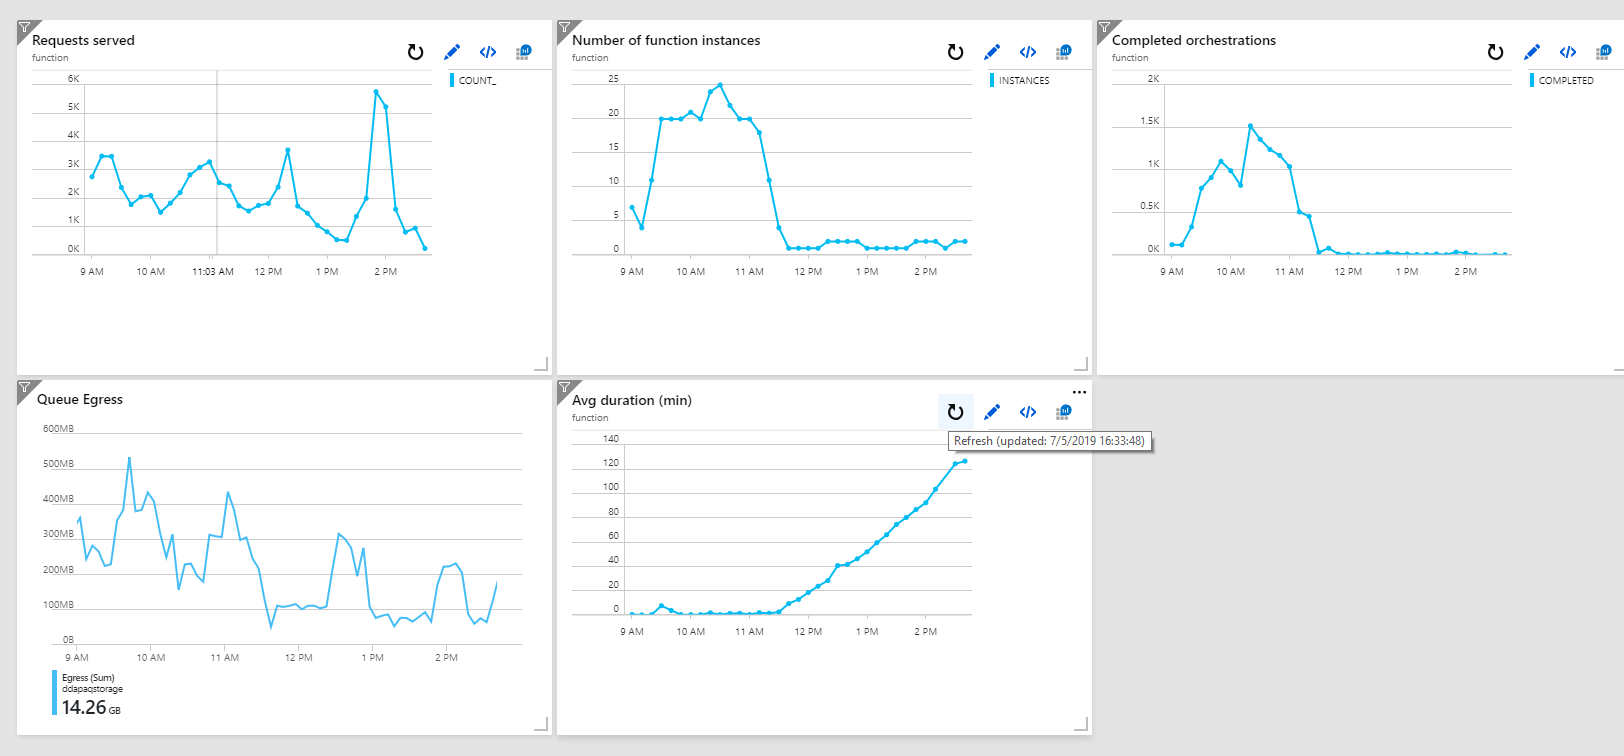
It seems I'm still observing this behavior. When I use a custom hubname only one or two servers are used and performances start to degrade unde load (of course). If I remove the custom name the app is scaled to many instances based on the queues backlogs.
Here are some graphics I collected today from my tests. From 9am to 11:30 I didn't use a custom name. At 11:30 I deployed the host.json with the custom hubname.
This was my host.json file
{
  "version": "2.0",
  "extensions": {
    "durableTask": {
      "hubName": "%DdapaqHubName%",
      "controlQueueBatchSize": 32,
      "partitionCount": 16,
      "maxConcurrentActivityFunctions": 10,
      "maxConcurrentOrchestratorFunctions": 10,
      "extendedSessionsEnabled": false,
      "extendedSessionIdleTimeoutInSeconds": 30,
      "maxQueuePollingInterval": "00:00:30"
    }
  }
}
(there was an entry in the appsettings of the function app).
I'm not sure if I should open a new issue for this.
 alberto-riggi
on 7 May 2019
alberto-riggi
on 7 May 2019
I have been troubleshooting a similar issue with queue latency for my durable function. At peak time, it seems to be taking up to 10 minutes for the orchestration function to run again after an activity completes. I am envious of the charts that alberto-riggi posted above. Can anybody point me in the right direction for collecting that kind of information about my own durable function?
Specifically, how do I get "Number of Function Instances", "Completed Orchestrations, and "Average Duration". I am assuming that he composed his own queries for those.
 KenLange314
on 23 May 2019
KenLange314
on 23 May 2019
@alberto-riggi the issue is that the scale controller has a bug where it doesn't understand the app setting reference used for your task hub name. There is another issue open tracking the same problem: https://github.com/Azure/azure-functions-durable-extension/issues/648. Unfortunately this platform issue still isn't fixed though I expect it should be in the next few weeks. Until then you'll need to use hard-coded task hub names.
cgillum
on 23 May 2019
@cgillum, I suspect that I am also running into this issue. I have two separate Azure Functions each with durable functions sharing a storage account but with separately specified Hub Names. Only one of them is experiencing processing latency during peak time. I suspect that it's not scaling.
Here is the host.json:
{
  "version": "2.0",
  "extensions": {
    "durableTask": {
      "HubName": "LocationTaskHub"
    }
  },
  "logging": {
    "applicationInsights": {
      "samplingSettings": {
        "isEnabled": false
      }
    }
  }
}
Your comment says "use hard-coded task hub names". I think that I am as shown above right? Or am I misunderstanding something?
Also, your post in #648 shows an Exception that you found in the "Scale Controller Logs". Can I get access to the "Scale Controller Logs" for my Functions? Can you point me to the documentation on this?
Also, as I posted above, @alberto-riggi was able to generate some charts of what appear to be Durable Function / Azure Function related metrics such as "Completed Orchestrations, Average Duration, and Number of Functions Instances". I don't see any such metrics in the documentation so I assume that he created his own queries for these. I haven't been able to do the same. Is there any documentation, guidance, or samples of monitoring those things? Alberto, would you be willing to share your queries?
Thanks!
KenLange314
on 23 May 2019
@KenLange314 I found your app and you don't seem to be running into any platform issues. In the last 12 hours I see that you've been running with 4 VMs and have a relatively light activity function load (the work-item queue latencies tend to be small).
I do see that you have some latency issues on your control queues, however. The quick solution to that is to create a new function app (or drain your current one) with an increased your partition count, as described here: https://docs.microsoft.com/en-us/azure/azure-functions/durable/durable-functions-perf-and-scale#orchestrator-scale-out. More partitions will help you scale out orchestration execution across more than 4 VMs. If you're still seeing problems that you need help with, I think it will be best to open a new GitHub issue for improved tracking.
Regarding pretty charts and queries, these are customizations you can build using Application Insights. I haven't actually tried putting together dashboards like this, but you have access to a bunch of telemetry in AI that you can use to construct your own dashboards:
- General info for Azure Functions: Monitor Azure Functions
- Durable Functions-specific metrics: Diagnostics in Durable Functions in Azure
Once you learn the type of telemetry we emit, you should be able to write your own AIQL queries to produce charts like these.
cgillum
on 23 May 2019
@cgillum, Thanks for the quick response and thanks for taking a look. I will try increasing the partition count as you suggest and I will open a new GitHub issue if we still have problems.
I have read the two monitoring articles that you referenced many times. They give a great amount of low level detail but are somewhat overwhelming and it's a long way from there to getting a useful picture of your orchestration's performance. It would be great to have a more hands-on sample or tutorial for a non-trivial application. When I get my problems sorted out, maybe I'll contribute one. Thanks.
KenLange314
on 23 May 2019
Hi @KenLange314,
sure, hope it helps at least to give you some ideas.
I haven't used appinsight and AIQL too much so take into account that these queries are a little primitive and somehow inaccurate so I'm not very proud of them (they surely need some refinenement). I needed a qualitative idea (instead of exact numbers) of what was going on.
For the avg duration I looked in the traces and joined the events of orchestrator-scheduled and
orchestrator-Completed or orchestrator-Failed.
The query is very ugly, I know you can store a query in a var a reuse it (instead of rewriting it for the join) but didn't have time to play with it yet.
I'm not sure about the "scheduled event" cause I don't know if it actually gets stored when an orchestration starter is invoked, but that's what I have so far.
traces
| where customDimensions.Category == "Host.Triggers.DurableTask"
| extend functionName = customDimensions["prop__functionName"]
| extend instanceId = tostring(customDimensions["prop__instanceId"])
| extend state = customDimensions["prop__state"]
| extend isReplay = tobool(tolower(customDimensions["prop__isReplay"]))
| extend sequenceNumber = tolong(customDimensions["prop__sequenceNumber"])
| where isReplay != true
| where functionName=='Orchestrator'
| where state =='Scheduled'
| join kind= inner (
   traces
   | where customDimensions.Category == "Host.Triggers.DurableTask"
   | extend functionName = customDimensions["prop__functionName"]
   | extend instanceId = tostring(customDimensions["prop__instanceId"])
   | extend state = customDimensions["prop__state"]
   | extend isReplay = tobool(tolower(customDimensions["prop__isReplay"]))
   | extend sequenceNumber = tolong(customDimensions["prop__sequenceNumber"])
   | where isReplay != true
   | where functionName=='Orchestrator'
   | where state =='Completed' or state =='Failed'
   | project endTime=timestamp, instanceId, endState=state
) on instanceId
| project  endTime,  durationMs=(todatetime( endTime) -todatetime(timestamp))/ time(60000ms)
| summarize duration_min=avg(durationMs) by bin(endTime, 5m)
| render timechart`
For the completed orchestration you can use part of the previous query. The only problem is that appinsight sampling might be skipping some traces so you don't get real numbers. The behavior should be there though.
let timeGrain = 5m;
   traces
   | where customDimensions.Category == "Host.Triggers.DurableTask"
| extend functionName = customDimensions["prop__functionName"]
| extend instanceId = tostring(customDimensions["prop__instanceId"])
| extend state = customDimensions["prop__state"]
| extend isReplay = tobool(tolower(customDimensions["prop__isReplay"]))
| where isReplay != true
| where functionName=='Orchestrator'
| where state =='Completed' or state =='Failed'
| summarize completed=count() by bin (timestamp,timeGrain)
| render timechart
For the instances number I used this. I don't know if this is ok, I saw it was confirmed by the number of servers in the live metrics so again I'm using it to understand how the system behaves.
performanceCounters
| summarize instances=dcount(cloud_RoleInstance) by bin(timestamp,5m)
| render timechart
Hope it helps somehow. I haven't been able to find these queries anywhere, I built them on my own so they can be wrong.
If you guys spot some errors or have any comments or suggestions please let me know, I'd love to improve them.
Regards
alberto-riggi
on 23 May 2019
@alberto-riggi, Thanks! That is super helpful. I think it's the join that I was missing. I have "sampling" turned off so that I don't miss any traces. (I kind of wonder that's contributing to my latency issues.)
KenLange314
on 23 May 2019
@alberto-riggi the issue is that the scale controller has a bug where it doesn't understand the app setting reference used for your task hub name. There is another issue open tracking the same problem: #648. Unfortunately this platform issue still isn't fixed though I expect it should be in the next few weeks. Until then you'll need to use hard-coded task hub names.
Thank you for your answer @cgillum .
I look foward to it. I was using that trick to have a different app for two non prod environments using only one storage, and configuring it through appsetting (using in the release pipeline).
I guess for now there isn't a way to achieve it.
On the other side I haven't found a way to use those appsetting references for integer values like:
"durableTask": {
      "controlQueueBatchSize": 32,
 }
//I'd lke to use
"durableTask": {
      "controlQueueBatchSize": %queueBatchSize%,
 }
I haven't found documentation neither. Is there any?
Regards
alberto-riggi
on 23 May 2019
Related issues
cgillum
·
3Comments
 amdeel
·
3Comments
amdeel
·
3Comments
 SimonLuckenuik
·
3Comments
SimonLuckenuik
·
3Comments
 cvanama
·
3Comments
cvanama
·
3Comments
 thomas-schreiter
·
3Comments
thomas-schreiter
·
3Comments