Azuracast: CPU Usage Increases slowly to 100%, then crashes
Installation method
Traditional
Host OS
Ubuntu 16.04.5 - A $5 Digital Ocean droplet, 1vCPU 1GB ram
Describe the bug
Recently, on the latest versions of Azuracast, I have been experiencing issues with high CPU usage, compared to my last experience with it. For around a month I was able to successfully host 7 stations on a single server and this was fine - CPU maintaining at around 75%, with occasionally DJ streaming to one of the stations.
Now, for some reason, the CPU usage increases slowly all the time, until it reaches 100% when I need to restart the droplet and that - the web ui crashes, can't connect through BUTT, even ssh is super sluggish. I have even reduced the number of stations down to 2, but there's still a steady increase in CPU usage to an impending crash.
I have experienced this with two Digital Ocean droplets, in different 'teams'. I did see in @SlvrEagle23's comment here: https://github.com/AzuraCast/AzuraCast/issues/585#issuecomment-387637662 about the swapfile and I added this to the droplets, but this issue still remains and I don't know what to do about it ¯_(ツ)_/¯
Expected behavior
To keep CPU usage at a flat rate.
Relevant Logs
I have checked the liquidsoap logs and nothing out of the ordinary:
[lang:3] AzuraCast Raw Response:....
[decoder:3] Method "MAD" accepted.....
[clock.wallclock_main:2] We must catchup 0.21 seconds!..... etc
The icecast error log has this reoccuring line if it means anything :
WARN slave/slave_startup process has 4096 max file descriptor limit
and the usual WARN connection/get_ssl_certificate Invalid cert file, but that's it.
Screenshots
Screenshot from DO dashboard:
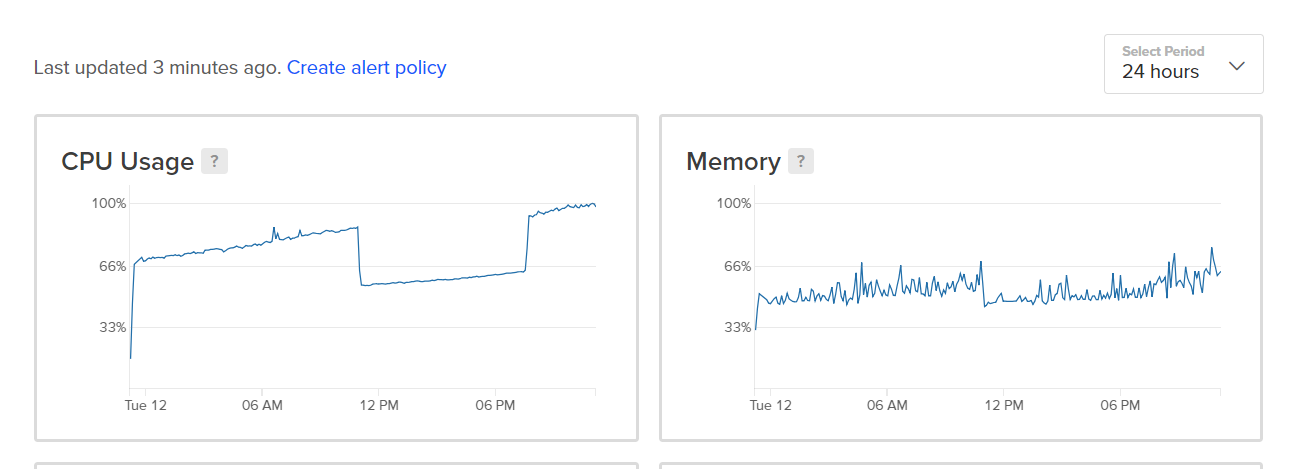
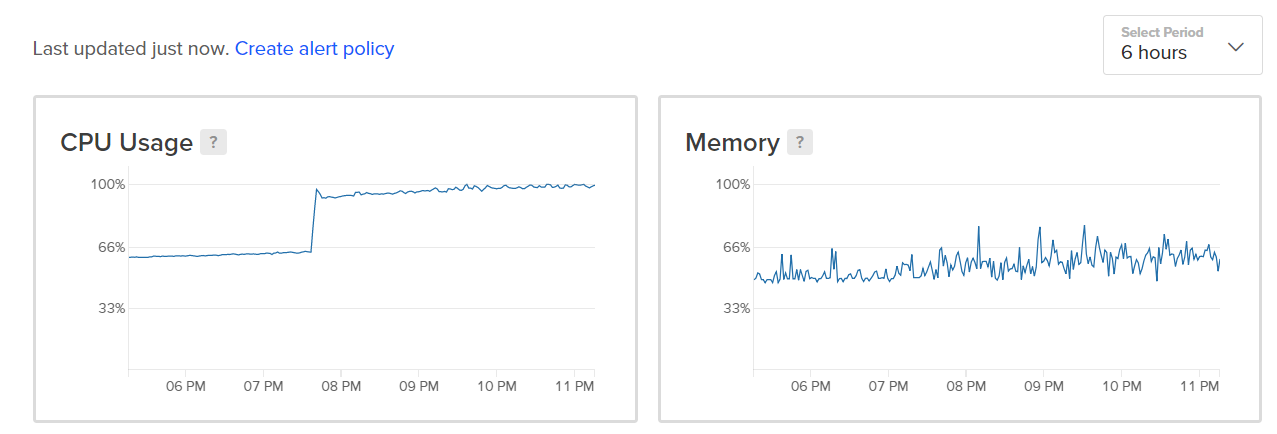
On the 24 hour view one, I went in and deleted all but two of the stations at 11am, but the CPU usage still increased slowly. Then at 7:30pm created 3 new stations with the default settings - no music files etc.
Thanks in advance, any help is appreciated!
 adamderann
All 3 comments
@adamderann Issues like this are exceptionally hard for us to diagnose, since we can't see from our end what the actual process causing the "runaway" CPU is. When this happens, can you keep an eye on it with something like htop and see what actual processes are expanding their CPU usage over time?
While I would advise against constantly running at or above 75% CPU on a $5 DO VPS (since they can and will just outright throttle your CPU for keeping it throttled all the time like that), transcoding is generally a "static" CPU compute load that doesn't increase over time, and transcoding is really the only task for which CPU is the bottleneck in the entire AzuraCast stack.
 SlvrEagle23
on 13 Feb 2019
SlvrEagle23
on 13 Feb 2019
Thanks for the reply @SlvrEagle23. After a quick contact message to DigitalOcean, the problem has seem to resolved itself.
4 stations are running constantly at 63%. When I first looked at Azuracast, I was able to safely get 8 stations on a droplet, not sure now.
On a different droplet, different DO datacentre, with only one station, the cpu is sporadic between 70 and 95%, so i'm not quite sure what's going on.
adamderann
on 17 Feb 2019
@adamderann A DO droplet is a typical VPS server which means that the resources of the host machine are shared between many VPS instances and every VPS has some share of the CPU allocated to them. Many hosting providers will throttle your VPS CPU when you are using a bigger amount of CPU capacity over longer timespans. You can check via the top command what the current st (steal) is for your VPS. This will be shown at the end of the %Cpu(s): row. This value should not exceed 10-20% for longer time periods. If it does then you should think about upgrading to a bigger VPS instance that has more resources allocated to it.
 Vaalyn
on 17 Feb 2019
Vaalyn
on 17 Feb 2019
Related issues
 dpcee30
·
3Comments
dpcee30
·
3Comments
 frozenplaya
·
4Comments
Vaalyn
·
4Comments
frozenplaya
·
4Comments
Vaalyn
·
4Comments
 bebjakub
·
3Comments
bebjakub
·
3Comments
 Rafaelrds2017
·
3Comments
Rafaelrds2017
·
3Comments
Most helpful comment
@adamderann Issues like this are exceptionally hard for us to diagnose, since we can't see from our end what the actual process causing the "runaway" CPU is. When this happens, can you keep an eye on it with something like
htopand see what actual processes are expanding their CPU usage over time?While I would advise against constantly running at or above 75% CPU on a $5 DO VPS (since they can and will just outright throttle your CPU for keeping it throttled all the time like that), transcoding is generally a "static" CPU compute load that doesn't increase over time, and transcoding is really the only task for which CPU is the bottleneck in the entire AzuraCast stack.