Aws-sam-cli: Debugging .Net Core with SAM Local not working
Description
I'm trying to debug sam-app DotNetCore 2.1 Hello World application on my environment, but couldn't get it attached.
Steps to reproduce
I've followed these steps:
https://github.com/awslabs/aws-sam-cli/blob/develop/docs/usage.md#debugging-net-core-21--20-functions
Got the application by executing sam init --runtime dotnetcore2.1
Then I did:
1) Using PowerShell: .build.ps1 --target=Package --configuration=Debug
2) Using command: docker run --rm --mount type=bind,src=e:/tools/vsdbg,dst=/vsdbg --entrypoint bash lambci/lambda:dotnetcore2.1 -c "curl -sSL https://aka.ms/getvsdbgsh | bash /dev/stdin -v latest -l /vsdbg"
3) On VS Code, I amended the launch.json with:
{
"name": ".NET Core Docker Attach",
"type": "coreclr",
"request": "attach",
"processId": "1","pipeTransport": {
"pipeProgram": "sh",
"pipeArgs": [
"-c",
"docker exec -i $(docker ps -q -f publish=5858) ${debuggerCommand}"
],
"debuggerPath": "/tmp/lambci_debug_files/vsdbg",
"pipeCwd": "${workspaceFolder}",
},"windows": {
"pipeTransport": {
"pipeProgram": "powershell",
"pipeArgs": [
"-c",
"docker exec -i $(docker ps -q -f publish=5858) ${debuggerCommand}"
],
"debuggerPath": "/tmp/lambci_debug_files/vsdbg",
"pipeCwd": "${workspaceFolder}",
}
},
4) Using command: sam local start-api -d 5858 --debugger-path e:/tools/vsdbg --profile personal
5) Using postmand: GET http://127.0.0.1:3000/hello
6) I could notice SAM Local executing giving "Waiting for the debugger to attach..."
7) I put a breakpoint on: HelloWorld.Function.FunctionHandler:line 37
8) I started VS Code debugger on ".NET Core Docker Attach"
Observed result
Nothing happens... After sometime I got a "Timeout. Proceeding without debugger." and code executes without debugging.
SAM Local:
E:Personalsam-app-dynamodbsam-app>sam local start-api -d 5858 --debugger-path e:/tools/vsdbg --profile personal --debug
2019-01-16 13:03:28 Using SAM Template at E:Personalsam-app-dynamodbsam-apptemplate.yaml
2019-01-16 13:03:28 Changing event name from creating-client-class.iot-data to creating-client-class.iot-data-plane
2019-01-16 13:03:28 Changing event name from before-call.apigateway to before-call.api-gateway
2019-01-16 13:03:28 Changing event name from request-created.machinelearning.Predict to request-created.machine-learning.Predict
2019-01-16 13:03:28 Changing event name from before-parameter-build.autoscaling.CreateLaunchConfiguration to before-parameter-build.auto-scaling.CreateLaunchConfiguration
2019-01-16 13:03:28 Changing event name from before-parameter-build.route53 to before-parameter-build.route-53
2019-01-16 13:03:28 Changing event name from request-created.cloudsearchdomain.Search to request-created.cloudsearch-domain.Search
2019-01-16 13:03:28 Changing event name from docs..autoscaling.CreateLaunchConfiguration.complete-section to docs..auto-scaling.CreateLaunchConfiguration.complete-section
2019-01-16 13:03:28 Changing event name from before-parameter-build.logs.CreateExportTask to before-parameter-build.cloudwatch-logs.CreateExportTask
2019-01-16 13:03:28 Changing event name from docs..logs.CreateExportTask.complete-section to docs..cloudwatch-logs.CreateExportTask.complete-section
2019-01-16 13:03:28 Changing event name from before-parameter-build.cloudsearchdomain.Search to before-parameter-build.cloudsearch-domain.Search
2019-01-16 13:03:28 Changing event name from docs..cloudsearchdomain.Search.complete-section to docs..cloudsearch-domain.Search.complete-section
2019-01-16 13:03:28 Setting config variable for profile to 'personal'
2019-01-16 13:03:28 local start-api command is called
2019-01-16 13:03:28 Skipping environment variable credential check because profile name was explicitly set.
2019-01-16 13:03:28 Looking for credentials via: assume-role
2019-01-16 13:03:28 Looking for credentials via: shared-credentials-file
2019-01-16 13:03:28 Found credentials in shared credentials file: ~/.aws/credentials
2019-01-16 13:03:28 Loading JSON file: C:Program FilesAmazonAWSSAMCLIruntimelibsite-packagesbotocoredataendpoints.json
2019-01-16 13:03:28 Event choose-service-name: calling handler
2019-01-16 13:03:28 Loading JSON file: C:Program FilesAmazonAWSSAMCLIruntimelibsite-packagesbotocoredataserverlessrepo2017-09-08service-2.json
2019-01-16 13:03:28 Event creating-client-class.serverlessapplicationrepository: calling handler
2019-01-16 13:03:28 The s3 config key is not a dictionary type, ignoring its value of: None
2019-01-16 13:03:28 Setting serverlessrepo timeout as (60, 60)
2019-01-16 13:03:28 Loading JSON file: C:Program FilesAmazonAWSSAMCLIruntimelibsite-packagesbotocoredata_retry.json
2019-01-16 13:03:28 Registering retry handlers for service: serverlessrepo
2019-01-16 13:03:28 No Parameters detected in the template
2019-01-16 13:03:28 2 resources found in the template
2019-01-16 13:03:28 Found Serverless function with name='HelloWorldFunction' and CodeUri='./artifacts/HelloWorld.zip'
2019-01-16 13:03:28 Trying paths: ['C:\Users\MatheusMaximodeArauj\.docker\config.json', 'C:\Users\MatheusMaximodeArauj\.dockercfg']
2019-01-16 13:03:28 Found file at path: C:UsersMatheusMaximodeArauj.dockerconfig.json
2019-01-16 13:03:28 Found 'auths' section
2019-01-16 13:03:28 Auth data for https://index.docker.io/v1/ is absent. Client might be using a credentials store instead.
2019-01-16 13:03:28 Found 'credsStore' section
2019-01-16 13:03:28 http://localhost:None "GET /v1.35/_ping HTTP/1.1" 200 2
2019-01-16 13:03:28 Event choose-service-name: calling handler
2019-01-16 13:03:28 Event creating-client-class.serverlessapplicationrepository: calling handler
2019-01-16 13:03:28 The s3 config key is not a dictionary type, ignoring its value of: None
2019-01-16 13:03:28 Setting serverlessrepo timeout as (60, 60)
2019-01-16 13:03:28 Registering retry handlers for service: serverlessrepo
2019-01-16 13:03:28 No Parameters detected in the template
2019-01-16 13:03:28 2 resources found in the template
2019-01-16 13:03:28 Found '1' API Events in Serverless function with name 'HelloWorldFunction'
2019-01-16 13:03:28 Detected Inline Swagger definition
2019-01-16 13:03:28 Lambda function integration not found in Swagger document at path='/hello' method='get'
2019-01-16 13:03:28 Found '0' APIs in resource 'ServerlessRestApi'
2019-01-16 13:03:28 Removed duplicates from '0' Explicit APIs and '1' Implicit APIs to produce '1' APIs
2019-01-16 13:03:28 1 APIs found in the template
2019-01-16 13:03:28 Event choose-service-name: calling handler
2019-01-16 13:03:28 Loading JSON file: C:Program FilesAmazonAWSSAMCLIruntimelibsite-packagesbotocoredatalambda2015-03-31service-2.json
2019-01-16 13:03:28 Event creating-client-class.lambda: calling handler
2019-01-16 13:03:28 The s3 config key is not a dictionary type, ignoring its value of: None
2019-01-16 13:03:28 Setting lambda timeout as (60, 60)
2019-01-16 13:03:28 Registering retry handlers for service: lambda
2019-01-16 13:03:28 Trying paths: ['C:\Users\MatheusMaximodeArauj\.docker\config.json', 'C:\Users\MatheusMaximodeArauj\.dockercfg']
2019-01-16 13:03:28 Found file at path: C:UsersMatheusMaximodeArauj.dockerconfig.json
2019-01-16 13:03:28 Found 'auths' section
2019-01-16 13:03:28 Auth data for https://index.docker.io/v1/ is absent. Client might be using a credentials store instead.
2019-01-16 13:03:28 Found 'credsStore' section
2019-01-16 13:03:28 Mounting HelloWorldFunction at http://127.0.0.1:3000/hello [GET]
2019-01-16 13:03:28 You can now browse to the above endpoints to invoke your functions. You do not need to restart/reload SAM CLI while working on your functions changes will be reflected instantly/automatically. You only need to restart SAM CLI if you update your AWS SAM template
2019-01-16 13:03:28 Localhost server is starting up. Multi-threading = False
2019-01-16 13:03:28 * Running on http://127.0.0.1:3000/ (Press CTRL+C to quit)
2019-01-16 13:03:50 Constructed String representation of Event to invoke Lambda. Event: {"httpMethod": "GET", "body": null, "resource": "/hello", "requestContext": {"resourceId": "123456", "apiId": "1234567890", "resourcePath": "/hello", "httpMethod": "GET", "requestId": "c6af9ac6-7b61-11e6-9a41-93e8deadbeef", "accountId": "123456789012", "stage": "prod", "identity": {"apiKey": null, "userArn": null, "cognitoAuthenticationType": null, "caller": null, "userAgent": "Custom User Agent String", "user": null, "cognitoIdentityPoolId": null, "cognitoAuthenticationProvider": null, "sourceIp": "127.0.0.1", "accountId": null}, "extendedRequestId": null, "path": "/hello"}, "queryStringParameters": null, "headers": {"Cache-Control": "no-cache", "Postman-Token": "e261198c-ad7c-4909-93ca-c16d33953f1f", "User-Agent": "PostmanRuntime/7.6.0", "Accept": "/", "Host": "127.0.0.1:3000", "Accept-Encoding": "gzip, deflate", "Connection": "keep-alive", "X-Forwarded-Proto": "http", "X-Forwarded-Port": "3000"}, "pathParameters": null, "stageVariables": null, "path": "/hello", "isBase64Encoded": false}
2019-01-16 13:03:50 Found one Lambda function with name 'HelloWorldFunction'
2019-01-16 13:03:50 Invoking HelloWorld::HelloWorld.Function::FunctionHandler (dotnetcore2.1)
2019-01-16 13:03:50 Environment variables overrides data is standard format
2019-01-16 13:03:50 Loading AWS credentials from session with profile 'personal'
2019-01-16 13:03:50 Resolving code path. Cwd=E:Personalsam-app-dynamodbsam-app, CodeUri=./artifacts/HelloWorld.zip
2019-01-16 13:03:50 Resolved absolute path to code is E:Personalsam-app-dynamodbsam-appartifactsHelloWorld.zip
2019-01-16 13:03:50 Decompressing E:Personalsam-app-dynamodbsam-appartifactsHelloWorld.zip
2019-01-16 13:03:50 File Amazon.Lambda.APIGatewayEvents.dll in zipfile does not have permission information
2019-01-16 13:03:50 File Amazon.Lambda.Core.dll in zipfile does not have permission information
2019-01-16 13:03:50 File Amazon.Lambda.Serialization.Json.dll in zipfile does not have permission information
2019-01-16 13:03:50 File HelloWorld.deps.json in zipfile does not have permission information
2019-01-16 13:03:50 File HelloWorld.dll in zipfile does not have permission information
2019-01-16 13:03:50 File HelloWorld.pdb in zipfile does not have permission information
2019-01-16 13:03:50 File HelloWorld.runtimeconfig.json in zipfile does not have permission information
2019-01-16 13:03:50 File Newtonsoft.Json.dll in zipfile does not have permission information
2019-01-16 13:03:50 Skipping building an image since no layers were defined
2019-01-16 13:03:50 Trying paths: ['C:\Users\MatheusMaximodeArauj\.docker\config.json', 'C:\Users\MatheusMaximodeArauj\.dockercfg']
2019-01-16 13:03:50 Found file at path: C:UsersMatheusMaximodeArauj.dockerconfig.json
2019-01-16 13:03:50 Found 'auths' section
2019-01-16 13:03:50 Auth data for https://index.docker.io/v1/ is absent. Client might be using a credentials store instead.
2019-01-16 13:03:50 Found 'credsStore' section
2019-01-16 13:03:50 http://localhost:None "GET /v1.35/images/lambci/lambda:dotnetcore2.1/json HTTP/1.1" 200 None
2019-01-16 13:03:50 Looking for auth config
2019-01-16 13:03:50 Using credentials store "wincred"
2019-01-16 13:03:50 Looking for auth entry for 'https://index.docker.io/v1/'
2019-01-16 13:03:50 Found auth config
2019-01-16 13:03:52 http://localhost:None "POST /v1.35/images/create?tag=dotnetcore2.1&fromImage=lambci%2Flambda HTTP/1.1" 200 None
Fetching lambci/lambda:dotnetcore2.1 Docker container image......
2019-01-16 13:03:52 Mounting C:UsersMATHEU~1AppDataLocalTemptmpi6ckro33 as /var/task:ro inside runtime container
2019-01-16 13:03:52 http://localhost:None "POST /v1.35/containers/create HTTP/1.1" 201 90
2019-01-16 13:03:52 http://localhost:None "GET /v1.35/containers/11be84ca7cf298e064fb093ddb5dca58f16dfb3c1f66e70ce731ae6fd902f179/json HTTP/1.1" 200 None
2019-01-16 13:03:52 http://localhost:None "GET /v1.35/containers/11be84ca7cf298e064fb093ddb5dca58f16dfb3c1f66e70ce731ae6fd902f179/json HTTP/1.1" 200 None
2019-01-16 13:03:53 http://localhost:None "POST /v1.35/containers/11be84ca7cf298e064fb093ddb5dca58f16dfb3c1f66e70ce731ae6fd902f179/start HTTP/1.1" 204 0
2019-01-16 13:03:53 Setting up SIGTERM interrupt handler
2019-01-16 13:03:53 http://localhost:None "GET /v1.35/containers/11be84ca7cf298e064fb093ddb5dca58f16dfb3c1f66e70ce731ae6fd902f179/json HTTP/1.1" 200 None
2019-01-16 13:03:53 http://localhost:None "POST /containers/11be84ca7cf298e064fb093ddb5dca58f16dfb3c1f66e70ce731ae6fd902f179/attach?stdout=1&stderr=1&logs=1&stream=1&stdin=0 HTTP/1.1" 101 0
Waiting for the debugger to attach...
Timeout. Proceeding without debugger.
START RequestId: d70ef1ca-a936-4917-8ab6-06495f4d1a5c Version: $LATEST
END RequestId: d70ef1ca-a936-4917-8ab6-06495f4d1a5c
REPORT RequestId d70ef1ca-a936-4917-8ab6-06495f4d1a5c Duration: 867 ms Billed Duration: 900 ms Memory Size 128 MB Max Memory Used: 46 MB
2019-01-16 13:13:55 http://localhost:None "GET /v1.35/containers/11be84ca7cf298e064fb093ddb5dca58f16dfb3c1f66e70ce731ae6fd902f179/json HTTP/1.1" 200 None
2019-01-16 13:13:55 http://localhost:None "DELETE /v1.35/containers/11be84ca7cf298e064fb093ddb5dca58f16dfb3c1f66e70ce731ae6fd902f179?v=False&link=False&force=True HTTP/1.1" 204 0
2019-01-16 13:13:55 127.0.0.1 - - [16/Jan/2019 13:13:55] "GET /hello HTTP/1.1" 200 -
Docker events:
2019-01-16T13:03:52.306960600Z image pull lambci/lambda:dotnetcore2.1 (name=lambci/lambda)
2019-01-16T13:03:52.433924100Z container create 11be84ca7cf298e064fb093ddb5dca58f16dfb3c1f66e70ce731ae6fd902f179 (image=lambci/lambda:dotnetcore2.1, name=stoic_robinson)
2019-01-16T13:03:52.622378700Z network connect 2531e757c1db9739e2fa4961ac98568013a9b64381c5fec7f13274e4ac21a69d (container=11be84ca7cf298e064fb093ddb5dca58f16dfb3c1f66e70ce731ae6fd902f179, name=bridge, type=bridge)
2019-01-16T13:03:53.154367200Z container start 11be84ca7cf298e064fb093ddb5dca58f16dfb3c1f66e70ce731ae6fd902f179 (image=lambci/lambda:dotnetcore2.1, name=stoic_robinson)
2019-01-16T13:03:53.179674800Z container attach 11be84ca7cf298e064fb093ddb5dca58f16dfb3c1f66e70ce731ae6fd902f179 (image=lambci/lambda:dotnetcore2.1, name=stoic_robinson)
2019-01-16T13:04:14.174976200Z container exec_create: /tmp/lambci_debug_files/vsdbg --interpreter=vscode 11be84ca7cf298e064fb093ddb5dca58f16dfb3c1f66e70ce731ae6fd902f179 (execID=ce4932666f344ad3c14acc4feef2407b4e83ef8696a9b8ff7c5682bc0505d2d8, image=lambci/lambda:dotnetcore2.1, name=stoic_robinson)
2019-01-16T13:04:14.180179100Z container exec_start: /tmp/lambci_debug_files/vsdbg --interpreter=vscode 11be84ca7cf298e064fb093ddb5dca58f16dfb3c1f66e70ce731ae6fd902f179 (execID=ce4932666f344ad3c14acc4feef2407b4e83ef8696a9b8ff7c5682bc0505d2d8, image=lambci/lambda:dotnetcore2.1, name=stoic_robinson)
2019-01-16T13:13:54.278192500Z container exec_die 11be84ca7cf298e064fb093ddb5dca58f16dfb3c1f66e70ce731ae6fd902f179 (execID=ce4932666f344ad3c14acc4feef2407b4e83ef8696a9b8ff7c5682bc0505d2d8, exitCode=137, image=lambci/lambda:dotnetcore2.1, name=stoic_robinson)
2019-01-16T13:13:54.434456200Z container die 11be84ca7cf298e064fb093ddb5dca58f16dfb3c1f66e70ce731ae6fd902f179 (exitCode=0, image=lambci/lambda:dotnetcore2.1, name=stoic_robinson)
2019-01-16T13:13:54.909337100Z network disconnect 2531e757c1db9739e2fa4961ac98568013a9b64381c5fec7f13274e4ac21a69d (container=11be84ca7cf298e064fb093ddb5dca58f16dfb3c1f66e70ce731ae6fd902f179, name=bridge, type=bridge)
2019-01-16T13:13:55.043738200Z container destroy 11be84ca7cf298e064fb093ddb5dca58f16dfb3c1f66e70ce731ae6fd902f179 (image=lambci/lambda:dotnetcore2.1, name=stoic_robinson)
Expected result
I was expecting my breakpoint to be hit by execution code.
Additional environment details (Ex: Windows, Mac, Amazon Linux etc)
OS Name: Microsoft Windows 10 Pro
OS Version: 10.0.17763 N/A Build 17763
DotNet Core SDK Version: 2.1.503
AWS CLI Version: aws-cli/1.16.69 Python/3.6.0 Windows/10 botocore/1.12.59
SAM Version: SAM CLI, version 0.10.0
Docker version 18.09.1, build 4c52b90
Add --debug flag to command you are running
 matheusmaximo
All 30 comments
Do you have any update on this? I have similar issues - following the exact same steps as you, when starting the debugger in VS Code it starts loading .dll's:
......
Loaded '/var/lang/bin/shared/Microsoft.NETCore.App/2.1.6/System.Net.NameResolution.dll'. Skipped loading symbols. Module is optimized and the debugger option 'Just My Code' is enabled.
Loaded '/var/lang/bin/shared/Microsoft.NETCore.App/2.1.6/System.Memory.dll'. Module was built without symbols.
Loaded '/var/lang/bin/shared/Microsoft.NETCore.App/2.1.6/System.Threading.ThreadPool.dll'. Module was built without symbols.
Loaded '/var/lang/bin/shared/Microsoft.NETCore.App/2.1.6/System.Buffers.dll'. Module was built without symbols.
.....
And then all of a sudden:
The pipe program 'powershell' exited unexpectedly with code 1.
But the terminal, that was previously saying "Waiting for the debugger to attach...", seems to have executed the request, because it shows me the report of it. Then if I refresh the page, shows the "Waiting..." again, again trying the debugger - and the same thing happens. Never hitting the brakepoint in my function.
Any ideas on that?
PS: Checked the event logs of Powershell for some clue, but nothing. There everything seems ok.
 Babalev
on 1 Feb 2019
Babalev
on 1 Feb 2019
I still have the same problem.
matheusmaximo
on 6 Feb 2019
I've just upgraded everything now and still having the same problem. Nothing changed.
Any chance to have this sorted or any help/workaround?
Thanks
matheusmaximo
on 18 Feb 2019
just checking, do you have the latest versions of lambci containers?
 sriram-mv
on 20 Feb 2019
sriram-mv
on 20 Feb 2019
Sorry, in order to make debugging work, should I have my own lambci container?
I'm running "sam local" isn't it intend to download the latest version?
May I misunderstood that part...
matheusmaximo
on 21 Feb 2019
Yes it is supposed to, was wondering if you did have the latest version of the containers downloaded, because the latest version is the one that has support for debugging in VSCode. I'll also tag @ndobryanskyy here to see, if its something he experienced.
https://github.com/lambci/docker-lambda/blob/master/dotnetcore2.1/run/MockBootstraps/Program.cs#L13
sriram-mv
on 21 Feb 2019
I couldn't find any reference about that on the docs.
How can I download the lambci container and make sam local use it?
matheusmaximo
on 22 Feb 2019
I updated my lambci images a couple of days ago, and I'm using the latest ones, but still have the same powershell issue
Babalev
on 23 Feb 2019
Hello, guys, great thanks for posting the exact steps to reproduce the issue, which I've taken and got different results:

For me it seems to work well.
@matheusmaximo , I think maybe you have some troubles with sharing the Drive E: (and therefore mounting vsdbg) ? Try resetting the credentials, or just checking the E: drive in "shared drives" section of Docker settings. Also, to get the whole picture, could you explain what happens when you start .NET Core Docker Attach in VS Code? Does it fail immediately? In that case the problem is certainly in incorrect vsdbg setup.
 ndobryanskyy
on 23 Feb 2019
ndobryanskyy
on 23 Feb 2019
As for you @Babalev are you sure, that you build with -Configuration Debug ?
ndobryanskyy
on 23 Feb 2019
And, regarding images, if I am not wrong, SAM CLI always downloads latest versions from Docker Hub, so you shouldn't worry about keeping them up to date.
Correct me if I am wrong @TheSriram ?
ndobryanskyy
on 23 Feb 2019
Thanks for your reply @ndobryanskyy
Here you will find my docker installing VSDBG to E:/tools/VSDBG folder

Here you will find my try to debug (after a timeout, script goes ahead without debugging):

Here is my launch.json:

matheusmaximo
on 25 Feb 2019
@ndobryanskyy - Thanks. This was it. I had to run the build.ps1 with the debug configuration. Strange, so far I taught I was doing it. Anyway - problem solved for me.
Babalev
on 25 Feb 2019
@Babalev, I'm glad to help, happy debugging 🎉 By the way, you could change the default configuration in the build.cake file, initially it is set to Release.
@matheusmaximo could you try to manually exec into the running lambda container, to verify, that vsdbg is successfully mounted, as it seems to me - it is not actually.
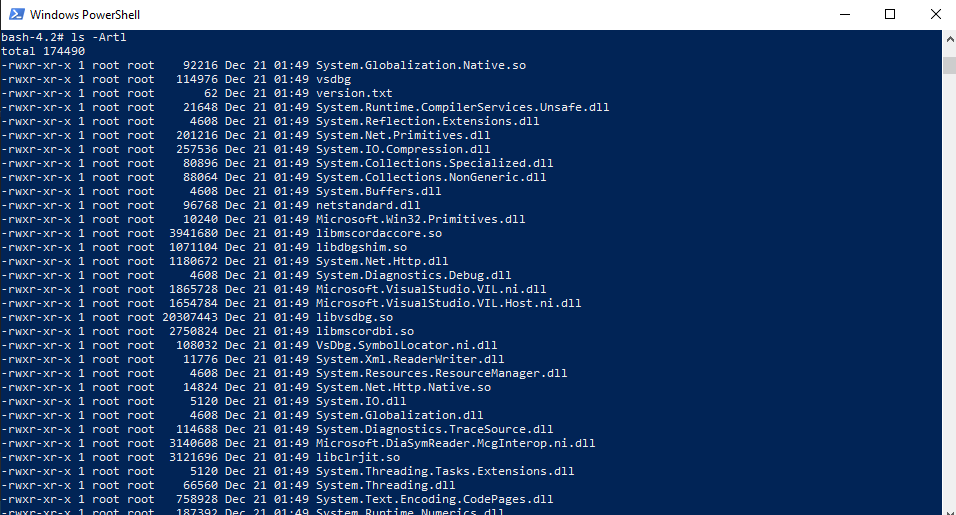
To do so, use SAM to start-api with your current arguments. Request localhost:3000/hello and wait until "Waiting for the debugger to attach..." message appears. Then open another Powershell window and execute docker exec -it $(docker ps -q -f publish=5858) bash that will get you inside the running lambda container in interactive mode with bash available. While inside the container change directory (execute cd /tmp/lambci_debug_files/) to the folder which should contain mounted vsdbg folder files. Execute ls from it -> you should be seeing various files, and most importantly vsdbg binary among them.
@matheusmaximo, please take the steps I've described above and share the results
ndobryanskyy
on 26 Feb 2019
@ndobryanskyy once more, thanks for your help!
Here are the prints:


matheusmaximo
on 26 Feb 2019
@matheusmaximo I think I've spotted the problem it is in launch.json of VS Code. You have incorrectly specified processId it should be set to 1, because Docker assigns entry point executable PID of 1.
Please, try to correct it, and get back with the results
ndobryanskyy
on 26 Feb 2019
@ndobryanskyy thanks for quickly responding!
Whatever number I put for proccessId I get the same result. Here is the print:

matheusmaximo
on 26 Feb 2019
@ndobryanskyy can I ask you one question?
Should I check "Expose daemon on tcp://localhost:2375 without TLS" docker option?

matheusmaximo
on 26 Feb 2019
Another question, do you think the problem could be related with I having a specific profile and not having a default profile set for aws credentials?
matheusmaximo
on 26 Feb 2019
These are my docker events after I press Debug on VS Code:

That makes me think docker is receiving commands from VS Code...
matheusmaximo
on 26 Feb 2019
@matheusmaximo that is very strange, that the issue is not yet fixed with the correct processId (it is still important to keep it as 1) - I might still be missing something. Try recreating your launch.json file by documentation again from scratch.
Answering your question: no, you don't need to have daemon exposed without TLS debugging should work without it.
I am not sure about profiles things, maybe @TheSriram will have more insights into it.
And yes, VS Code is executing docker commands as you could see in the launch,json file, so it is natural, that you have them logged in the events. You could get more insights about how feature works from here.
And just to be sure, you when you hit the api endpoint (localhost:3000/hello), you wait for the "Waiting for the debugger to attach" message from the SAM, then go to the VS Code hit F5 and it fails immediately (I mean VS Code shows this error message dialog)? Or it hangs for 10 minutes?
ndobryanskyy
on 26 Feb 2019
@ndobryanskyy it hangs for 10 minutes then SAM gives a timeout message, run the code, terminate the docker image and I get the error message from VSCode saying the powershel exited.
matheusmaximo
on 26 Feb 2019
@matheusmaximo in that case I could suggest you do the following:
- Uninstall Docker for Windows completely
- Reinstall it to the latest version
- Make sure, that you share the drive, that your lambda and vsdbg is on
- Try to debug again (do not forget to set PID of 1)
I hope the above would help, because there is no sane reason, for the debugging to not work for you (but you should get the --profile thing covered, or try to not use it, for example, and specify --region explicitly)
Please do the following steps if it is possible for you, and get back with the results.
Warning: reinstalling Docker will remove all of your volumes, images and etc. so be careful with that, and if required backup them
ndobryanskyy
on 28 Feb 2019
I will try it this weekend.
matheusmaximo
on 28 Feb 2019
@ndobryanskyy you are right, SAM CLI always downloads the latest images from lambci as long as you are connected to the internet. I wouldnt think profiles have any bearings on this.
sriram-mv
on 28 Feb 2019
@matheusmaximo I wonder if the latest solution worked for you?
ndobryanskyy
on 25 Mar 2019
Hi @ndobryanskyy ! I was in holidays, just back yesterday. So I'm going back to this issue this week. Thanks.
matheusmaximo
on 2 Apr 2019
@matheusmaximo I've run into the same issue. It appears that the debugger never attaches, however, if you hit enter a several times on the VSCode Debug Console expression evaluation line then eventually things work but debugging is painful as you need to continue to hit enter many times in between breakpoints and Locals, etc take an age to load.
A little playing about and it looks to be an issue with PowerShell, I'm running Windows 1809.
$ $PSVersionTable.PSVersion

Major  Minor  Build  Revision
-----  -----  -----  --------
5      1      17763  316
Switching to another shell yields better results.
      "windows": {
        "pipeTransport": {
          "pipeProgram": "bash.exe",
          "pipeArgs": [
            "-c",
            "docker.exe exec -i $(docker.exe ps -q -f publish=5858) ${debuggerCommand}"
          ],
          "debuggerPath": "/tmp/lambci_debug_files/vsdbg",
          "pipeCwd": "${workspaceFolder}"
        }
      }
The above is using WSL Bash, note docker.exe to use the Windows Docker binary (if you have installed Docker in WSL then this would not need to be appended), which works without issue.
Using PowerShell 6.2.0 (choco install -y powershell-core) also seems to work well, YMMV
      "windows": {
        "pipeTransport": {
          "pipeProgram": "pwsh",
          "pipeArgs": [
            "-c",
            "docker exec -i $(docker ps -q -f publish=5858) ${debuggerCommand}"
          ],
          "debuggerPath": "/tmp/lambci_debug_files/vsdbg",
          "pipeCwd": "${workspaceFolder}"
        }
      }
Hopefully someone can use this extra information to get to the root of the issue.
 jimgolfgti
on 5 Apr 2019
jimgolfgti
on 5 Apr 2019
@jimgolfgti Thank you very much!
I decided to go for PowerShell 6.2.0! It works like a charm!
@ndobryanskyy I'm not sure if this problem is connected to aws-sam-cli or not, but as this issue was fixed, I'm going to close it. Thank you very much for your help!
matheusmaximo
on 5 Apr 2019
It seems the docs are a bit out of date on this. They instruct:
cd src/HelloWorld && dotnet publish -c Debug && cd ../..
However, what worked for me was this (from gitbash.exe terminal on windows 10)
pwsh build.ps1 -Configuration Debug
Only after doing that and following the other instructions could I get a debugger to attach.
 danludwig
on 8 Jul 2019
danludwig
on 8 Jul 2019
Related issues
 GerbenRampaart
·
3Comments
GerbenRampaart
·
3Comments
 drumadrian
·
3Comments
drumadrian
·
3Comments
 debuggins
·
4Comments
debuggins
·
4Comments
 rhlsthrm
·
4Comments
rhlsthrm
·
4Comments
 chestongo
·
3Comments
chestongo
·
3Comments
Most helpful comment
@matheusmaximo I've run into the same issue. It appears that the debugger never attaches, however, if you hit enter a several times on the VSCode Debug Console expression evaluation line then eventually things work but debugging is painful as you need to continue to hit enter many times in between breakpoints and Locals, etc take an age to load.
A little playing about and it looks to be an issue with PowerShell, I'm running Windows 1809.
Switching to another shell yields better results.
The above is using WSL Bash, note
docker.exeto use the Windows Docker binary (if you have installed Docker in WSL then this would not need to be appended), which works without issue.Using PowerShell 6.2.0 (
choco install -y powershell-core) also seems to work well, YMMVHopefully someone can use this extra information to get to the root of the issue.