Async-profiler: Allocation stacktrace incomplete with JRE 9
Hi,
When I use AsyncProfiler with an Oracle JRE 9 JVM I only get one horizontal level of stacktrace for _alloc_ event using _collapsed_ and/or _svg_ output formats. While, for the same bytecode, I get a complete stacktrace with Oracle JRE 8 JVM.
Code (compiled with Oracle JDK 8):
public class AsyncProfilerTest {

    public static void main(String[] args) {
        a();
    }

    private static void a() {
        for(long i=0;i<Long.MAX_VALUE;i++) {
            System.out.println("a:"+Math.random());
            if(i%100 == 0) b();
            if(i%10 == 0) c();
        }
    }

    private static void b() {
        System.out.println("b:"+Math.random());
    }

    private static void c() {
        System.out.println("c:"+Math.random());
        if(Math.random()>0.7) d();
    }

    private static void d() {
        System.out.println("f:"+Math.random());
    }

}
Profiling command : _./profiler.sh -d 60 -e alloc -f output_heap.svg -o svg pid_
SVG output with Oracle JRE 8 JVM :
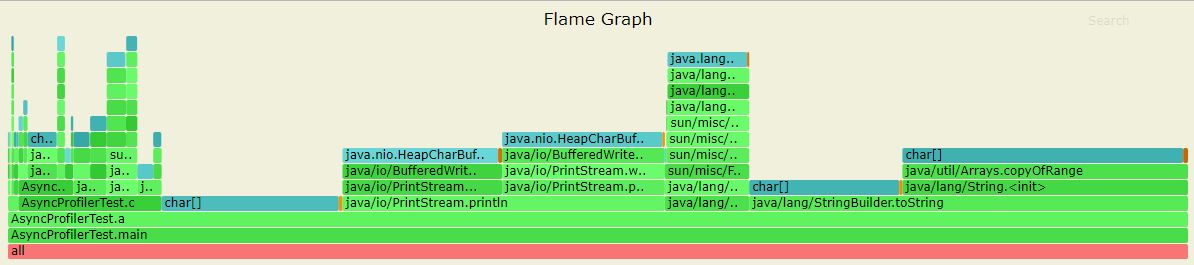
SVG output with Oracle JRE 9 JVM :

Code, Bytecode, Collapsed & SVG : AsyncProfiler_JRE9.zip
Thanks
 aminebag
All 6 comments
The same problem as #60.
I've fixed that once, but soon realized that the fix may sometimes crash JVM (#64) and therefore rolled back the changes.
Will solve this properly in #66.
 apangin
on 26 Mar 2018
apangin
on 26 Mar 2018
Thanks for the quick response !
aminebag
on 26 Mar 2018
I discovered that AsyncGetCallTrace stack walking has been broken since JDK 8u141 by the following commit in HotSpot:
http://hg.openjdk.java.net/jdk8u/jdk8u/hotspot/rev/9ffa0d7ed932
If I revert this change and recompile JVM, allocation stack traces will return back again.
I will look how to work around this issue.
apangin
on 12 Apr 2018
Re-implemented stack walking for heap and lock profiling.
Now it relies on internal JVM call instead of AsyncGetCallTrace.
This is a rebirth of fe8b437e0f013d5cdf4a37beb237436063537de7, but now JVM implementation is called directly rather than through public JVMTI interface to prevent deadlocks like #64.
Now Allocation profiling should work on all versions of OpenJDK and Oracle JDK starting from JDK 7u45 up to JDK 11 EA+12. Moreover, allocation stack traces are now exact.
apangin
on 6 May 2018
I'll be glad to know whether the fix works for you.
apangin
on 6 May 2018
After the fix it works fine with JVM 9 and 10. Thanks !
aminebag
on 9 May 2018
Related issues
 henryjcee
·
5Comments
henryjcee
·
5Comments
 franz1981
·
8Comments
franz1981
·
8Comments
 stsypanov
·
5Comments
stsypanov
·
5Comments
 ryenus
·
5Comments
ryenus
·
5Comments
 msridhar
·
6Comments
msridhar
·
6Comments
Most helpful comment
The same problem as #60.
I've fixed that once, but soon realized that the fix may sometimes crash JVM (#64) and therefore rolled back the changes.
Will solve this properly in #66.