Async-profiler: ReentrantLock contention
Hi guys,
First on above: thanks for this awesome project and for the hard work on it!!!
Now my question: would be possible to have a contention profiling for Java's ReentrantLocks similar to the -e lock option?
I was looking http://www.brendangregg.com/offcpuanalysis.html to find something similar, given that under contention ReentrantLock uses Unsafe::park/unpark, but having it on the async-profiler toolkit would be awesome.
If there is something I could help to make it possible I would be very happy to contribute :+1:
Thanks,
Franz
 franz1981
All 8 comments
Yes, this is absolutely possible. I think I can implement this if not in the nearest, then in the next release.
 apangin
on 27 Feb 2018
apangin
on 27 Feb 2018
That's would be awesome, thanks!
franz1981
on 27 Feb 2018
-e lock now handles both intrinsic locks and ReentrantLocks.
apangin
on 2 Mar 2018
Thanks for this change!!!
I've just refreshed by local repo with the last changes and compiled the whole with make.
I'm not a C guy and I'm hoping to do not have mess with anything...
I've built this test program:
   public static void main(String[] args) {
      final int tokens = 1;
      final boolean jucLock = true;
      final ReentrantLock lock = new ReentrantLock();
      final Object obj = new Object();
      final int writers = 4;
      final AtomicBoolean stop = new AtomicBoolean();
      ExecutorService executorService = Executors.newCachedThreadPool();
      for (int i = 0; i < writers; i++) {
         if (jucLock) {
            executorService.execute(() -> {
               while (!stop.get()) {
                  lock.lock();
                  Blackhole.consumeCPU(tokens);
                  lock.unlock();
               }
            });
         } else {
            executorService.execute(() -> {
               while (!stop.get()) {
                  synchronized (obj) {
                     Blackhole.consumeCPU(tokens);
                  }
               }
            });
         }
      }
      executorService.shutdown();
      Runtime.getRuntime().addShutdownHook(new Thread(() -> {
         stop.lazySet(true);
      }));
   }
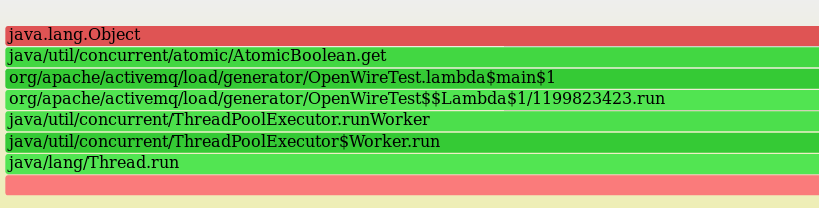
Using synchronized I'm getting this:
While for the ReentrantLock I'm receiving from flamegraph:
ERROR: No stack counts found
Probably I've done something wrong on compilation or the test I've written has something wrong.
There is anything I could do to help beside looking at make output (that doesn't seems to have emitted any warning/error)?
franz1981
on 3 Mar 2018
Works for me. How do you run the target program and the profiler? What JDK version do you use?
./profiler.sh -d 10 -e lock -f locks.svg PID generates the following flame graph:

apangin
on 3 Mar 2018
I have finally managed to understand the error, sorry :(
I wasn't running correctly the program :O
Now I finally see them:
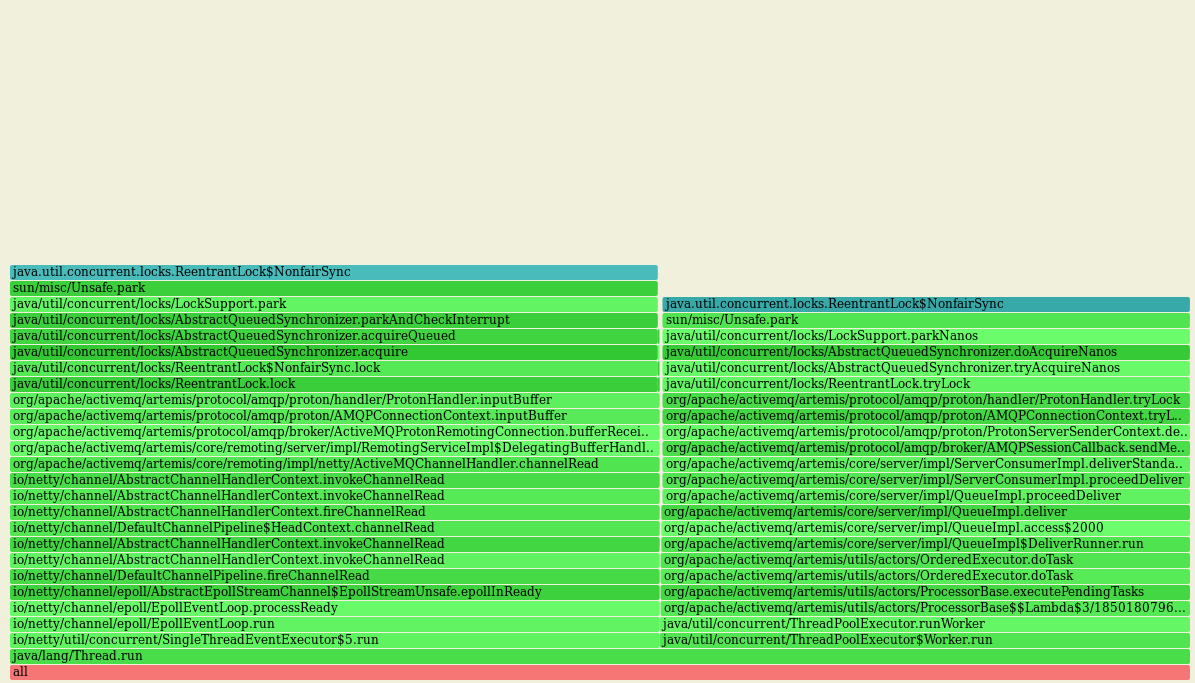
What is strange is that now I can see only ReentrantLock(s) but no intrinsic locks, maybe is just a case.
With the previous version of the profiler I remember that there were intrinsic locks too: I will run a program that will use both to see if is true :+1:
franz1981
on 3 Mar 2018
I guess in your case the number of contended intrinsic locks is so small comparing to ReentrantLocks, that intrinsic locks were skipped as negligible from the result flamegraph.
You may modify the threshold with --minwidth argument or try different output format (e.g. -o traces) to make sure intrinsic locks are still there.
apangin
on 4 Mar 2018
I guess in your case the number of contended intrinsic locks is so small comparing to ReentrantLocks, that intrinsic locks were skipped as negligible from the result flamegraph.
Guess correct!
Thanks to have added this feature in such a small time! :+1:
franz1981
on 5 Mar 2018
Related issues
franz1981
·
4Comments
 aminebag
·
6Comments
aminebag
·
6Comments
 ceeaspb
·
6Comments
ceeaspb
·
6Comments
 yaoliao
·
5Comments
yaoliao
·
5Comments
 shipilev
·
4Comments
shipilev
·
4Comments
Most helpful comment
-e locknow handles both intrinsic locks and ReentrantLocks.