Argo-cd: Application Controller memory spike during startup
Checklist:
- [X] I've searched in the docs and FAQ for my answer: http://bit.ly/argocd-faq.
- [X] I've included steps to reproduce the bug.
- [X] I've pasted the output of
argocd version.
Describe the bug
The application-controller container exhausts all the available memory (up to 13GB in our testing) and crashes the kubernetes node. We have to recreate the node to resolve temporarily, but it immediately starts using more and more memory again and will crash the node after about 5-10 minutes.
To Reproduce
Run application-controller v1.4.2 with the following flags:
argocd-application-controller
      --status-processors
      30
      --operation-processors
      30
      --repo-server
      argocd-repo-server:8081
      --loglevel
      info
      --redis
      argocd-redis:6379
(We've also reproduced this behavior when setting the status-processors to 20 and the operation-processors to 10).
Use the Helm operator to deploy a few applications. The controller begins using excessive memory.
Expected behavior
The controller's memory use stays relatively constant over time.
Screenshots
n/a
Version
argocd: v1.4.2+48cced9
  BuildDate: 2020-01-24T01:07:43Z
  GitCommit: 48cced9d925b5bc94f6aa9fa4a8a19b2a59e128a
  GitTreeState: clean
  GoVersion: go1.12.6
  Compiler: gc
  Platform: darwin/amd64
argocd-server: v1.5.0+9d1a378
  BuildDate: 2020-03-13T23:12:37Z
  GitCommit: 9d1a378ce8660e6d41861ae972295c7765320621
  GitTreeState: clean
  GoVersion: go1.14
  Compiler: gc
  Platform: linux/amd64
  Ksonnet Version: v0.13.1
  Kustomize Version: Version: {Version:kustomize/v3.2.1 GitCommit:d89b448c745937f0cf1936162f26a5aac688f840 BuildDate:2019-09-27T00:10:52Z GoOs:linux GoArch:amd64}
  Helm Version: version.BuildInfo{Version:"v3.1.1", GitCommit:"afe70585407b420d0097d07b21c47dc511525ac8", GitTreeState:"clean", GoVersion:"go1.13.8"}
  Kubectl Version: v1.14.0
Logs
n/a
 jessebye
All 8 comments
I was able to reproduce it on one of our instances. At the start, the controller tries to get an initial cluster state. It loads all available resources and keeps only group/kind/name and owner references in memory. The problem is that it loads all resources in parallel that causes memory usage spike. We should limit the number of resource types that it is trying to load at the same time during initialization.
Working on fix.
 alexmt
on 19 Mar 2020
alexmt
on 19 Mar 2020
To be clear, this is not a memory leak, it's a memory spike related to the initial rebuilding of the in-memory cluster cache, that happens whenever the controller restarts. The solution is to "flatten the curve" of the memory spike through a semaphore.
 jessesuen
on 24 Mar 2020
jessesuen
on 24 Mar 2020
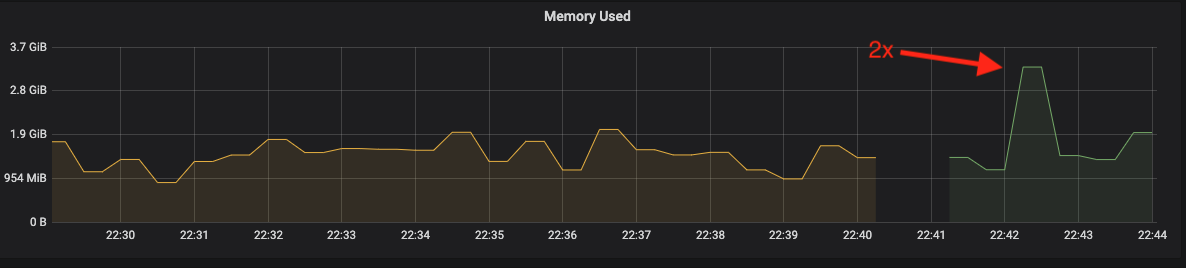
Here are some test results of https://github.com/argoproj/argo-cd/pull/3299
Controller restart before changes (~2x spike during initialization):
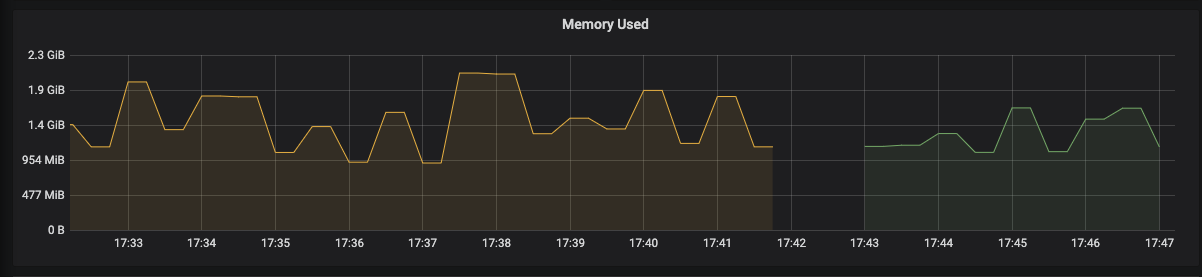
Controller restart after changes:
alexmt
on 28 Mar 2020
Tested several bigger instances. I still see memory spike during initialization. Spike is ~50% smaller but this is still not good enough to close the ticket. Next step is to add a customizable limit of concurrent k8s list operations.
alexmt
on 28 Mar 2020
Even if the node doesn't crash, I see that my prometheus-operator Application (points at _stable_ Helm chart) stays "Syncing" indefinitely, with no log messages. Related? Memory usage is 1.2GB at startup time, and CPU/memory use remains high.
 AndiDog
on 18 May 2020
AndiDog
on 18 May 2020
Is there any workaround to this issue? I've tried to isolate this onto its own 16GB node, but it still grows to fill the node before being OOM Killed. I can keep increases my node memory size, but as of now, my ArgoCD is offline.
 jseriff
on 4 Jun 2020
jseriff
on 4 Jun 2020
Closed too early
alexmt
on 8 Jun 2020
@alexmt, how does that translates in term of release? The changelog in release notes isn't obvious.
We're still seeing memory usage of several GB in v1.6.1
 tux-o-matic
on 14 Aug 2020
tux-o-matic
on 14 Aug 2020
Related issues
 haf
·
3Comments
haf
·
3Comments
 chiragthaker
·
3Comments
chiragthaker
·
3Comments
 KarstenSiemer
·
3Comments
KarstenSiemer
·
3Comments
 ksaito1125
·
3Comments
ksaito1125
·
3Comments
 travis-sobeck
·
3Comments
travis-sobeck
·
3Comments
Most helpful comment
I was able to reproduce it on one of our instances. At the start, the controller tries to get an initial cluster state. It loads all available resources and keeps only group/kind/name and owner references in memory. The problem is that it loads all resources in parallel that causes memory usage spike. We should limit the number of resource types that it is trying to load at the same time during initialization.
Working on fix.