Apexcharts.js: Add custom text on radialBar Chart
Hi I do not speak English well but this radialBar has been used so beautifully
This radialBar is very good.
So, i used my project.
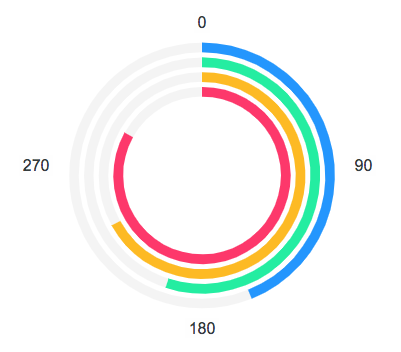
i need radialBar xaxis So, i tried
Where is xaxis on radialBar ?
plz, your answer
thank you
 lsjzzang17
All 5 comments
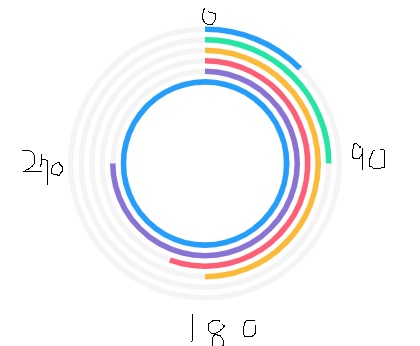
There is no direct option to draw labels as you described in the image.
But, you can use ApexChart's addText() method to draw custom text elements on the chart area.
Here is a codepen example which produces this result.
The code for generating these labels
var chartAreaBounds = chart.w.globals.dom.baseEl.querySelector('.apexcharts-inner').getBoundingClientRect();

chart.addText({
  x: chartAreaBounds.width / 2,
  y: 10,
  text: "0",
  fontSize: 16,
  textAnchor: "middle"
});

chart.addText({
  x: chartAreaBounds.width - 5,
  y: chartAreaBounds.height / 2 + 10,
  text: "90",
  fontSize: 16,
  textAnchor: "start"
});

chart.addText({
  x: chartAreaBounds.width / 2,
  y: chartAreaBounds.height + 30,
  text: "180",
  fontSize: 16,
  textAnchor: "middle"
});

chart.addText({
  x: 5,
  y: chartAreaBounds.height / 2 + 10,
  text: "270",
  fontSize: 16,
  textAnchor: "end"
});
 junedchhipa
on 23 Oct 2018
junedchhipa
on 23 Oct 2018
I was impressed by your efforts !
your answer is give hope to me
thank you
have a nice day!
lsjzzang17
on 23 Oct 2018
@junedchhipa
I have tried your answer. but I got an error: (in codepen example also)
chart.addText is not a function
Is there any solution to this?
 suhailkc
on 10 Mar 2020
suhailkc
on 10 Mar 2020
Hi @junedchhipa,
I have the same problem with the latest release.
 EduardChernyak
on 10 Apr 2020
EduardChernyak
on 10 Apr 2020
@junedchhipa
I have tried your answer. but I got an error: (in codepen example also)
chart.addText is not a functionIs there any solution to this?
I don't see anything either in the codepen example
 dfiorini
on 6 May 2021
dfiorini
on 6 May 2021
Related issues
 GalacticSun
·
29Comments
GalacticSun
·
29Comments
 LucaCorcella
·
14Comments
LucaCorcella
·
14Comments
 Vvelghe
·
15Comments
Vvelghe
·
15Comments
 filipinyo
·
14Comments
filipinyo
·
14Comments
 RyanMooreOPS
·
16Comments
RyanMooreOPS
·
16Comments
Most helpful comment
There is no direct option to draw labels as you described in the image.
But, you can use ApexChart's

addText()method to draw custom text elements on the chart area.Here is a codepen example which produces this result.
The code for generating these labels